Academic Profile
Statistics
Similar Authors
Papers on arXiv
We present the results of a comprehensive analysis of visualization paper keywords supplied for 4366 papers submitted to five main visualization conferences. We describe main keywords, topic areas, ...
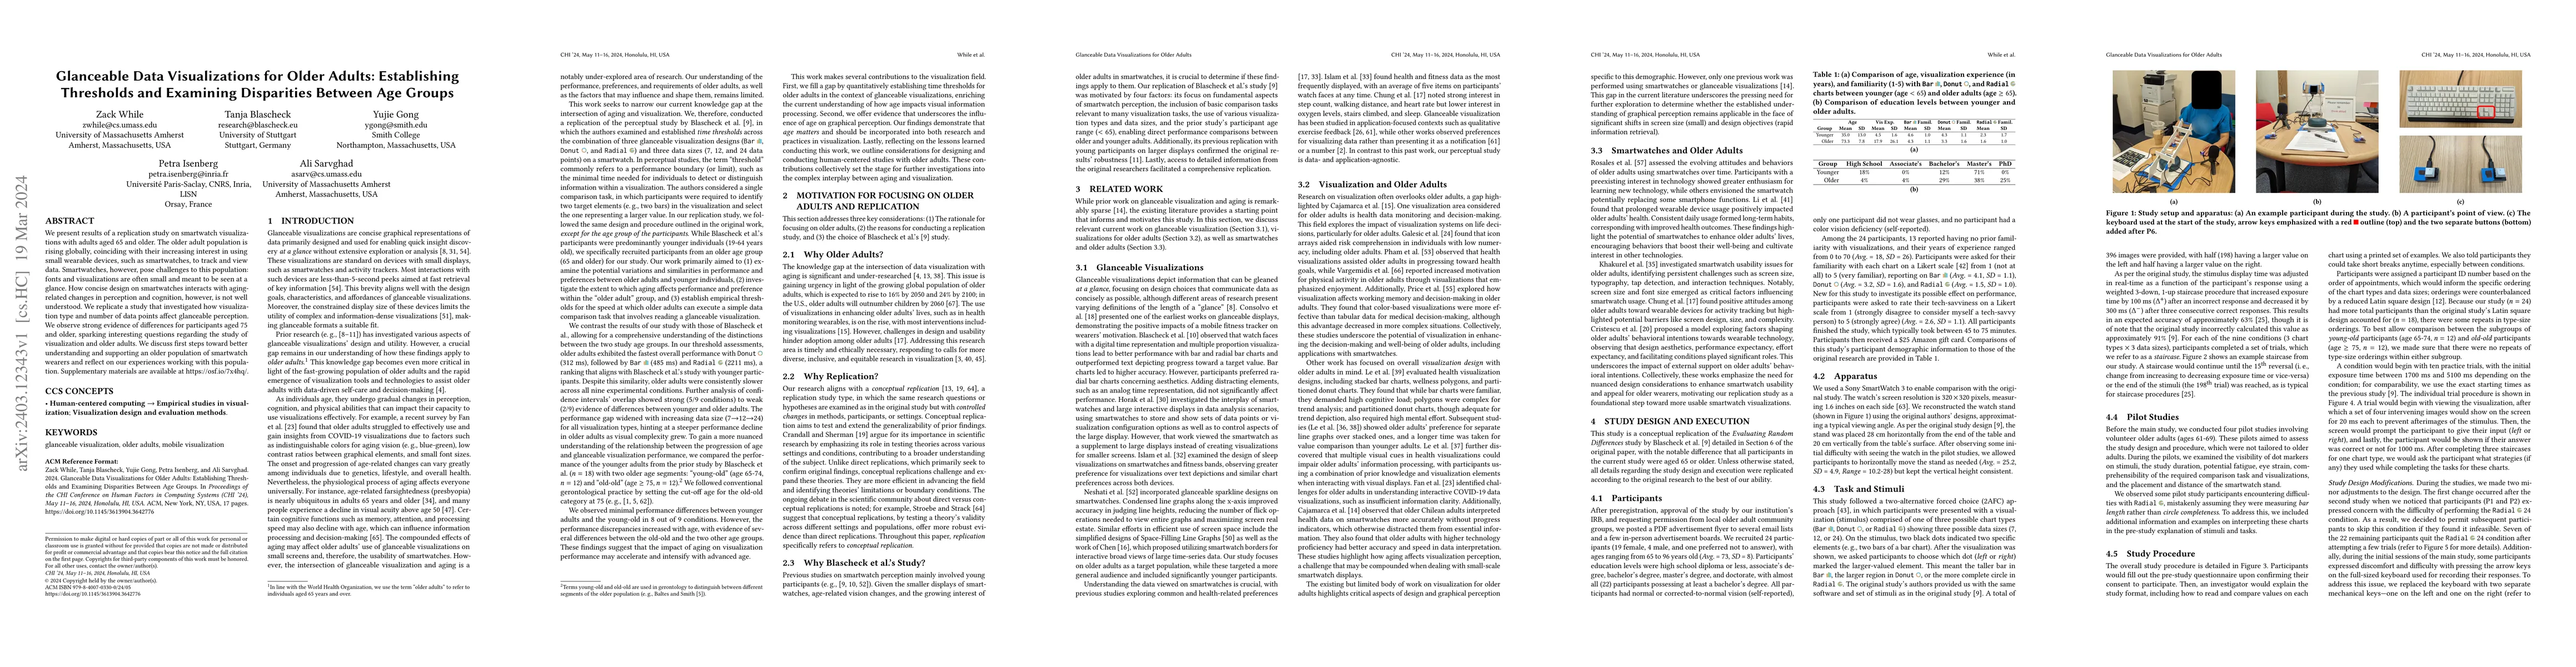
We present results of a replication study on smartwatch visualizations with adults aged 65 and older. The older adult population is rising globally, coinciding with their increasing interest in usin...
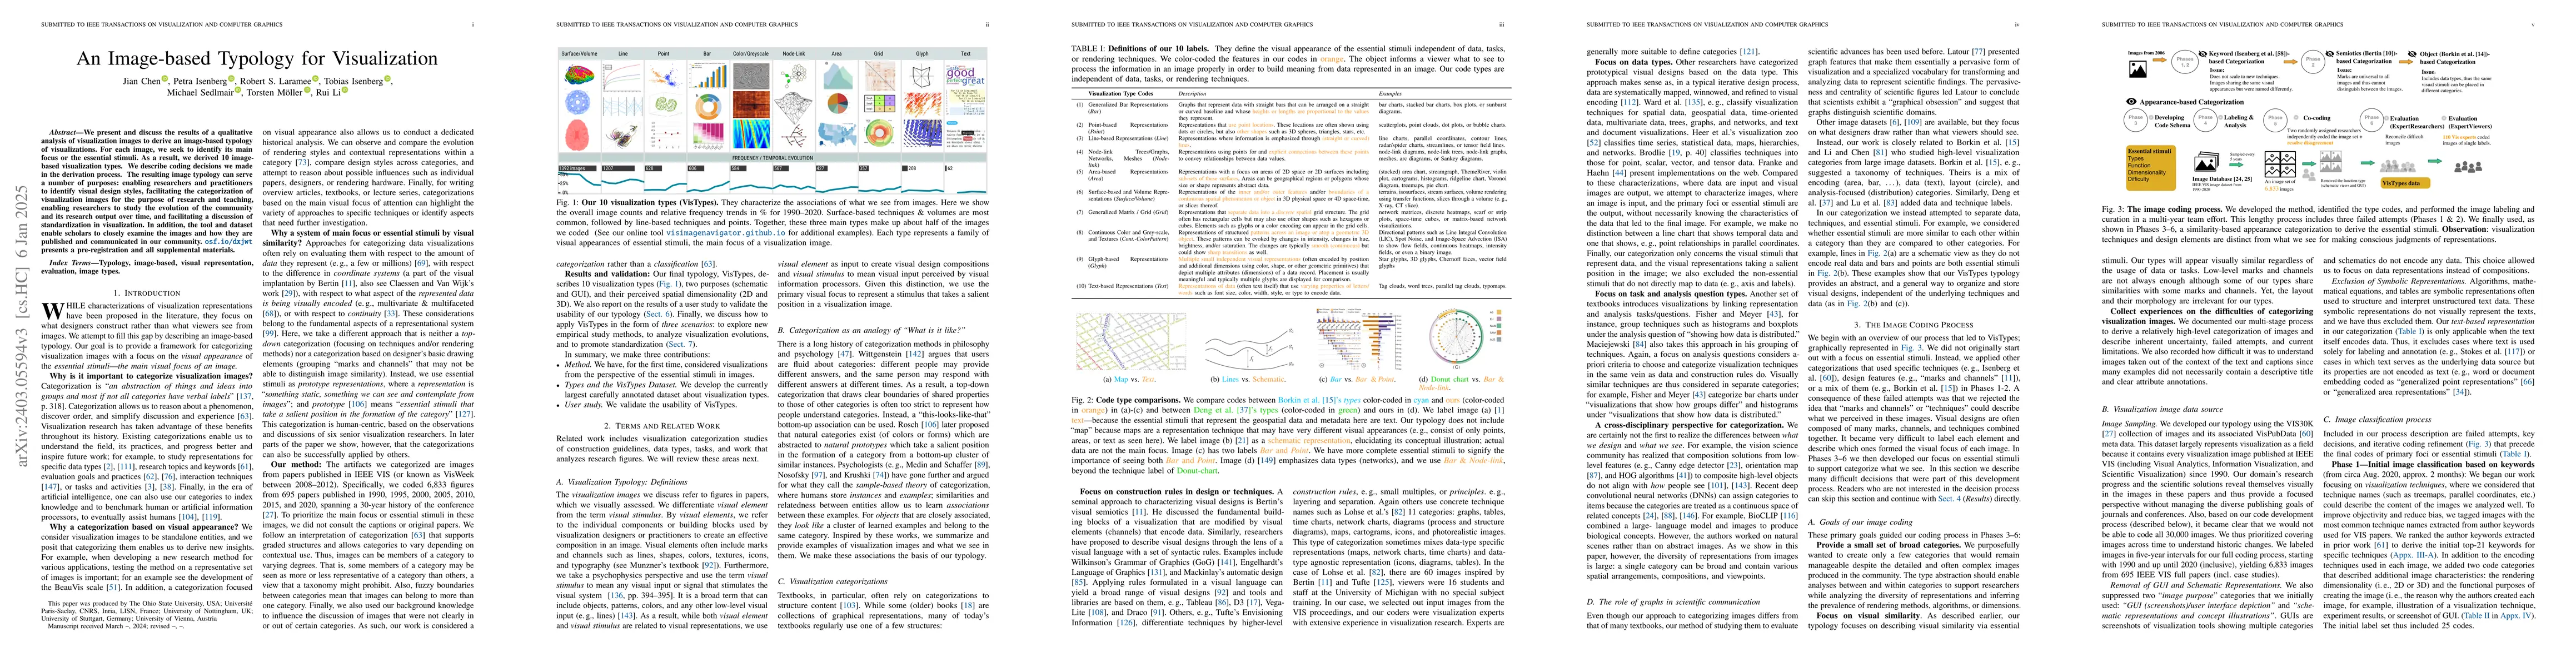
We present and discuss the results of a qualitative analysis of visual representations from images. We labeled each image's essential stimuli, the removal of which would render a visualization unint...
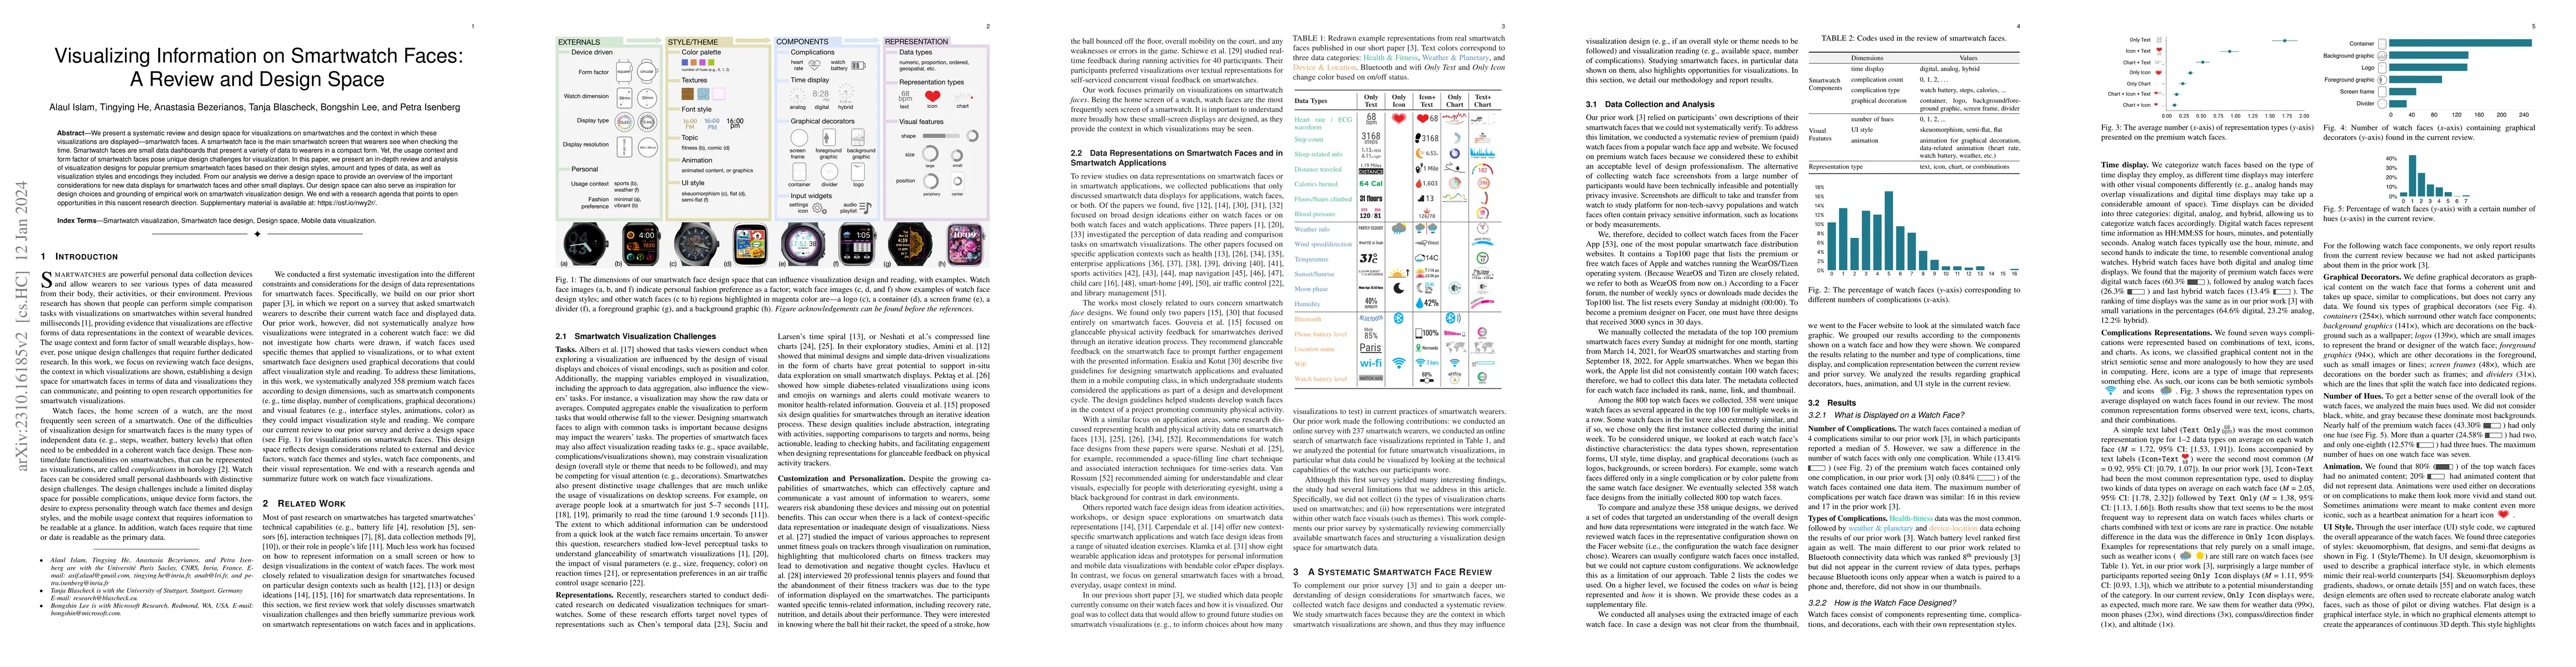
We present a systematic review and design space for visualizations on smartwatches and the context in which these visualizations are displayed--smartwatch faces. A smartwatch face is the main smartw...
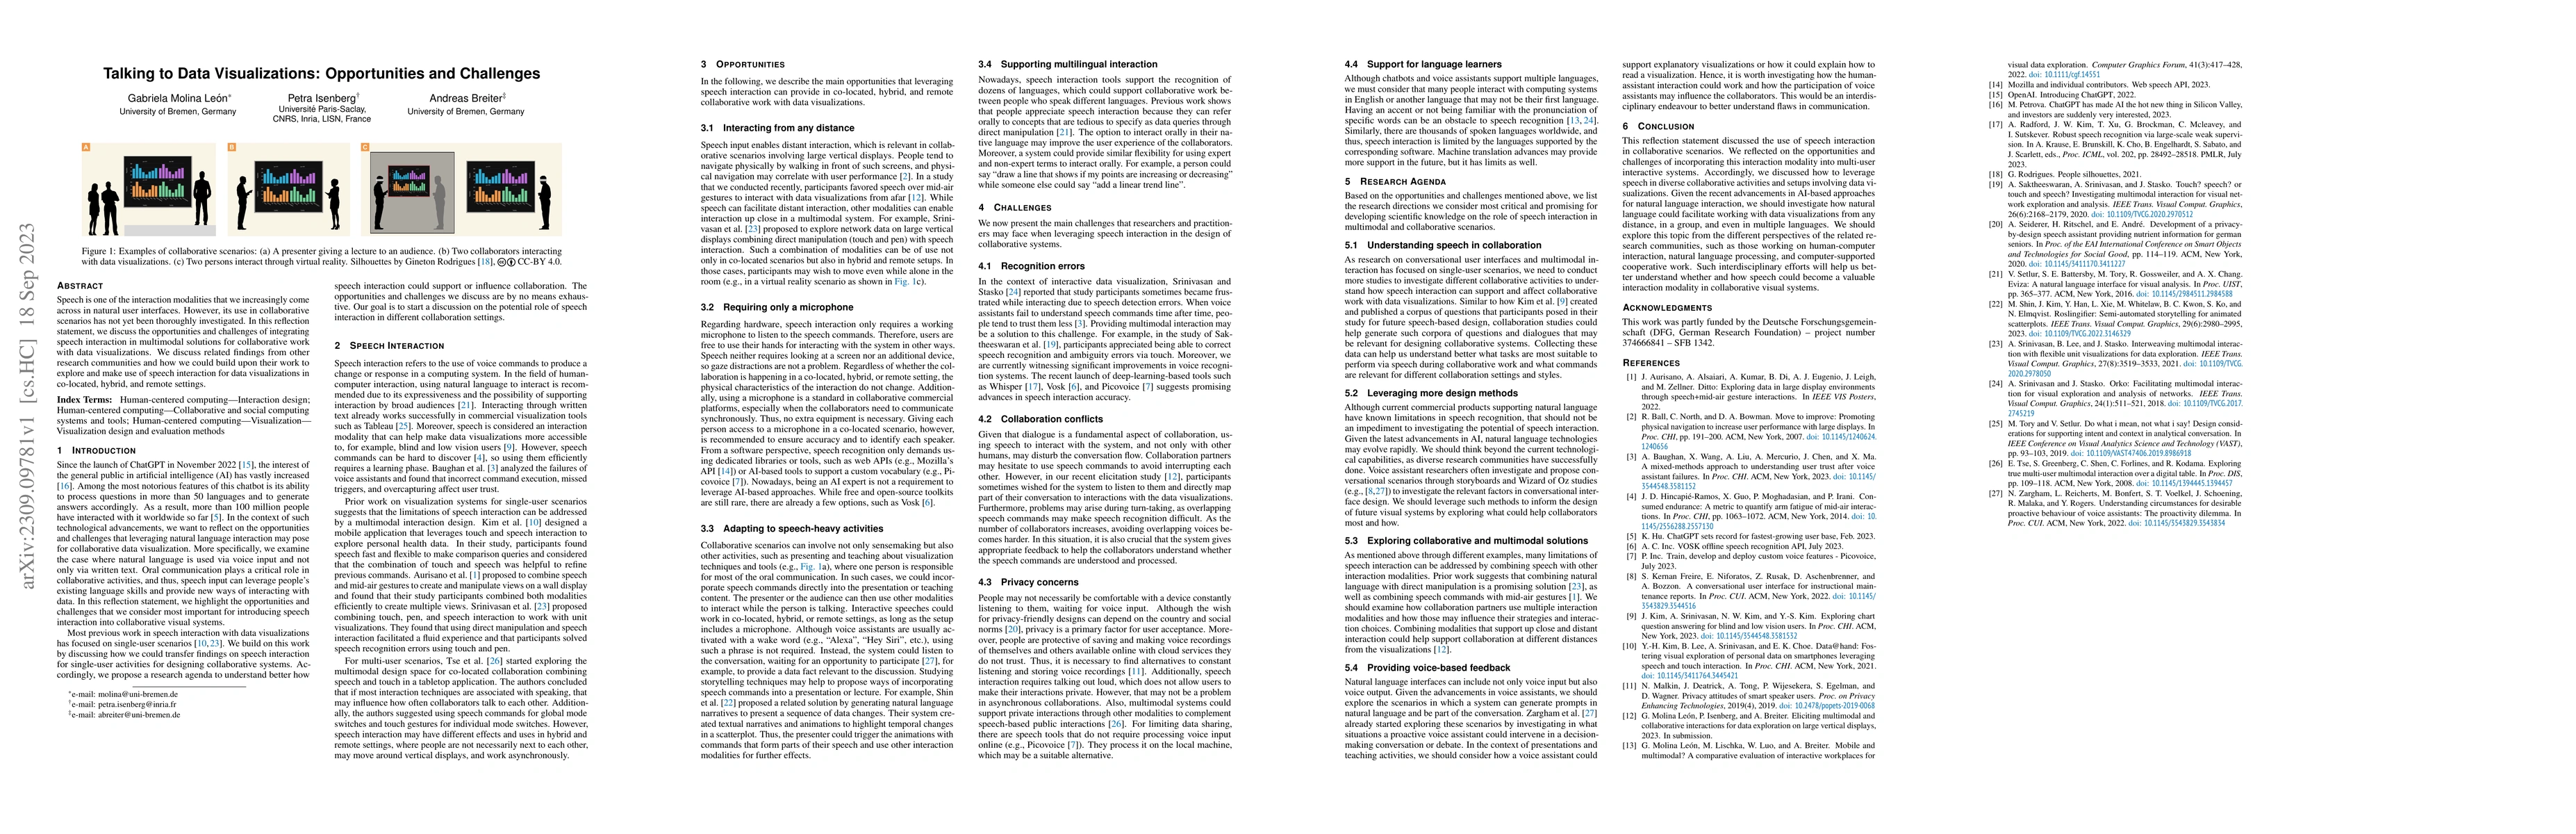
Speech is one of the interaction modalities that we increasingly come across in natural user interfaces. However, its use in collaborative scenarios has not yet been thoroughly investigated. In this...
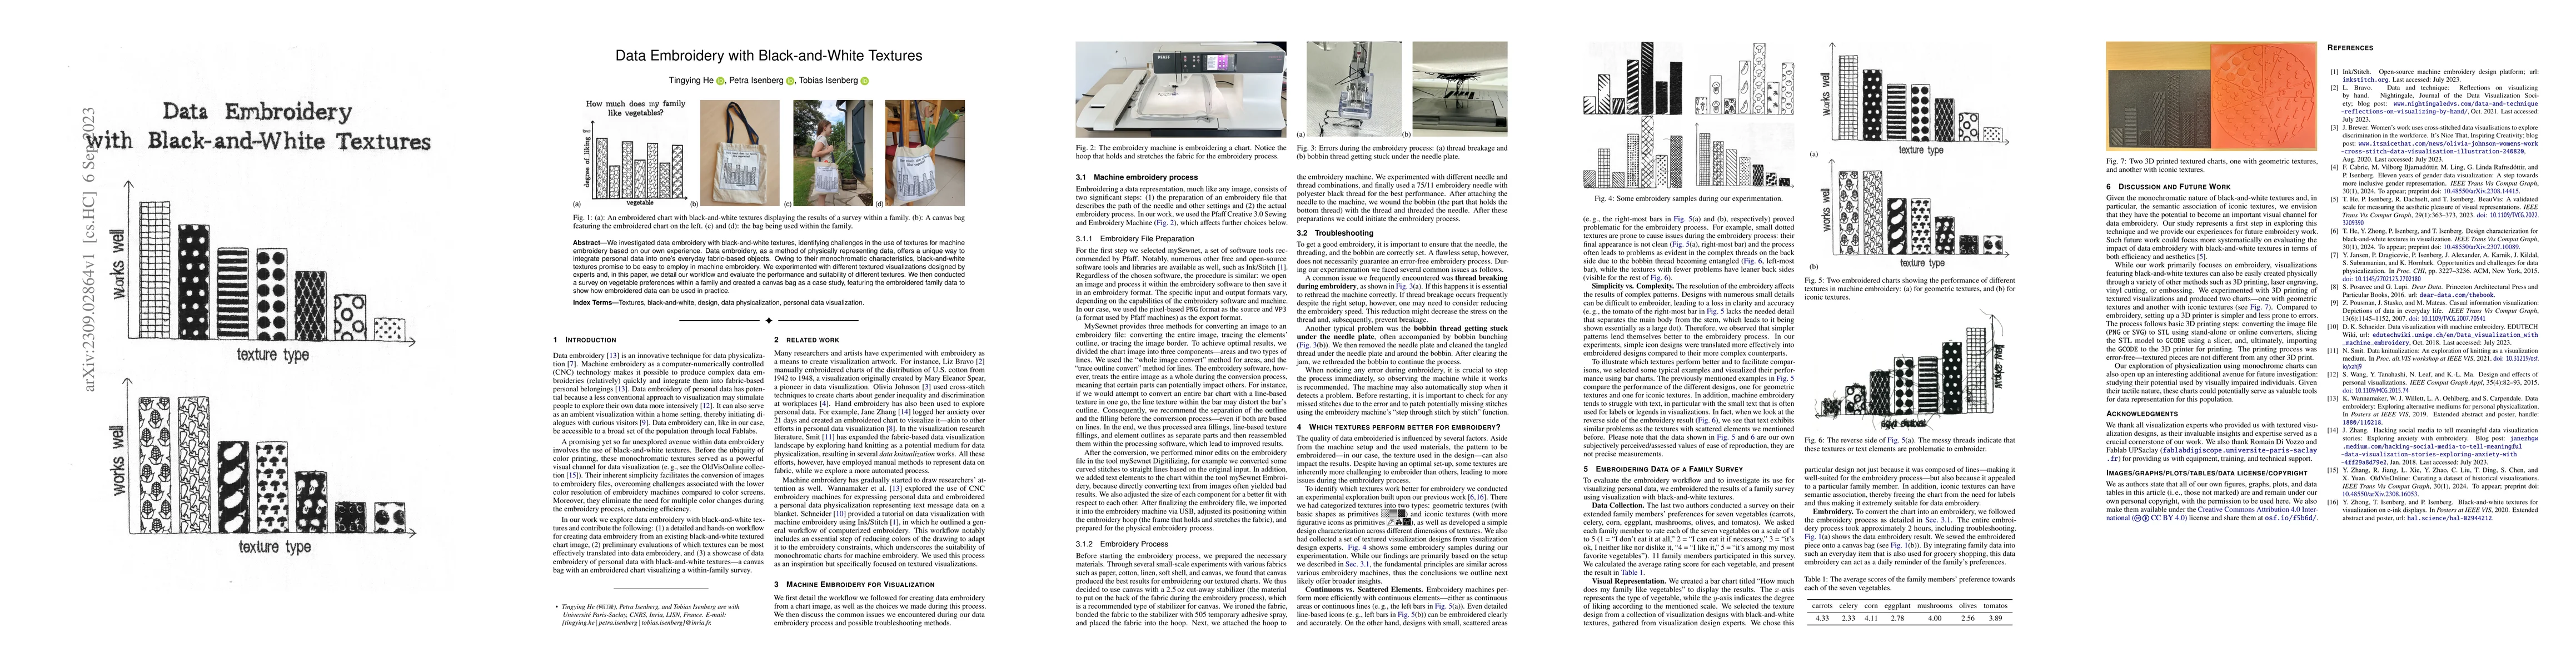
We investigated data embroidery with black-and-white textures, identifying challenges in the use of textures for machine embroidery based on our own experience. Data embroidery, as a method of physi...
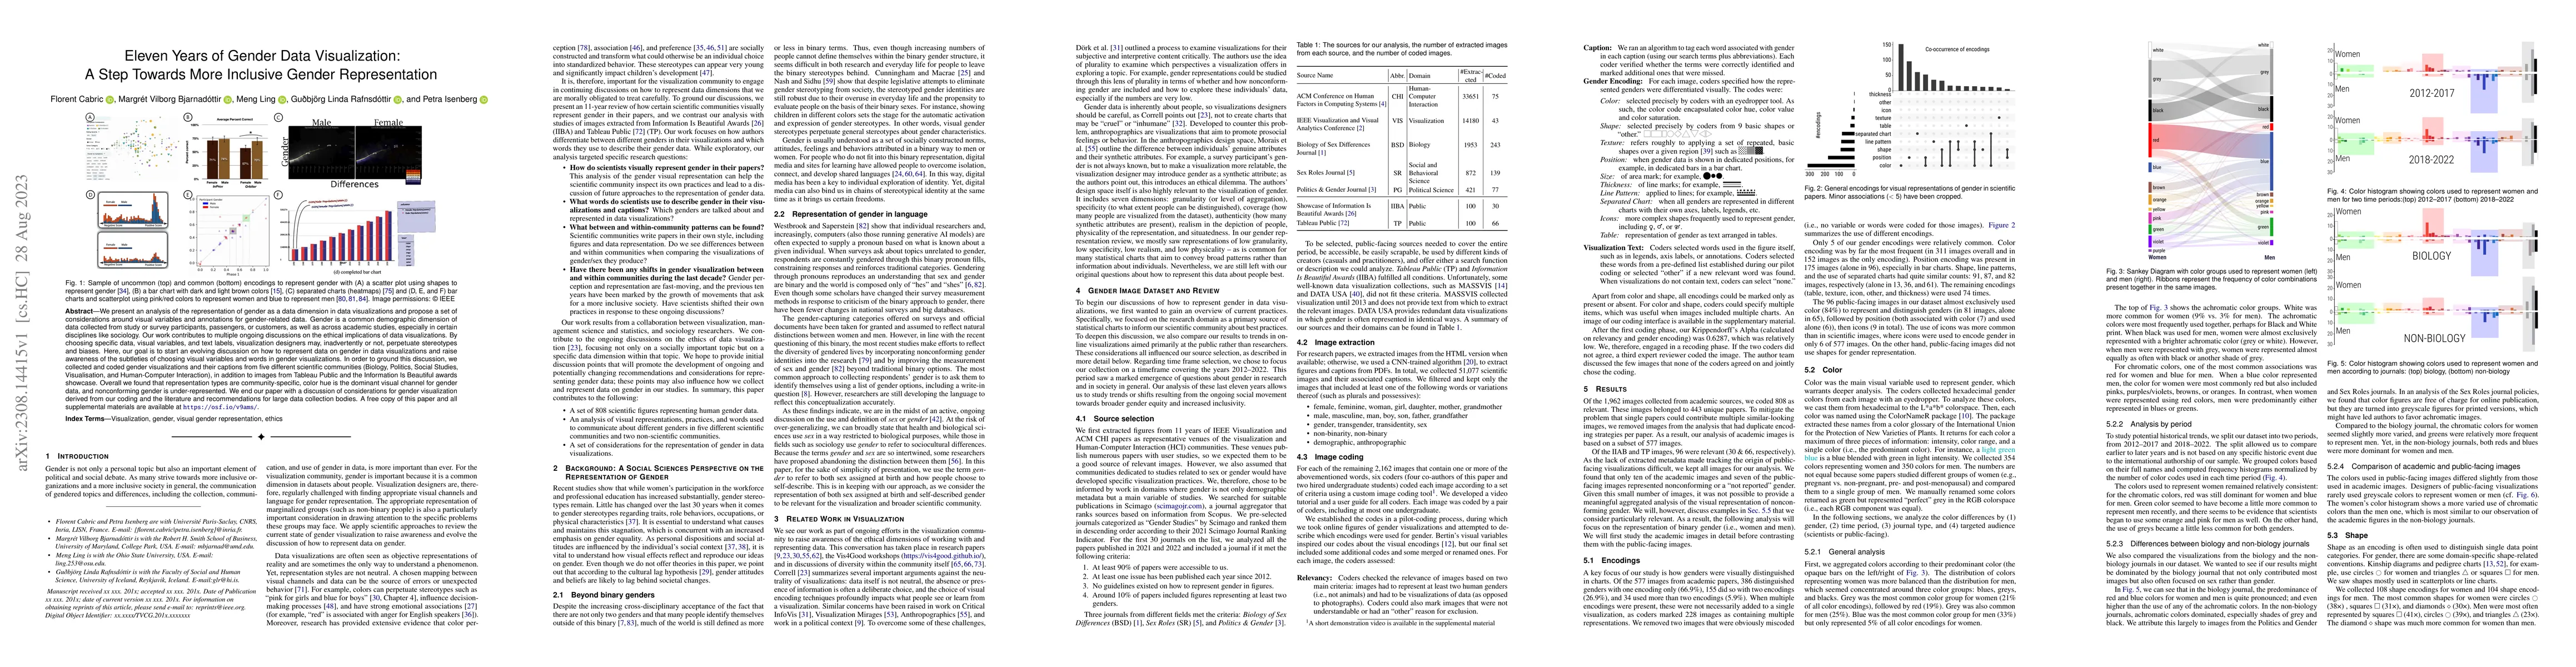
We present an analysis of the representation of gender as a data dimension in data visualizations and propose a set of considerations around visual variables and annotations for gender-related data....
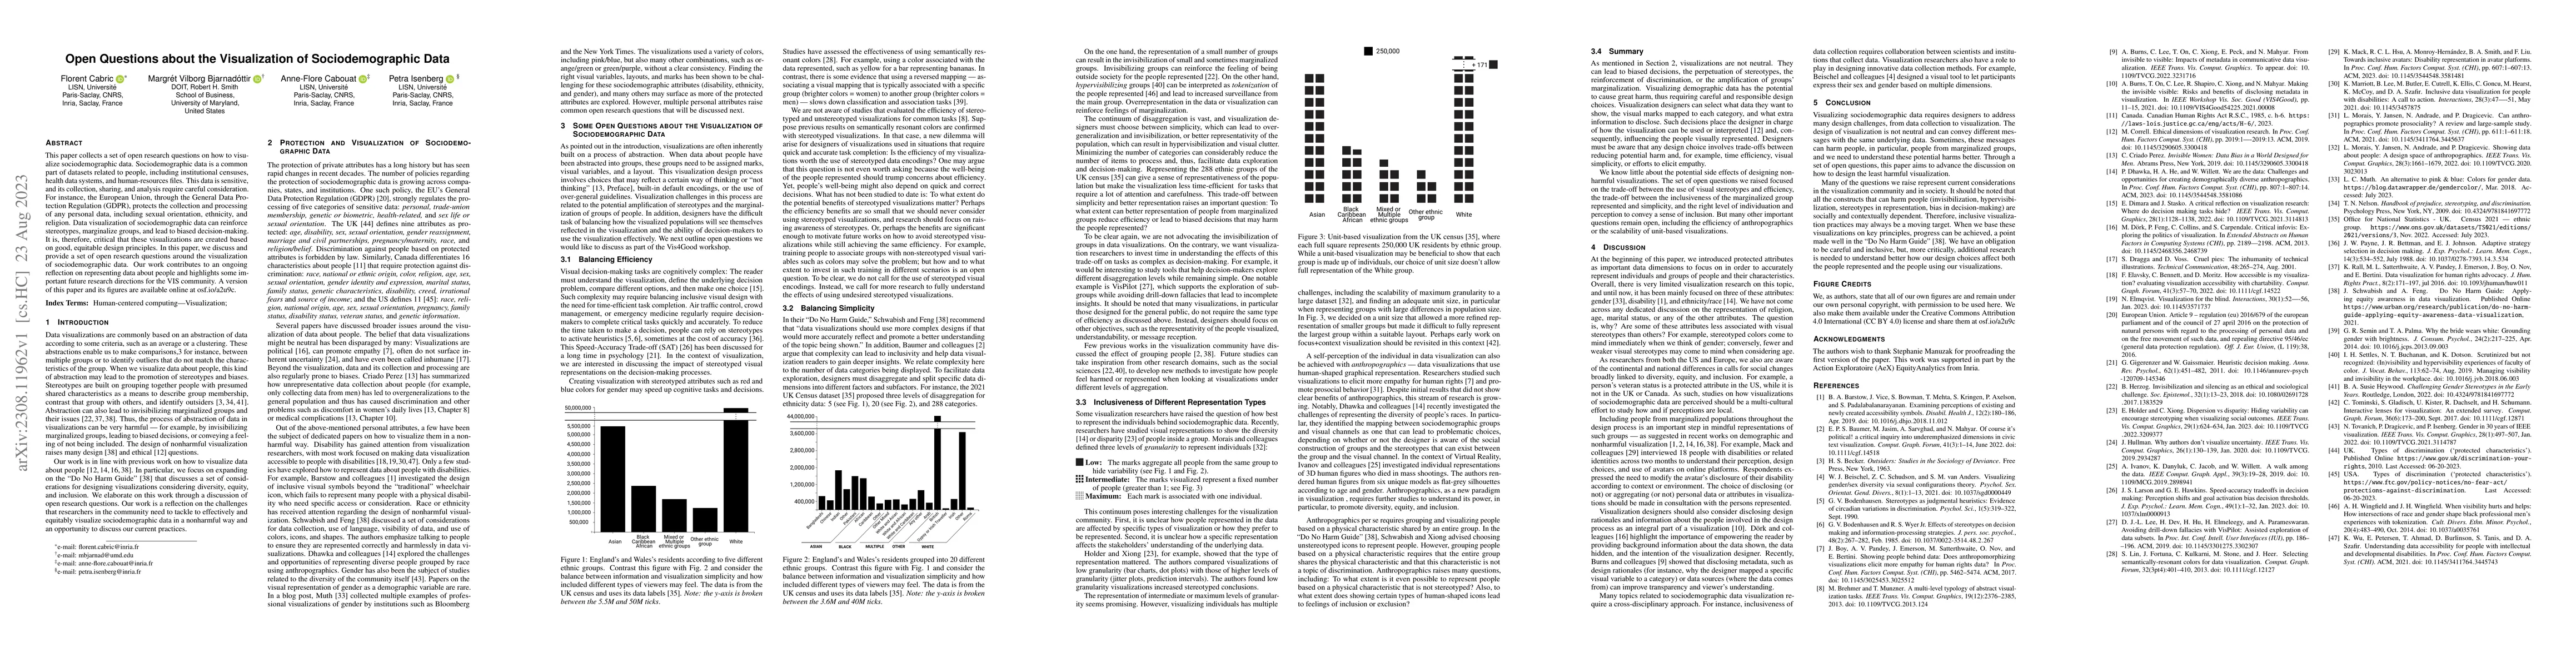
This paper collects a set of open research questions on how to visualize sociodemographic data. Sociodemographic data is a common part of datasets related to people, including institutional censuses...
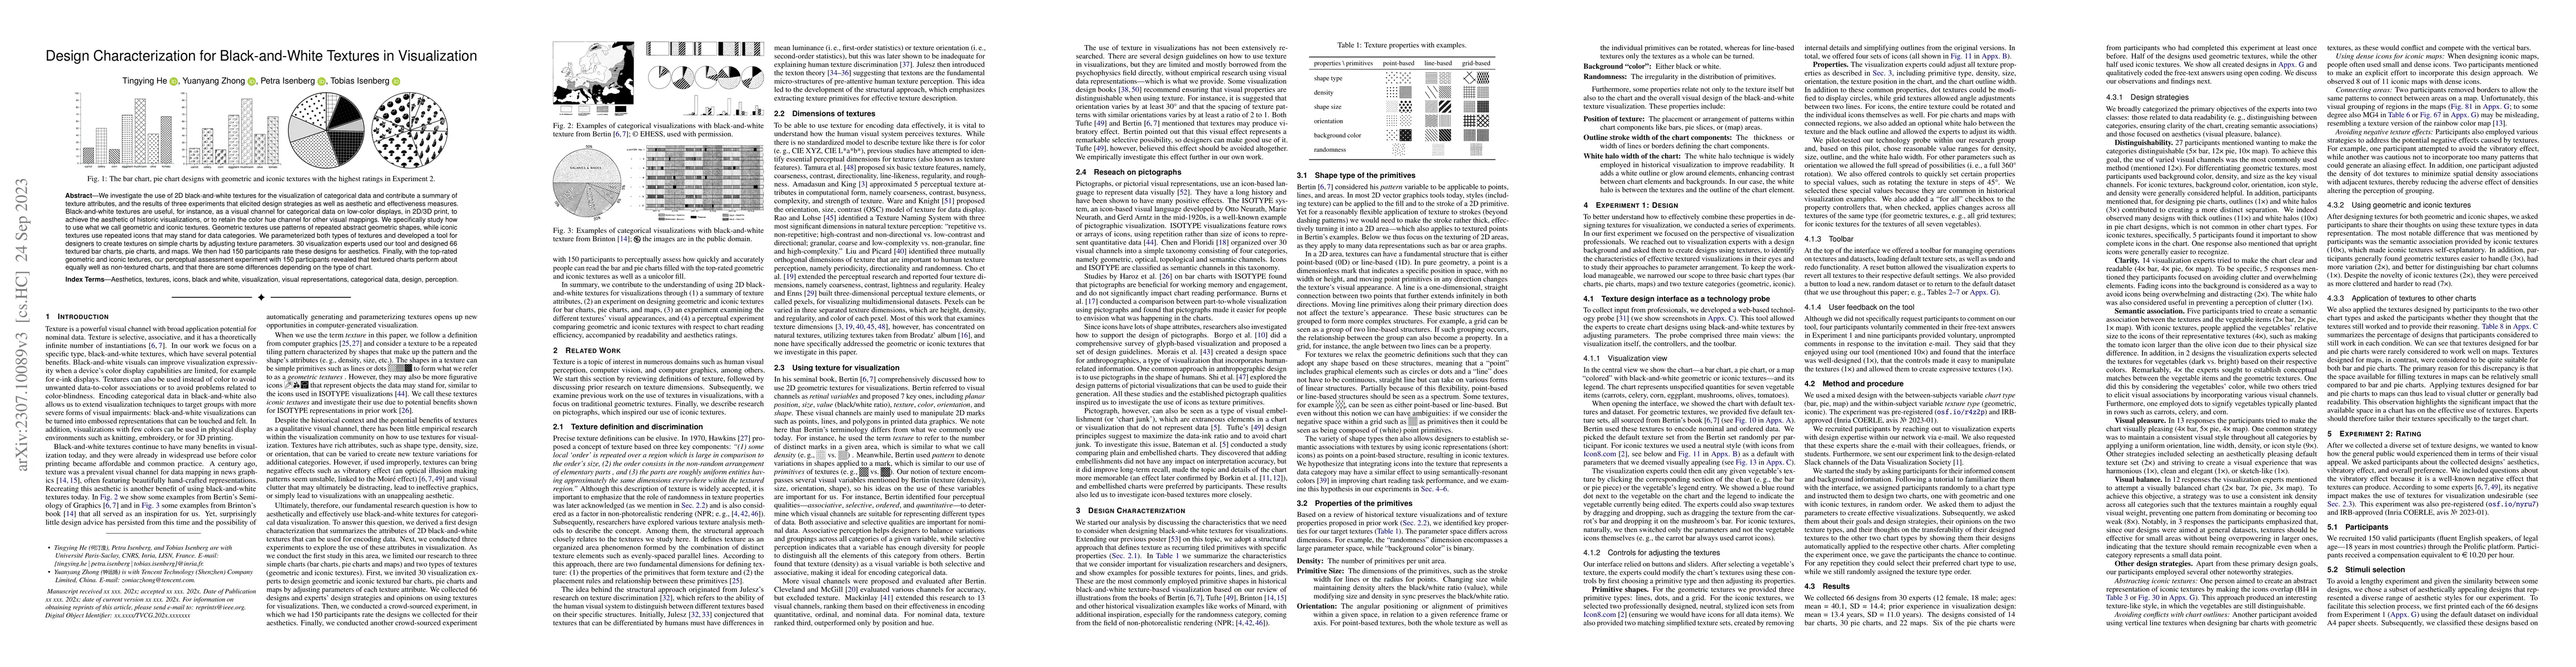
We investigate the use of 2D black-and-white textures for the visualization of categorical data and contribute a summary of texture attributes, and the results of three experiments that elicited des...
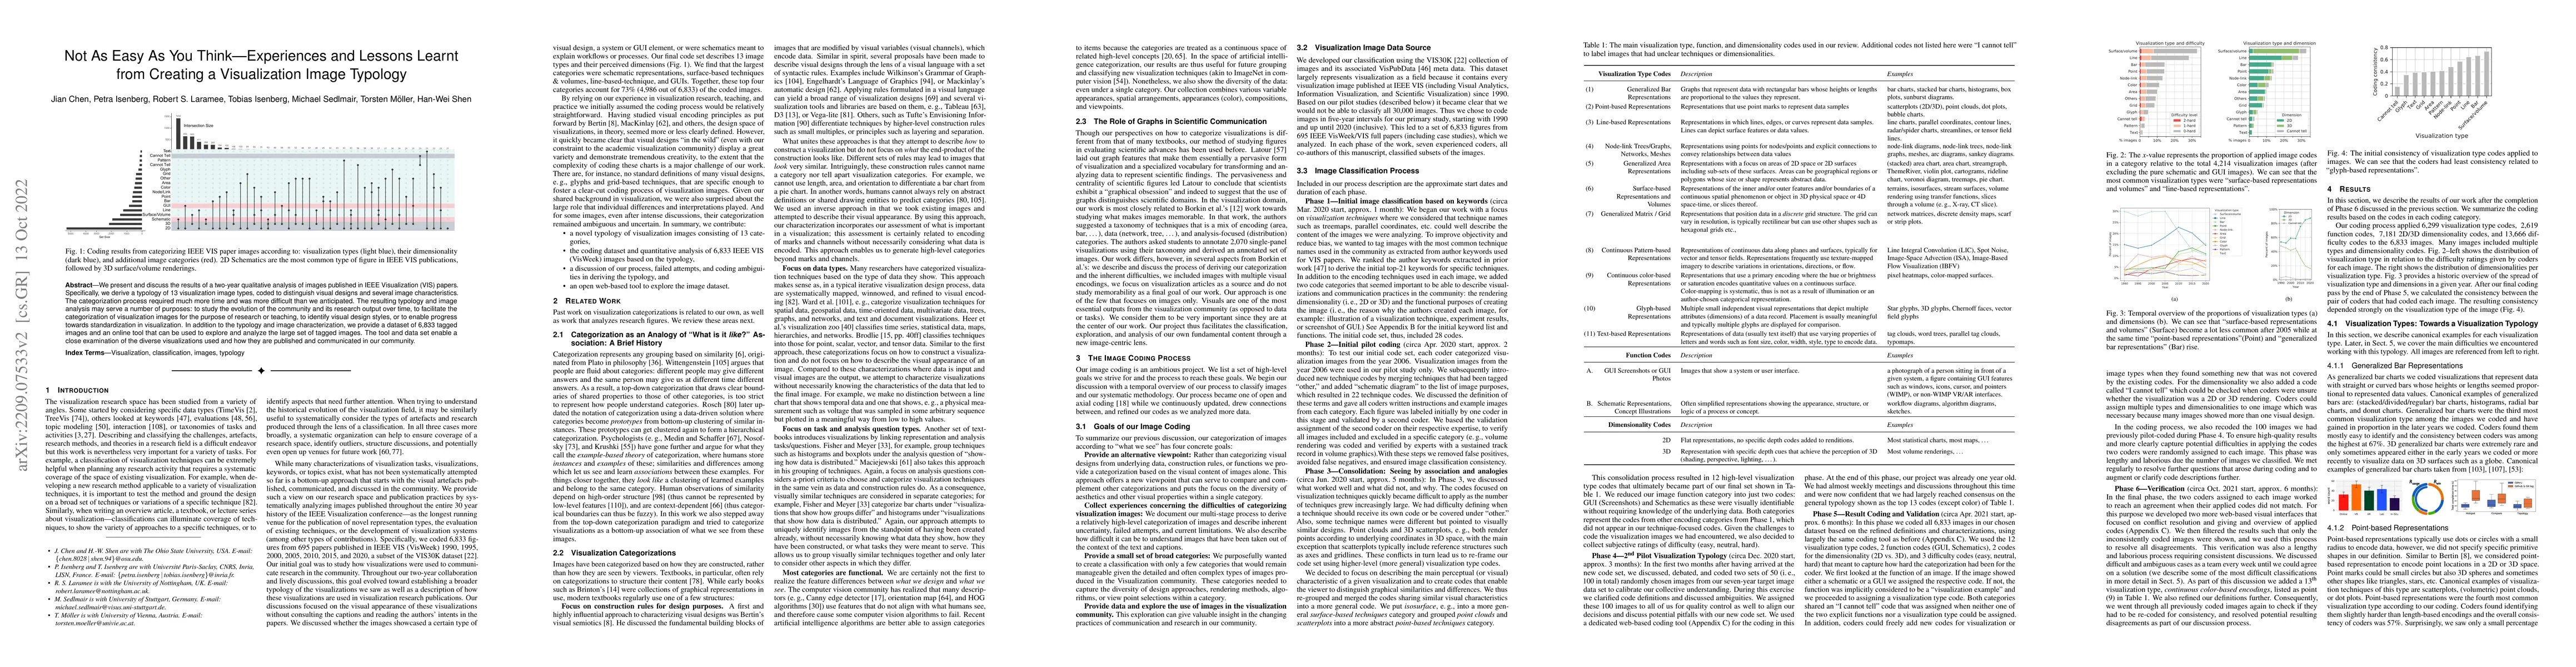
We present and discuss the results of a two-year qualitative analysis of images published in IEEE Visualization (VIS) papers. Specifically, we derive a typology of 13 visualization image types, code...
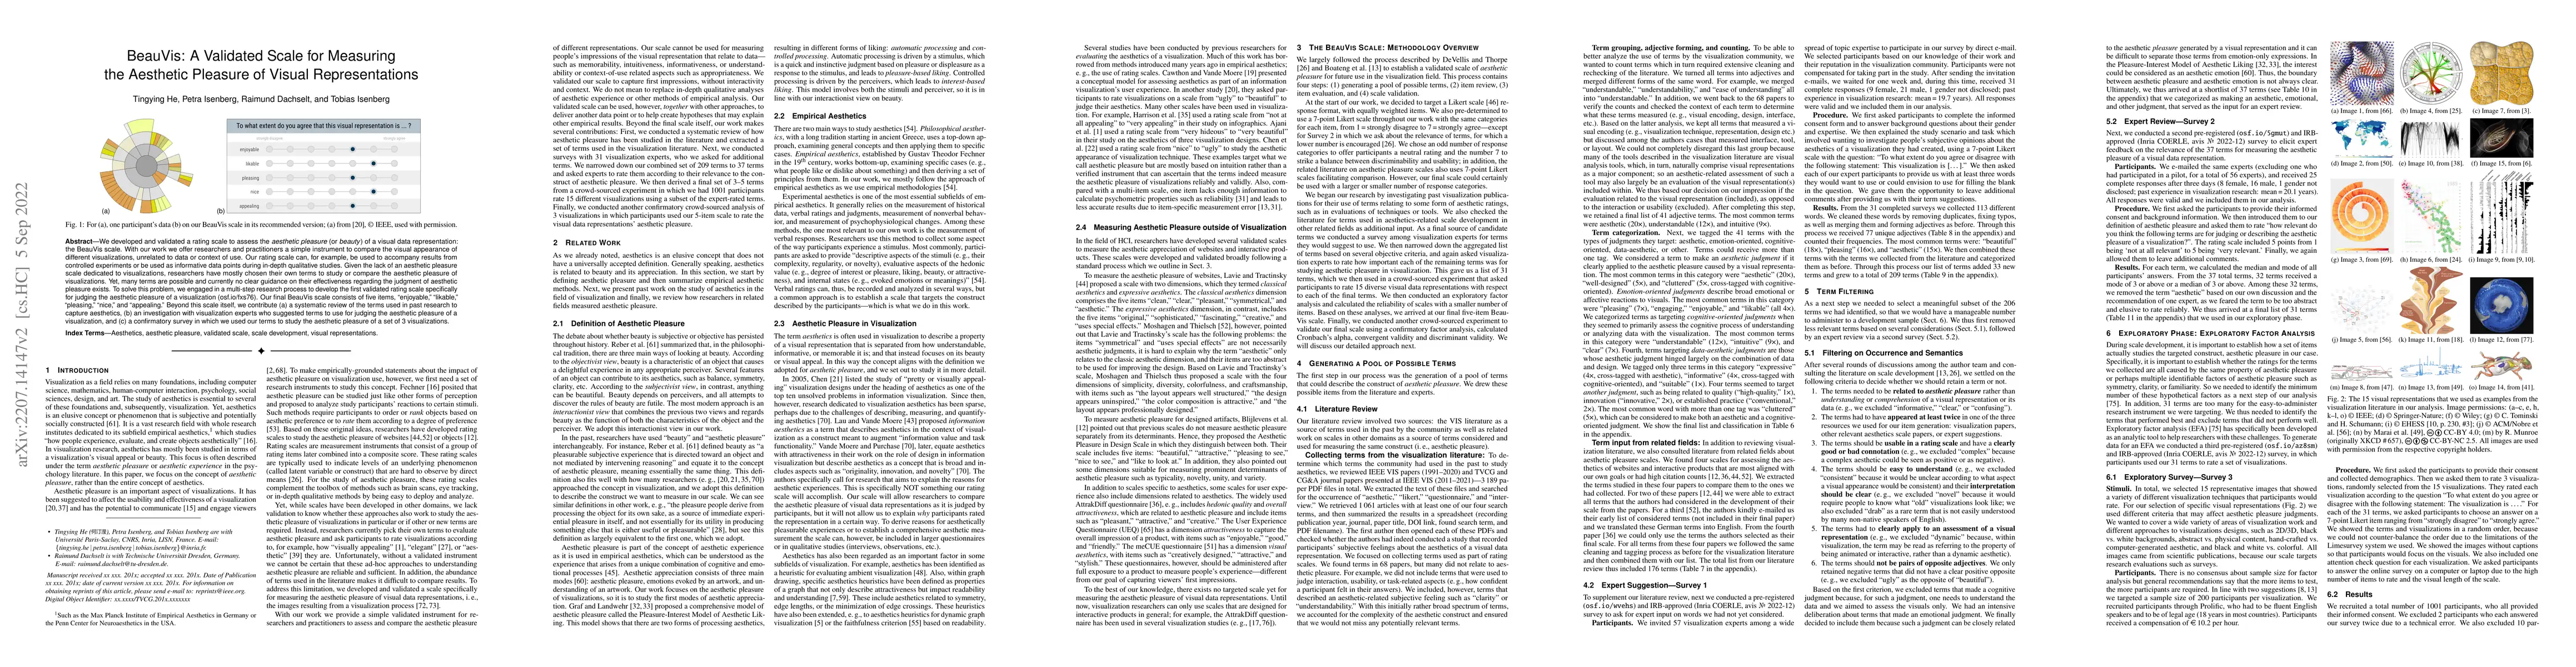
We developed and validated a rating scale to assess the aesthetic pleasure (or beauty) of a visual data representation: the BeauVis scale. With our work we offer researchers and practitioners a simp...
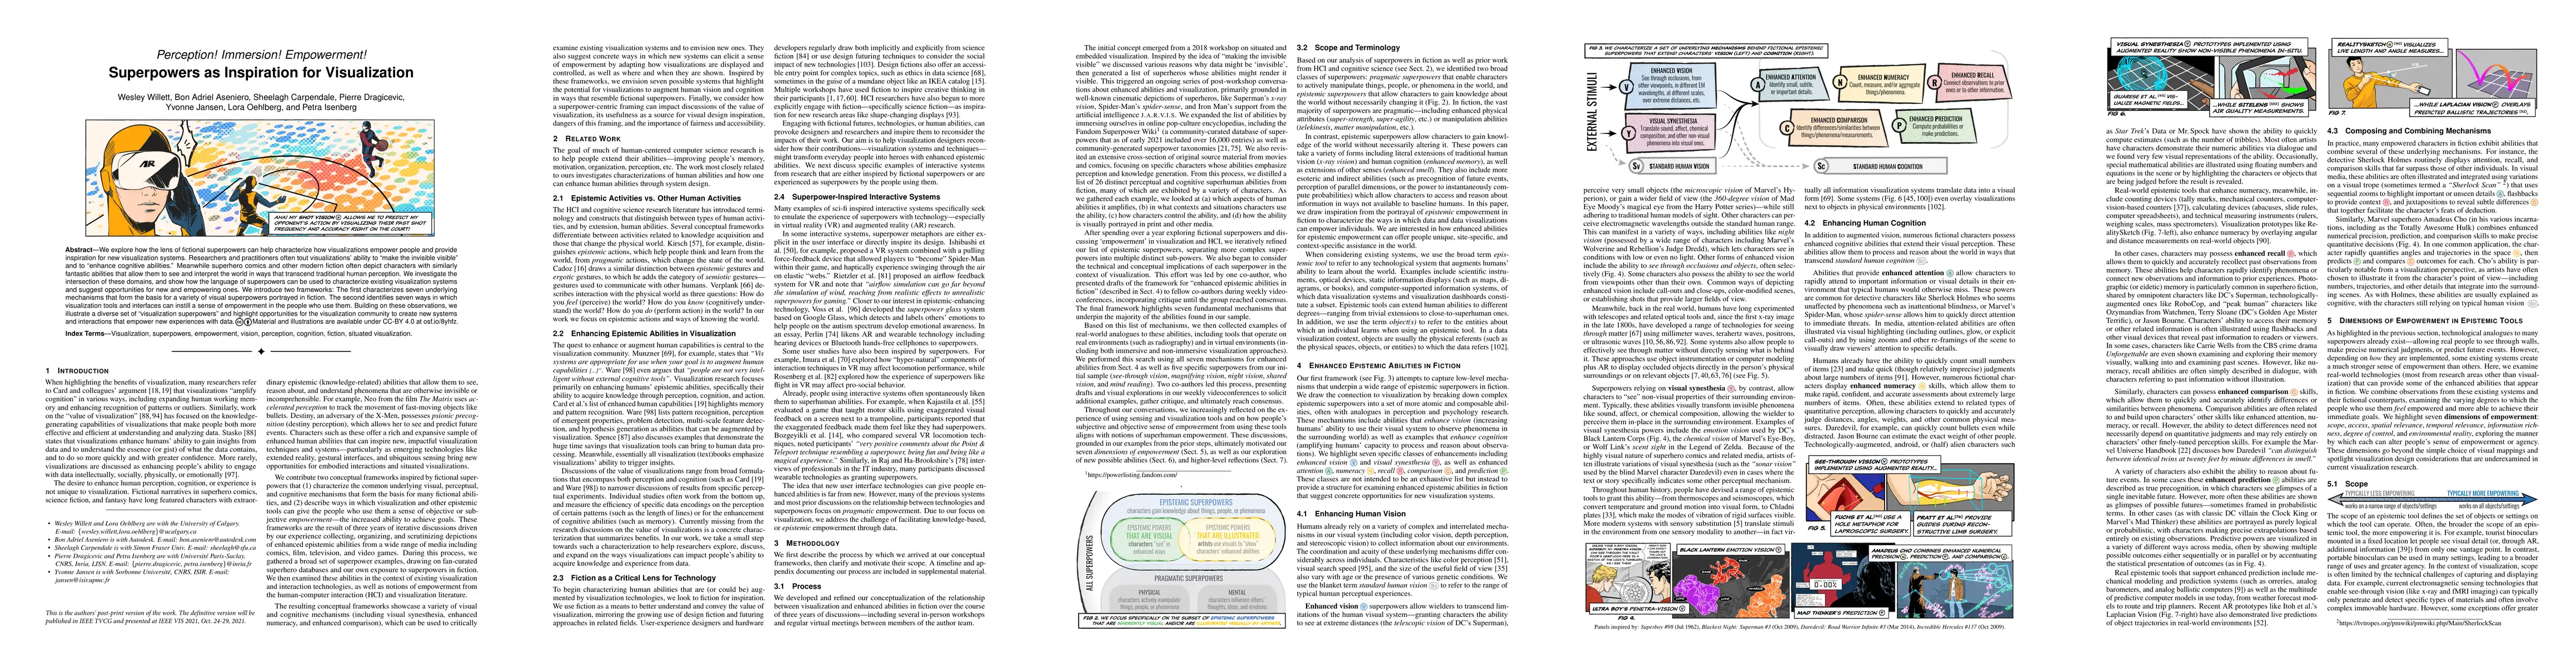
We explore how the lens of fictional superpowers can help characterize how visualizations empower people and provide inspiration for new visualization systems. Researchers and practitioners often to...
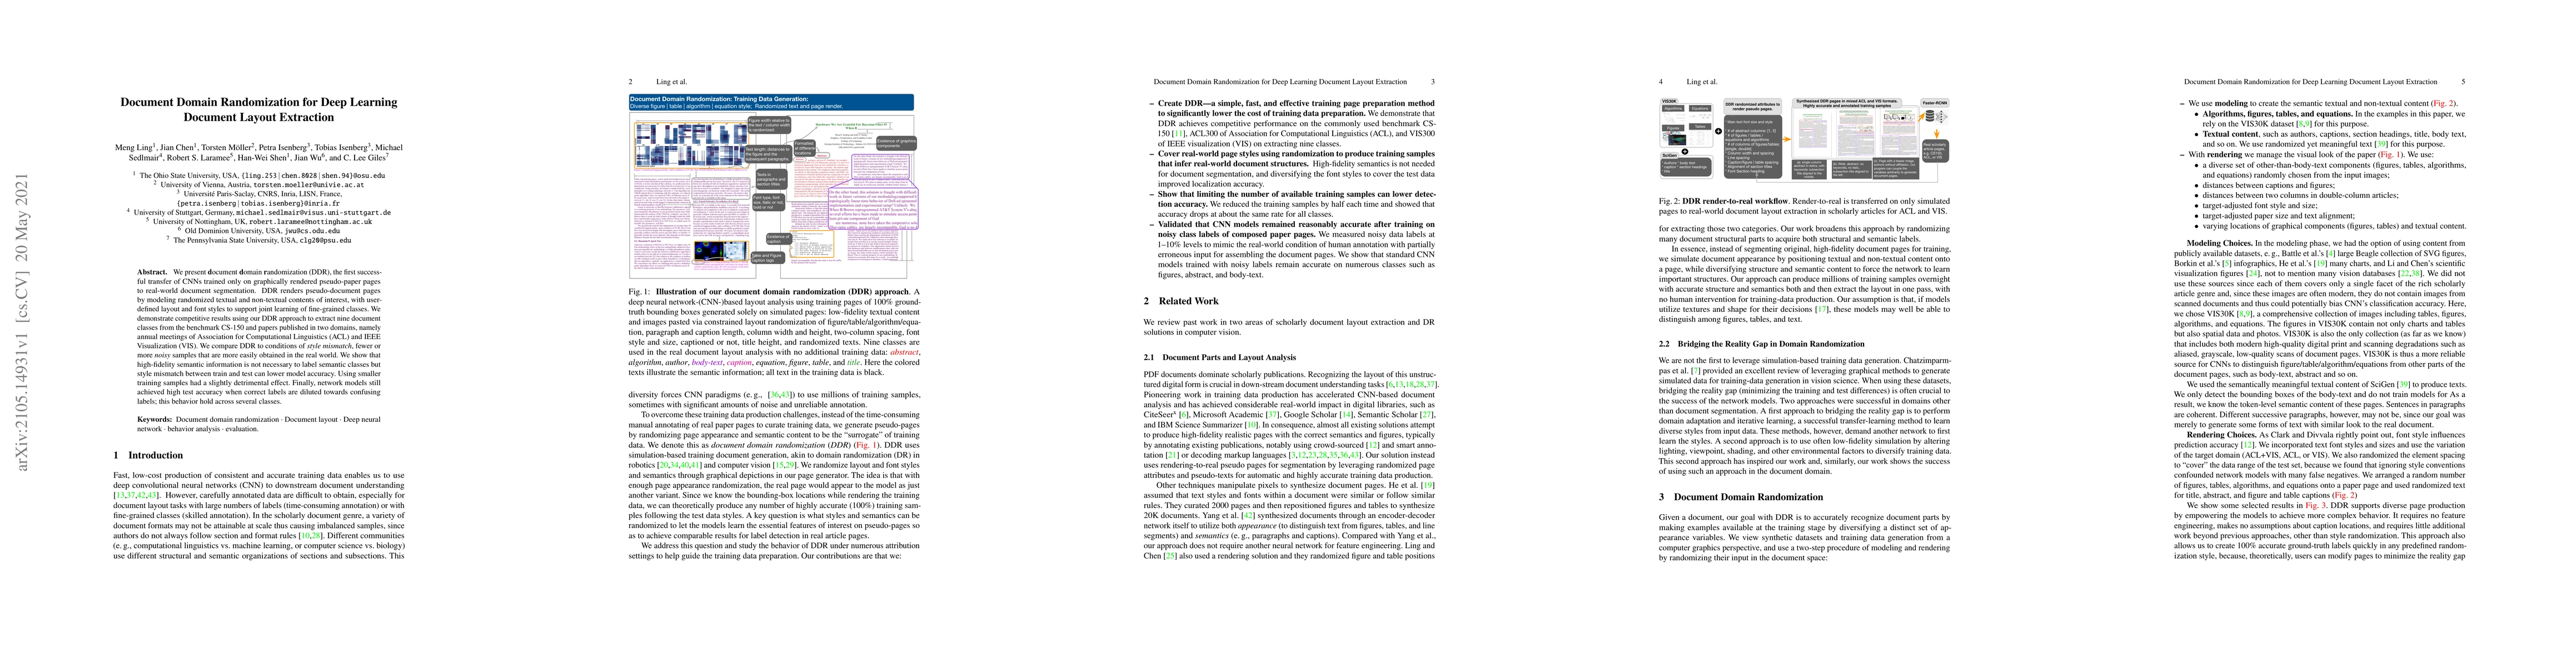
We present document domain randomization (DDR), the first successful transfer of convolutional neural networks (CNNs) trained only on graphically rendered pseudo-paper pages to real-world document s...
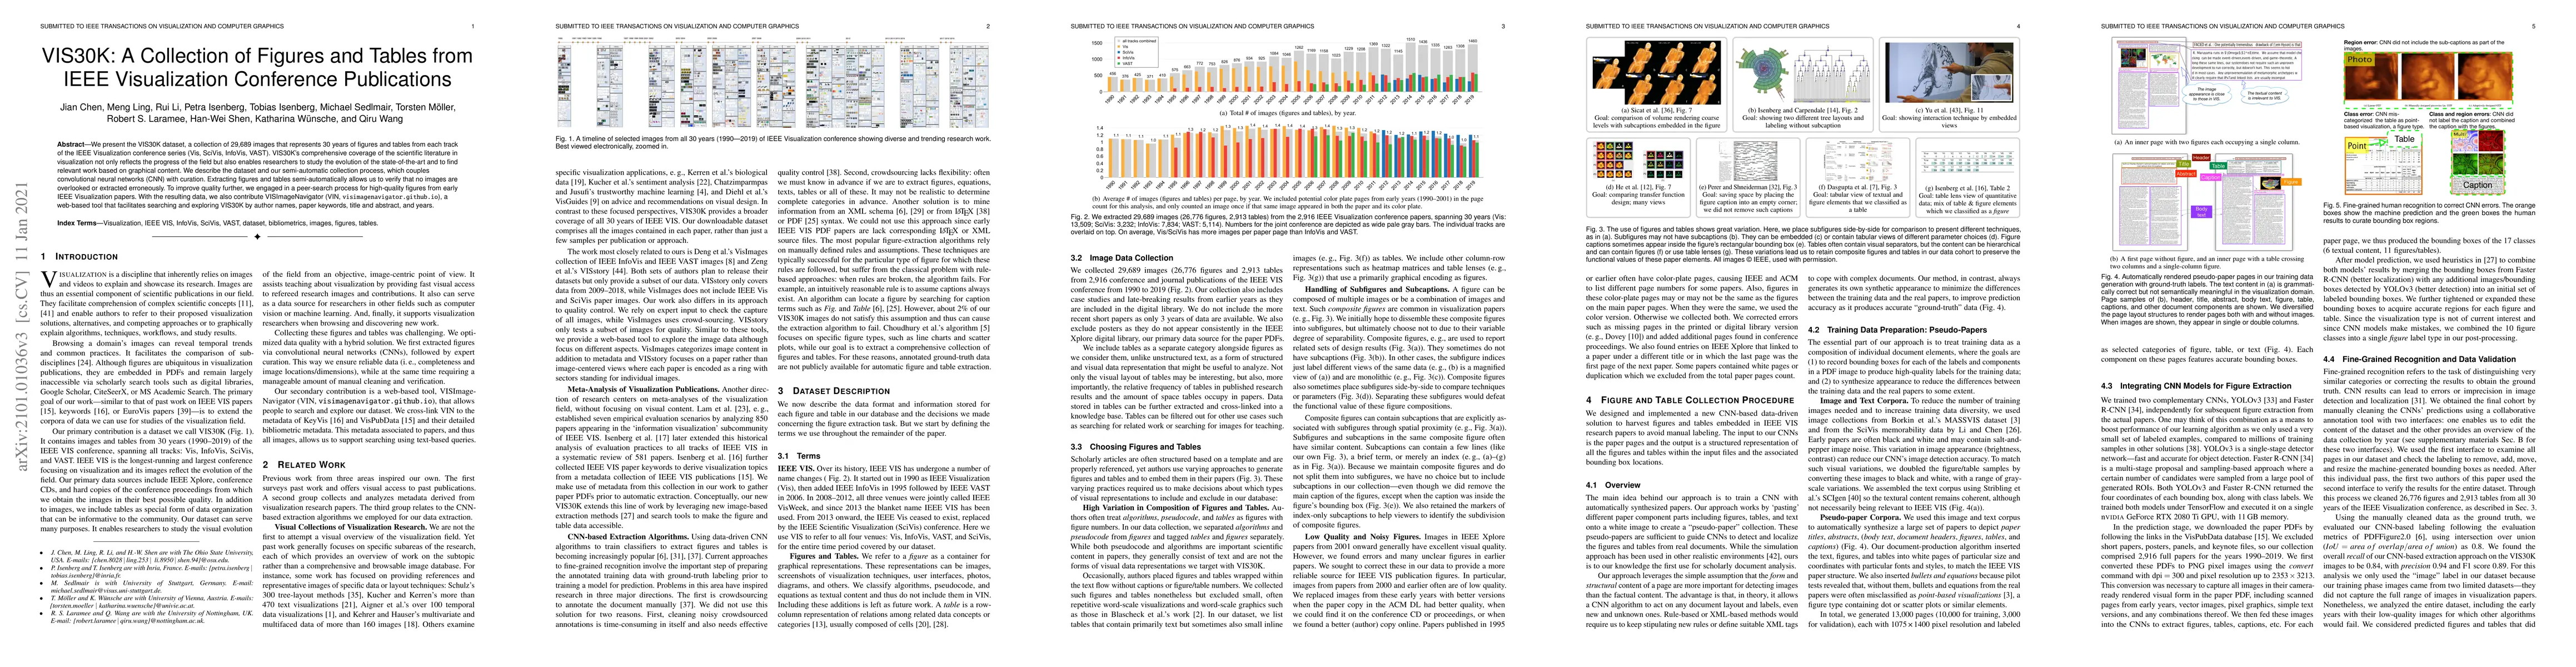
We present the VIS30K dataset, a collection of 29,689 images that represents 30 years of figures and tables from each track of the IEEE Visualization conference series (Vis, SciVis, InfoVis, VAST). ...
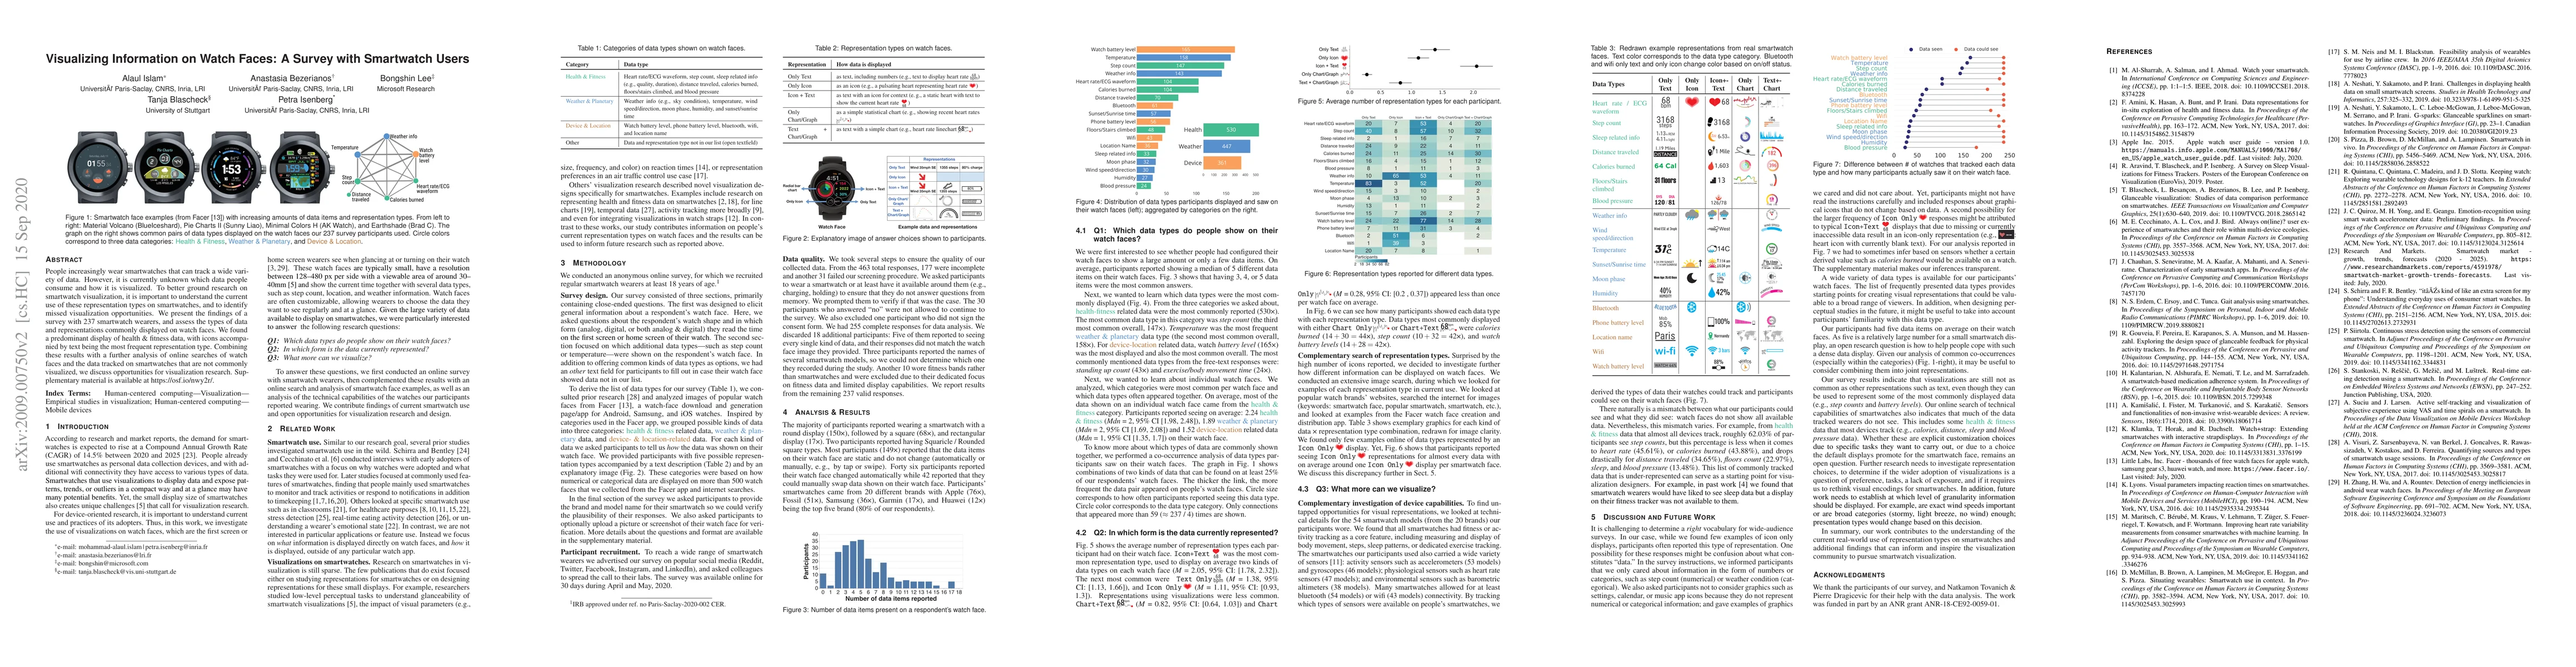
People increasingly wear smartwatches that can track a wide variety of data. However, it is currently unknown which data people consume and how it is visualized. To better ground research on smartwa...
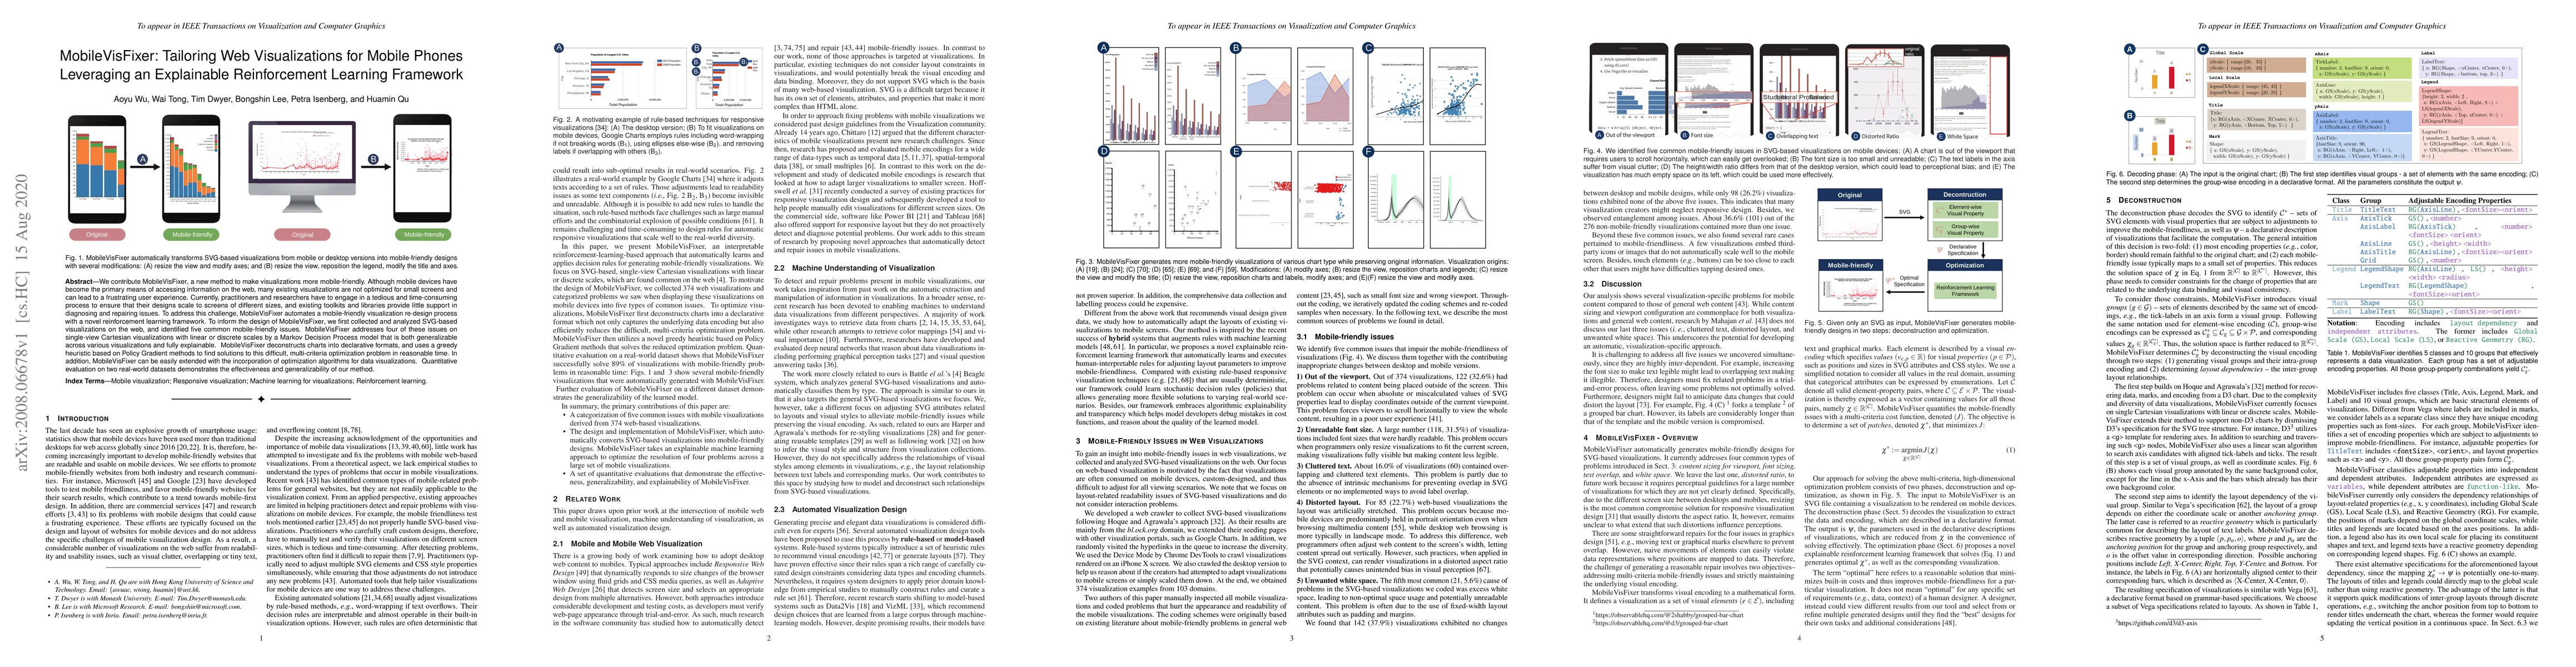
We contribute MobileVisFixer, a new method to make visualizations more mobile-friendly. Although mobile devices have become the primary means of accessing information on the web, many existing visua...
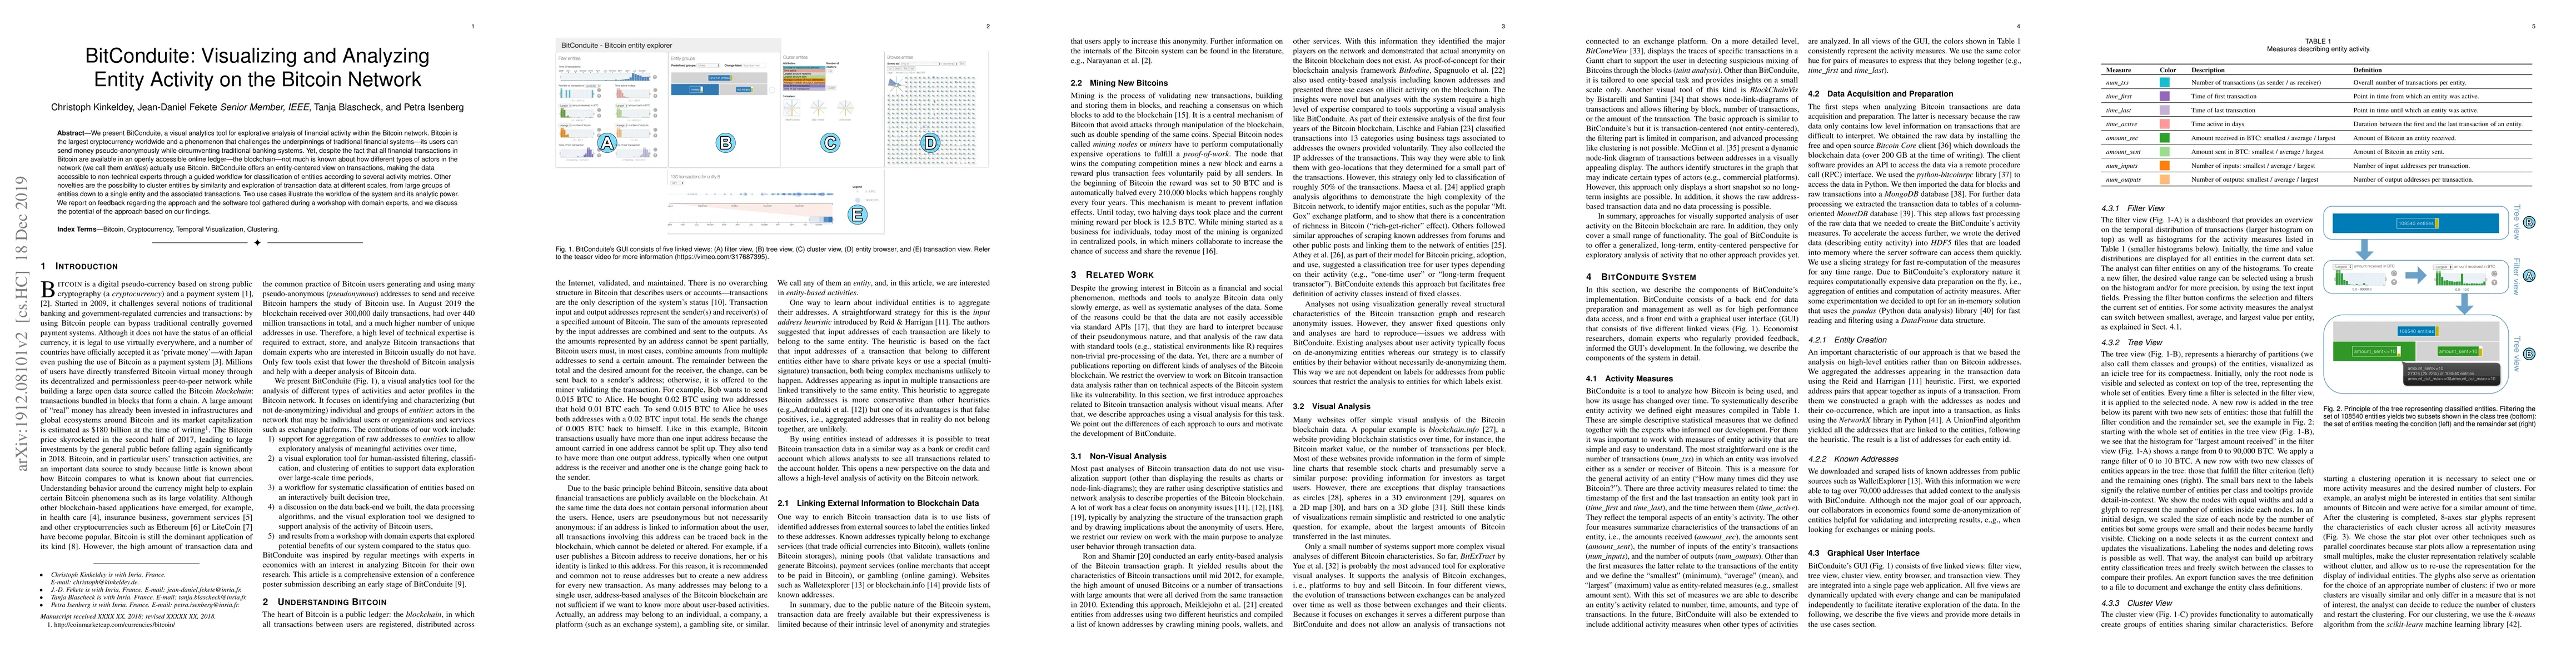
We present BitConduite, a visual analytics tool for explorative analysis of financial activity within the Bitcoin network. Bitcoin is the largest cryptocurrency worldwide and a phenomenon that chall...
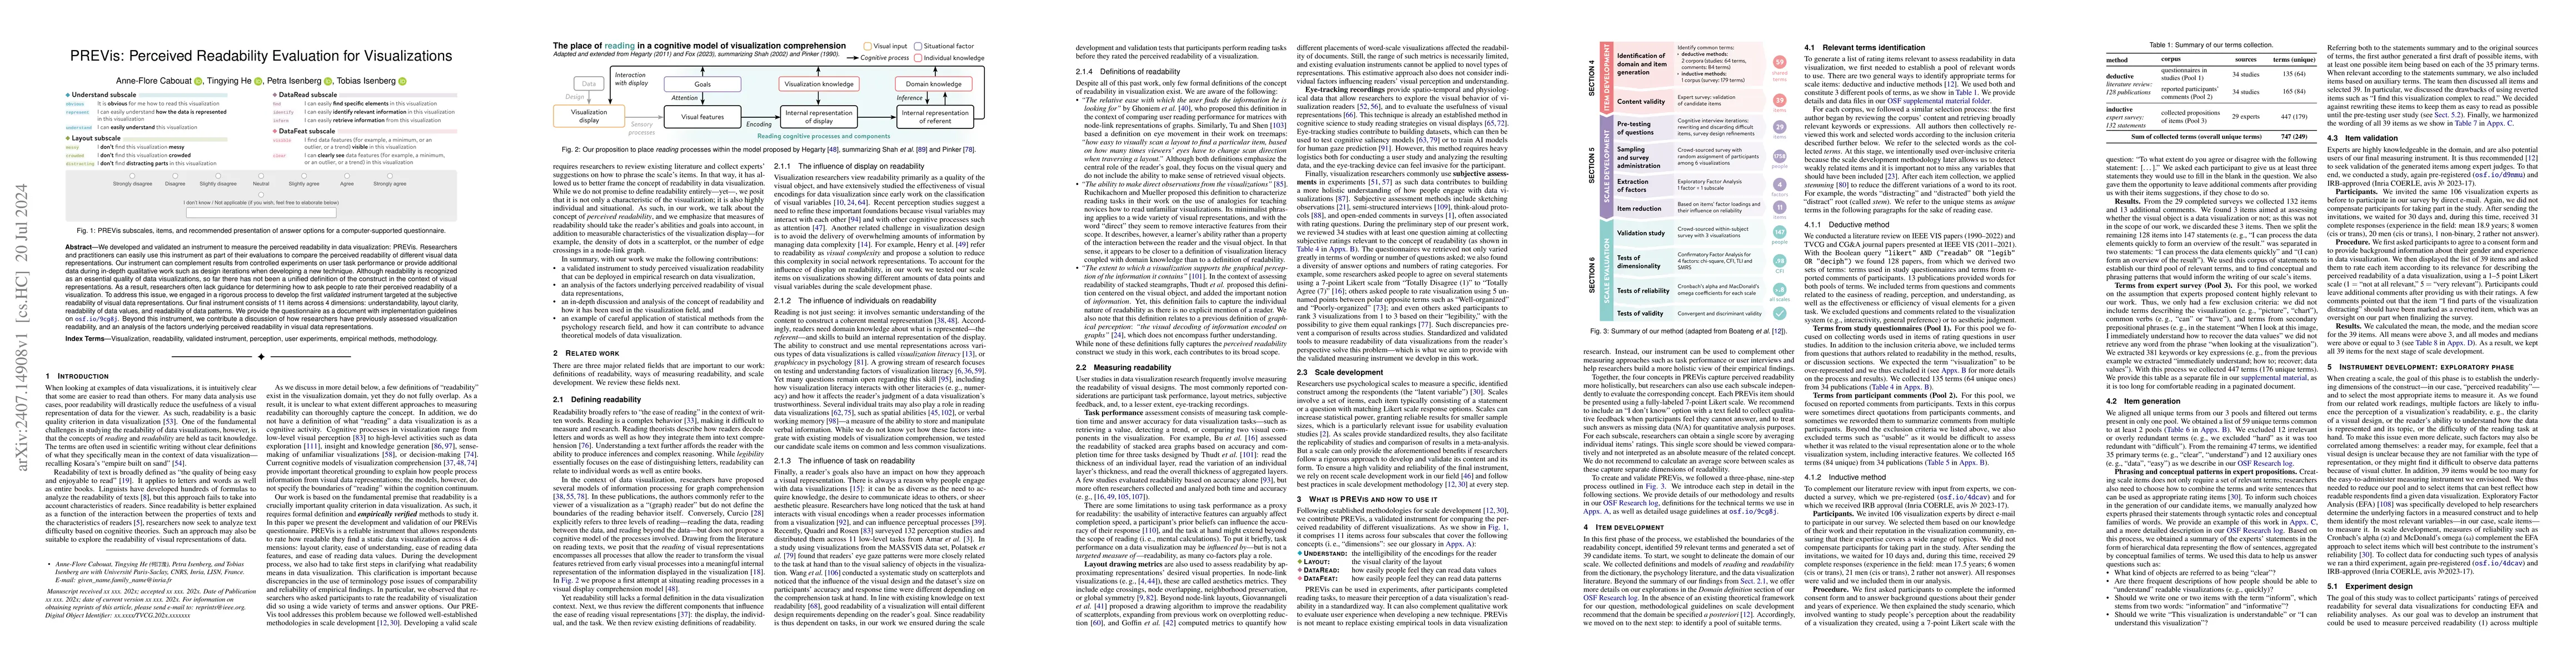
We developed and validated an instrument to measure the perceived readability in data visualization: PREVis. Researchers and practitioners can easily use this instrument as part of their evaluations t...
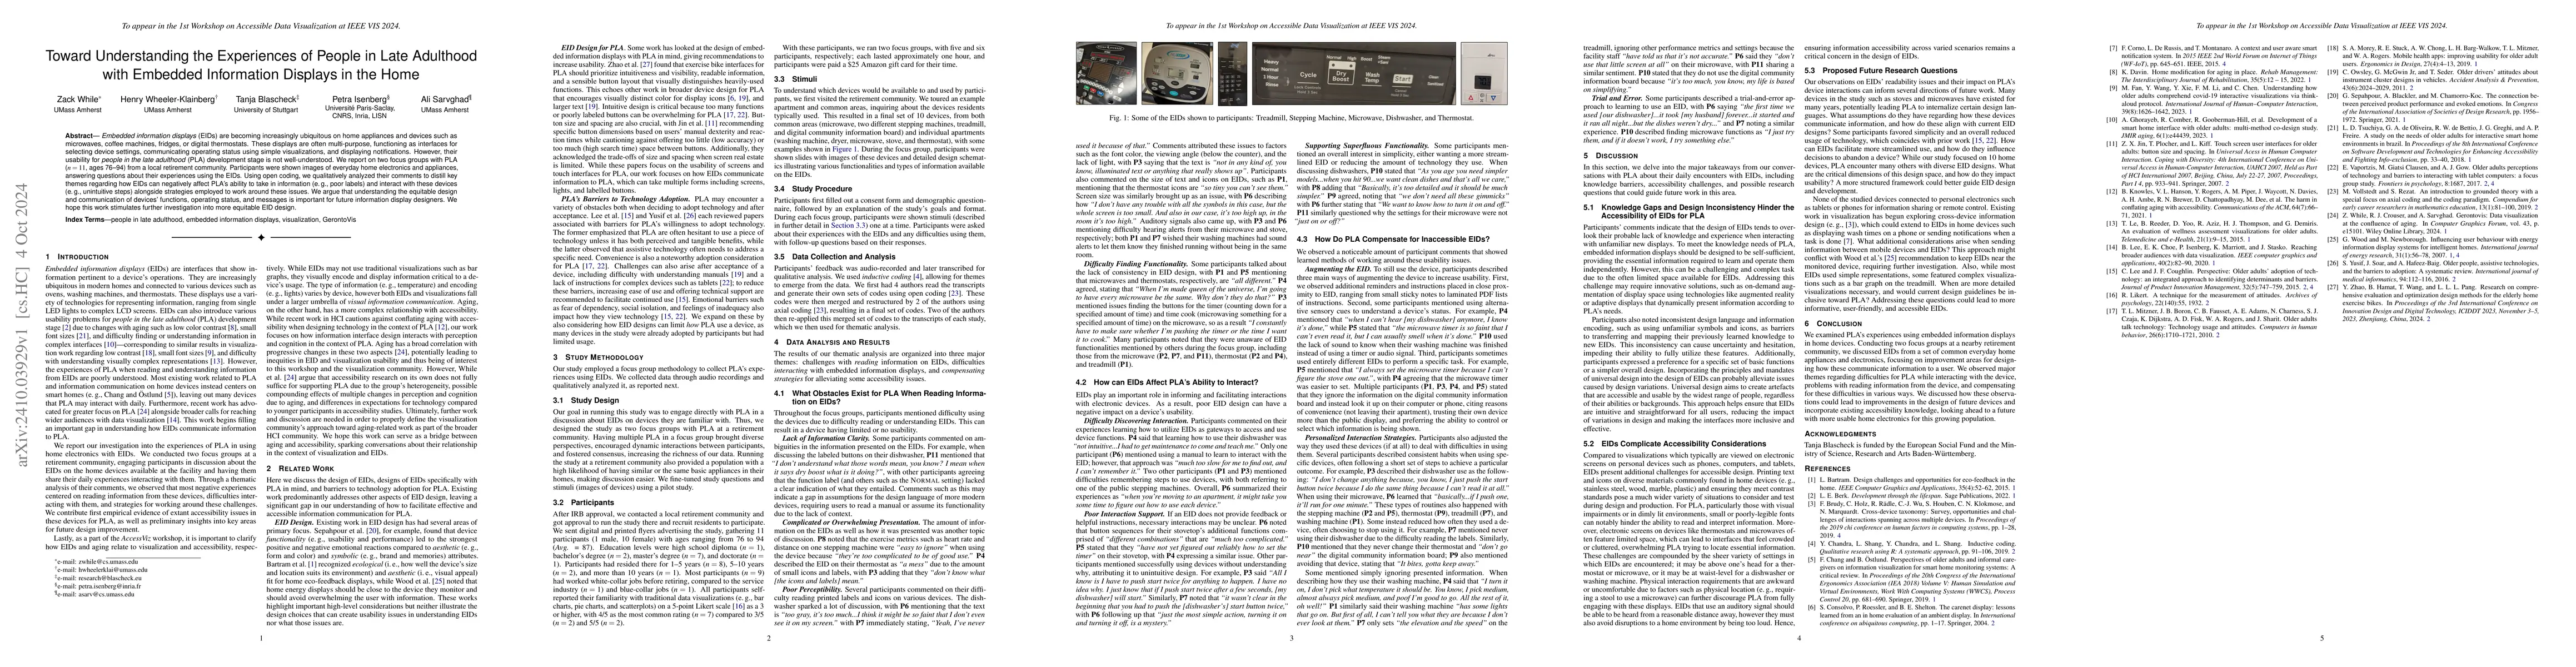
Embedded information displays (EIDs) are becoming increasingly ubiquitous on home appliances and devices such as microwaves, coffee machines, fridges, or digital thermostats. These displays are often ...
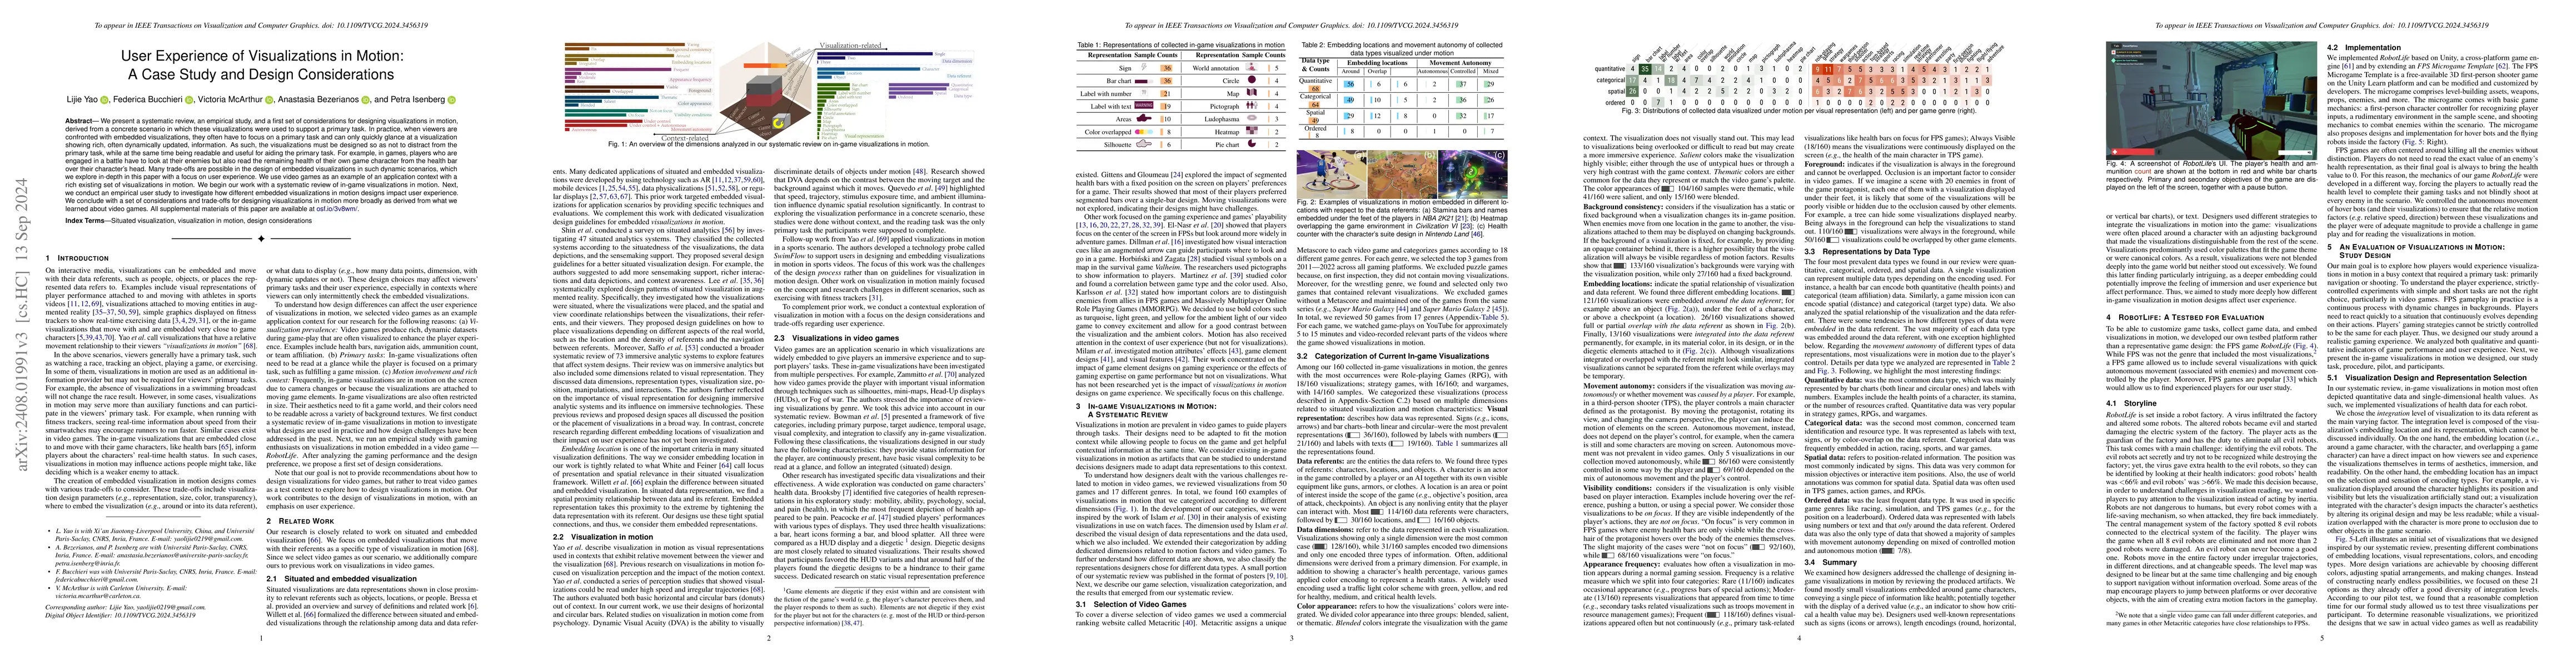
We present a systematic review, an empirical study, and a first set of considerations for designing visualizations in motion, derived from a concrete scenario in which these visualizations were used t...
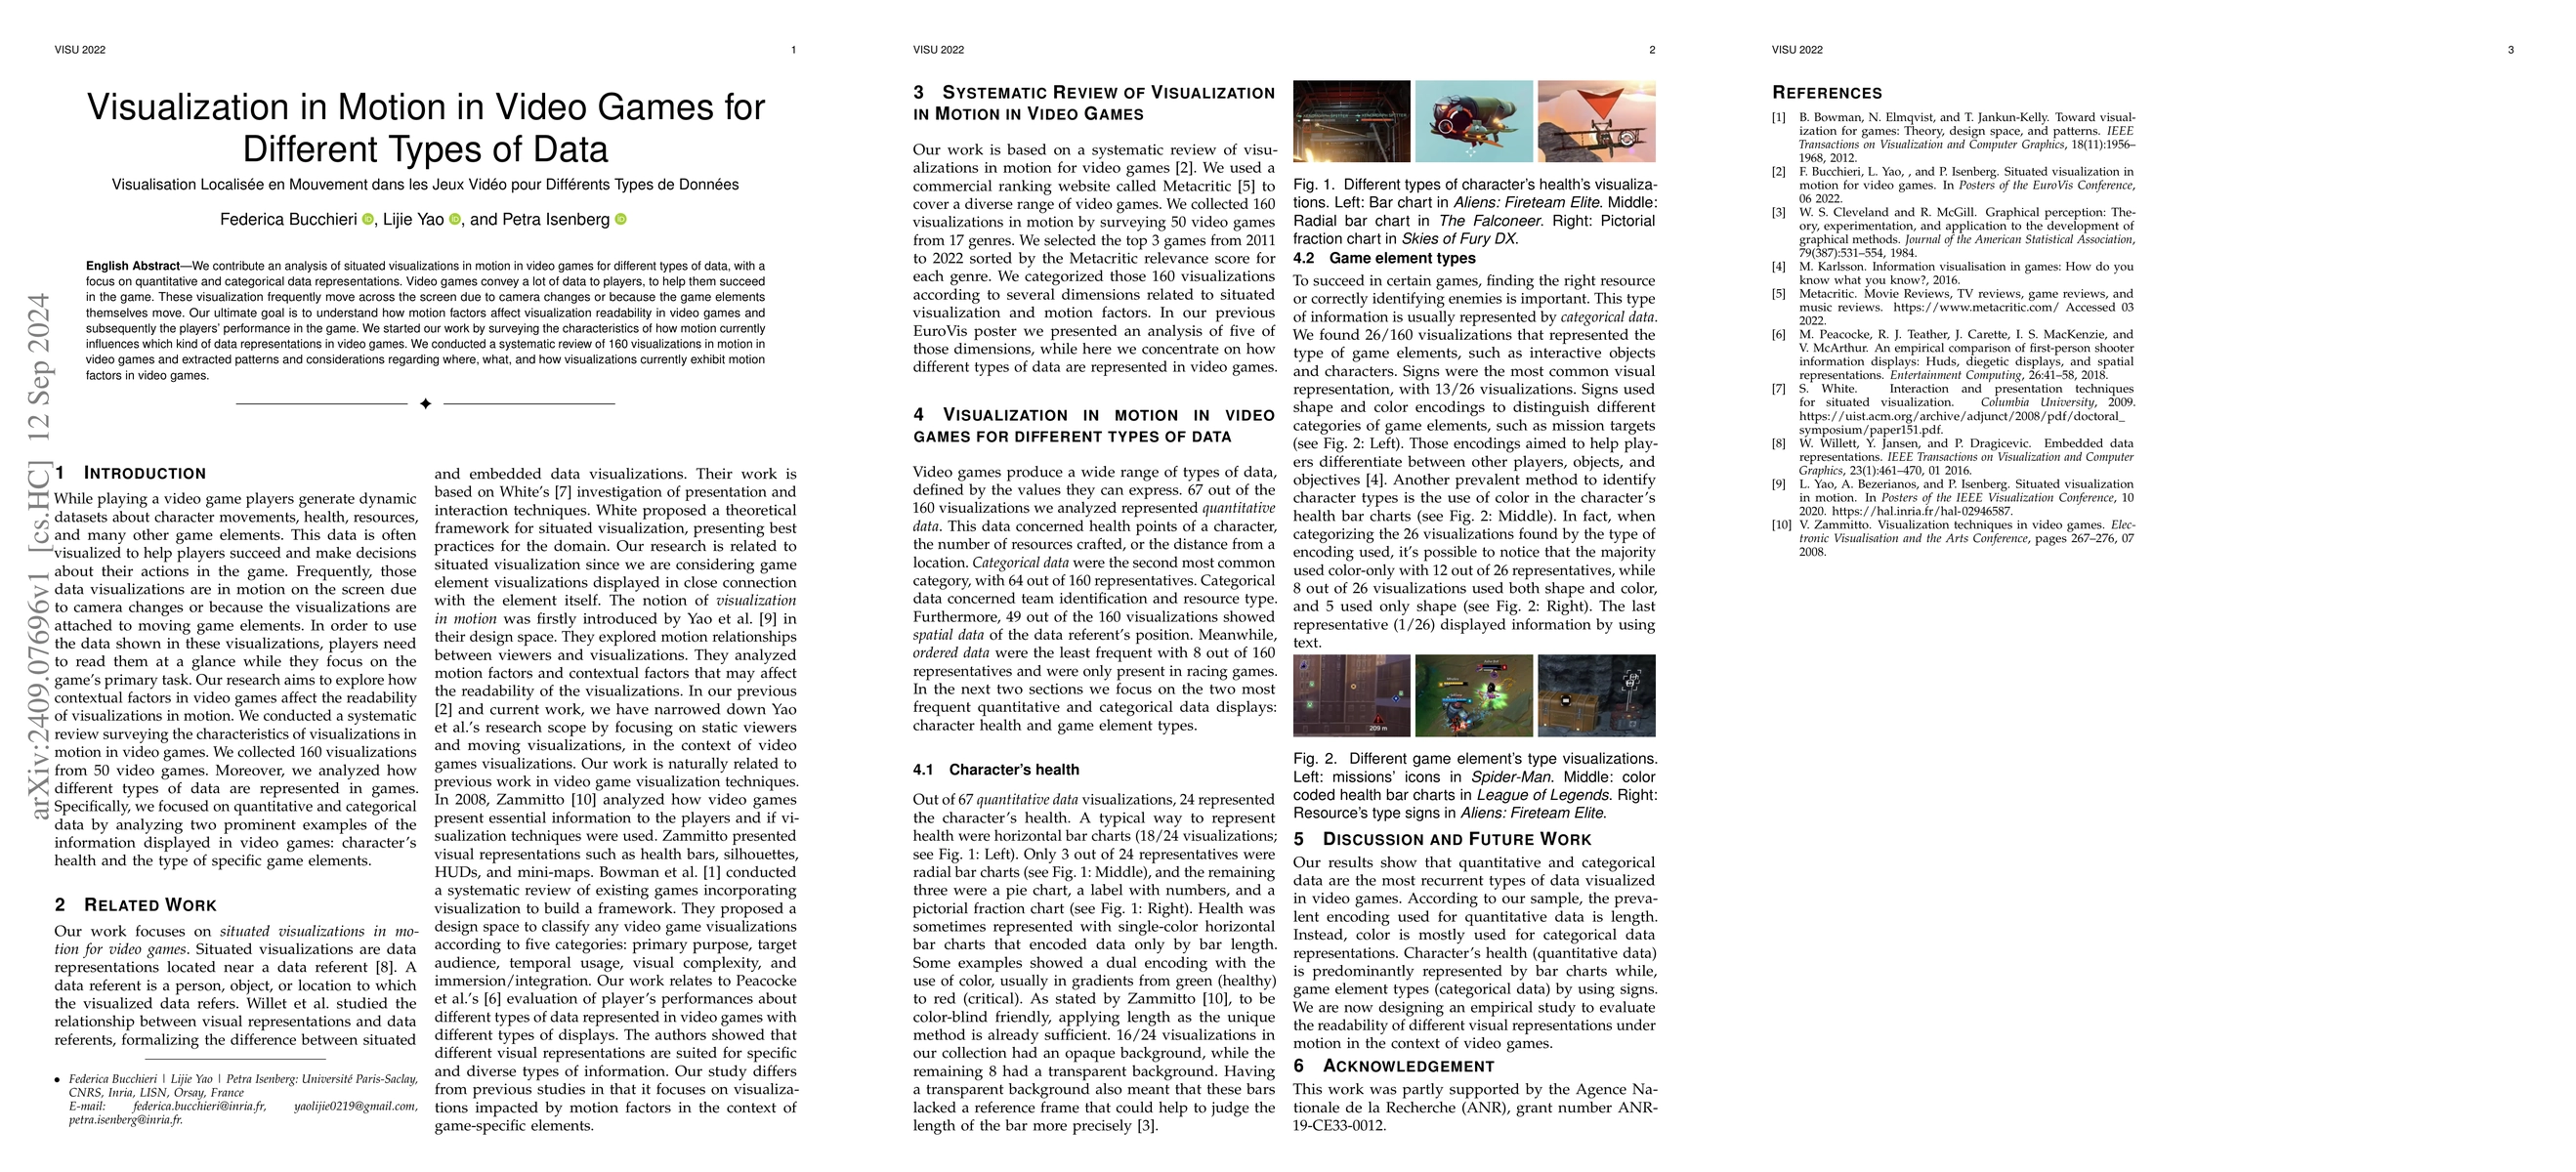
We contribute an analysis of situated visualizations in motion in video games for different types of data, with a focus on quantitative and categorical data representations. Video games convey a lot o...
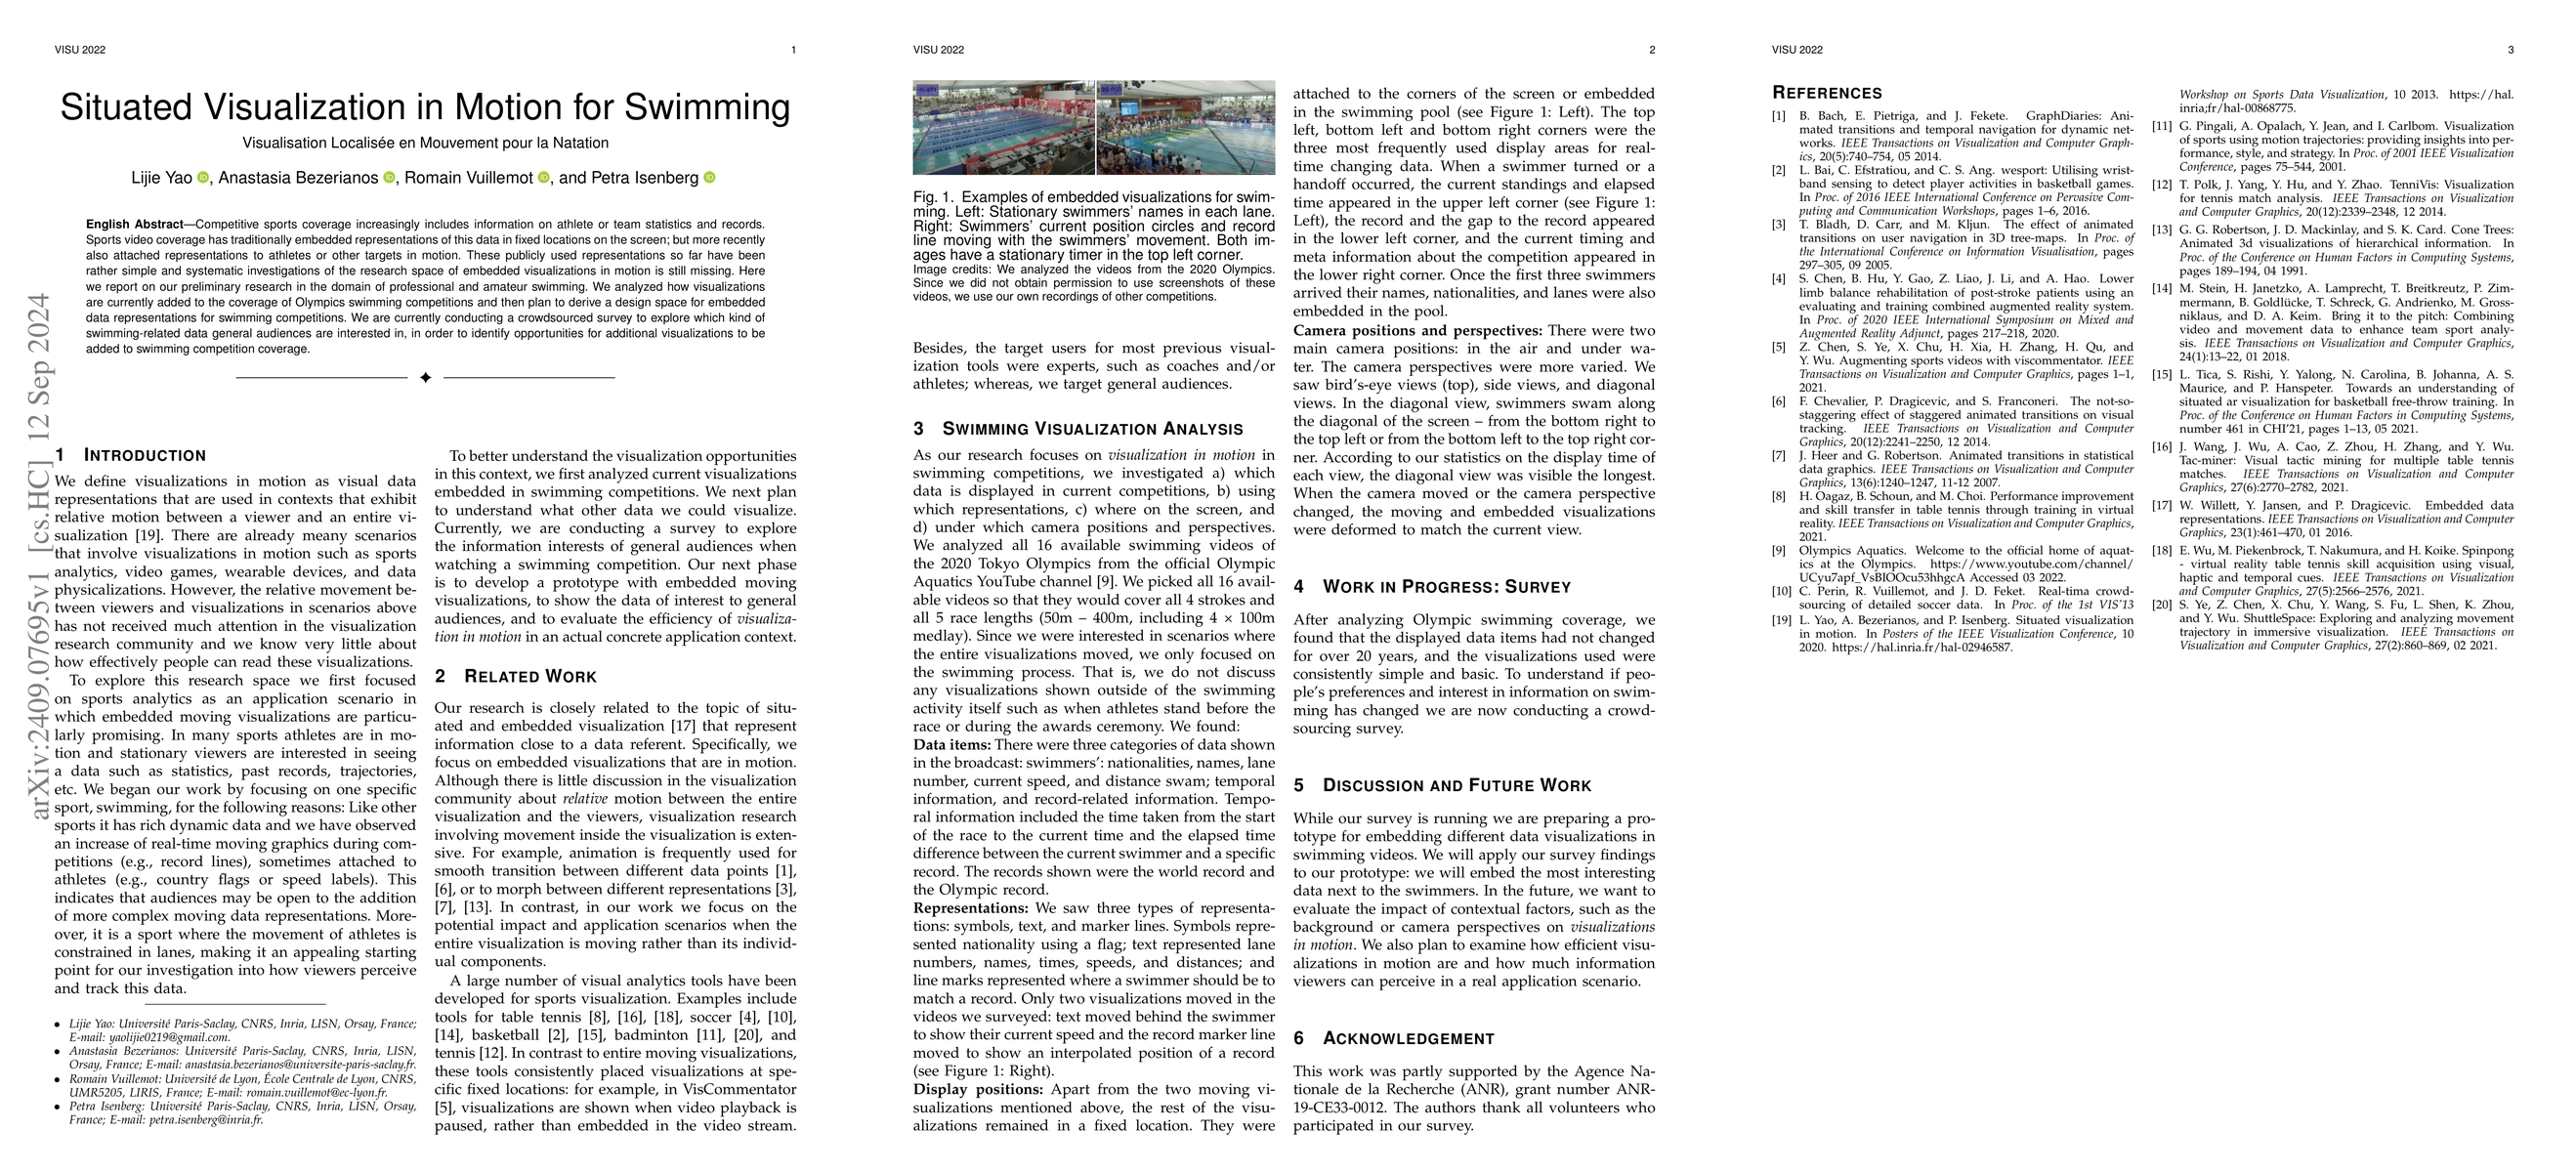
Competitive sports coverage increasingly includes information on athlete or team statistics and records. Sports video coverage has traditionally embedded representations of this data in fixed location...
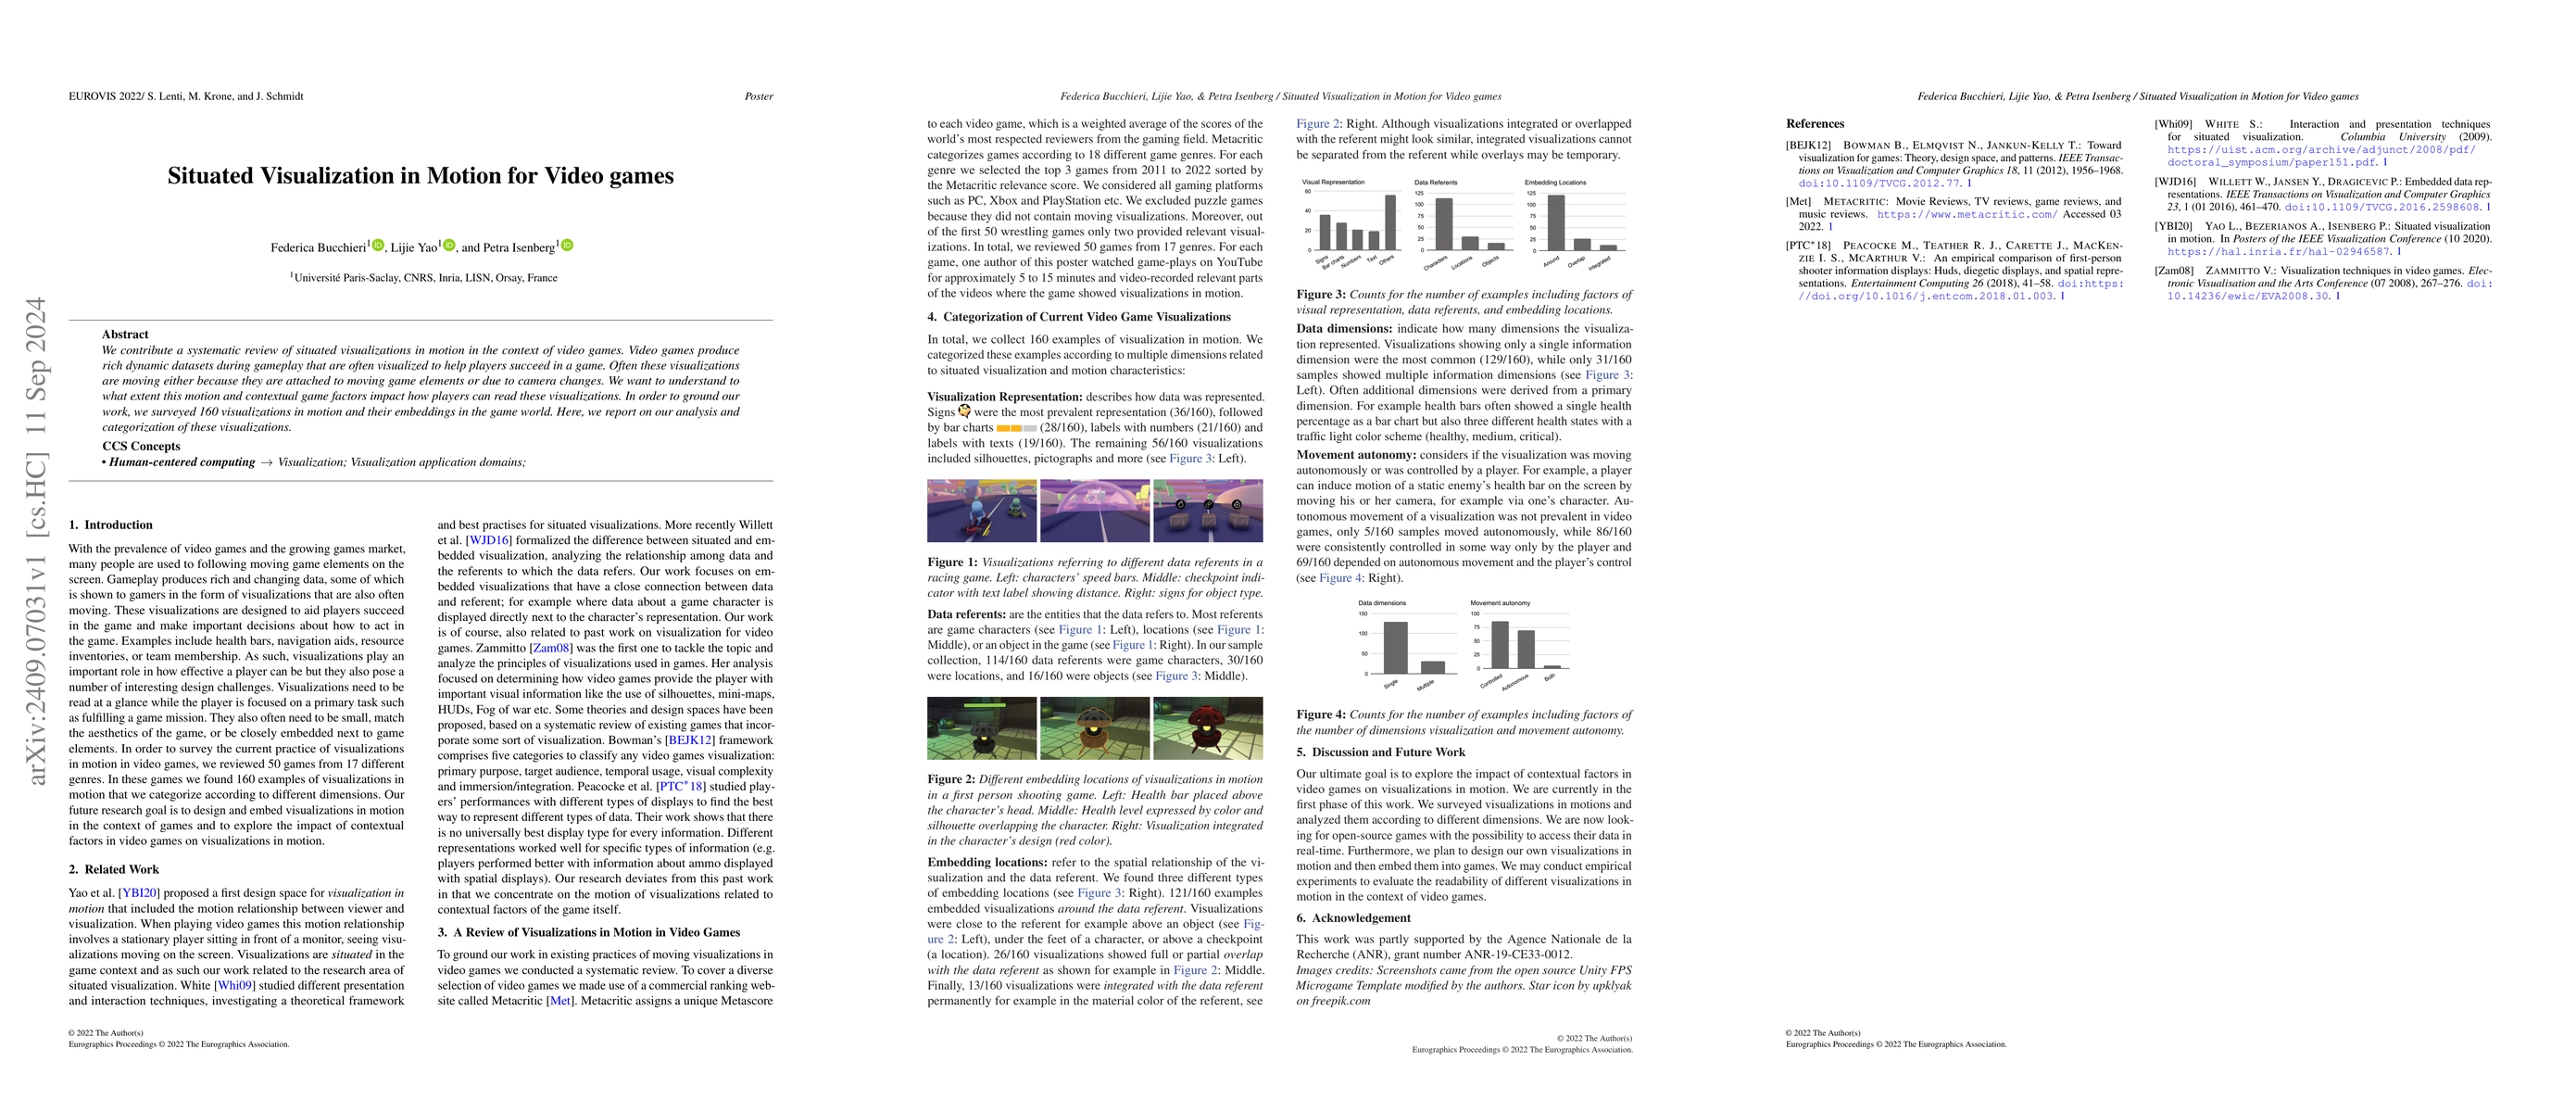
We contribute a systematic review of situated visualizations in motion in the context of video games. Video games produce rich dynamic datasets during gameplay that are often visualized to help player...
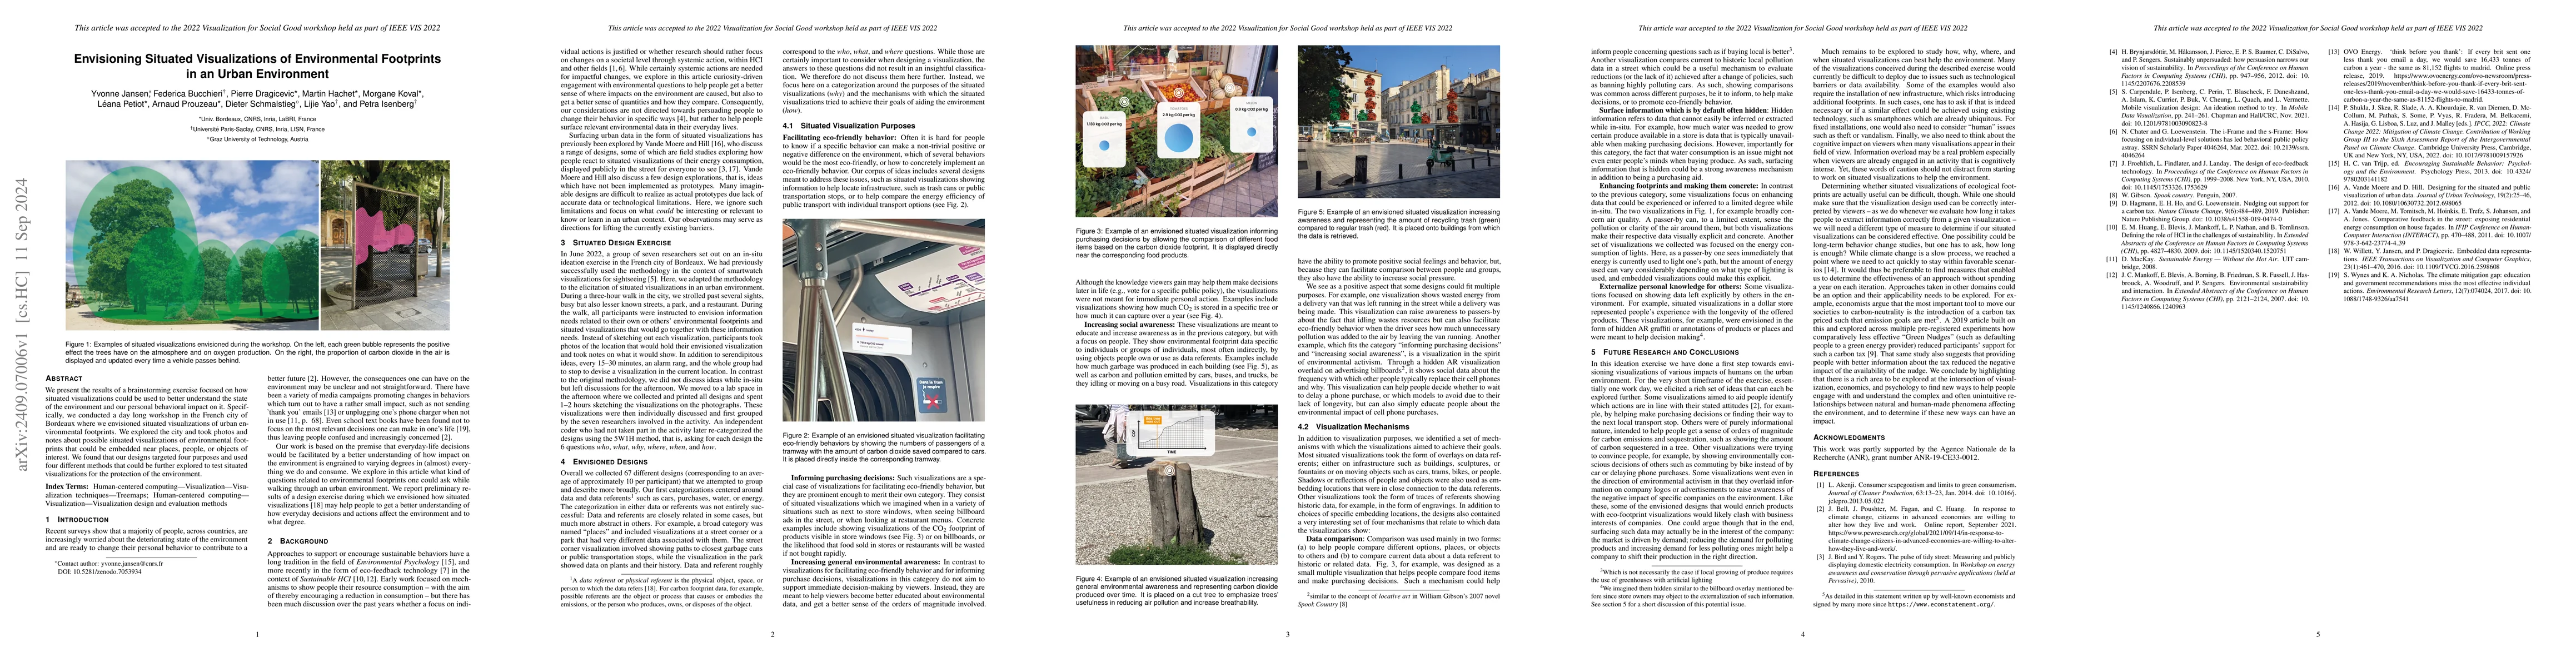
We present the results of a brainstorming exercise focused on how situated visualizations could be used to better understand the state of the environment and our personal behavioral impact on it. Spec...
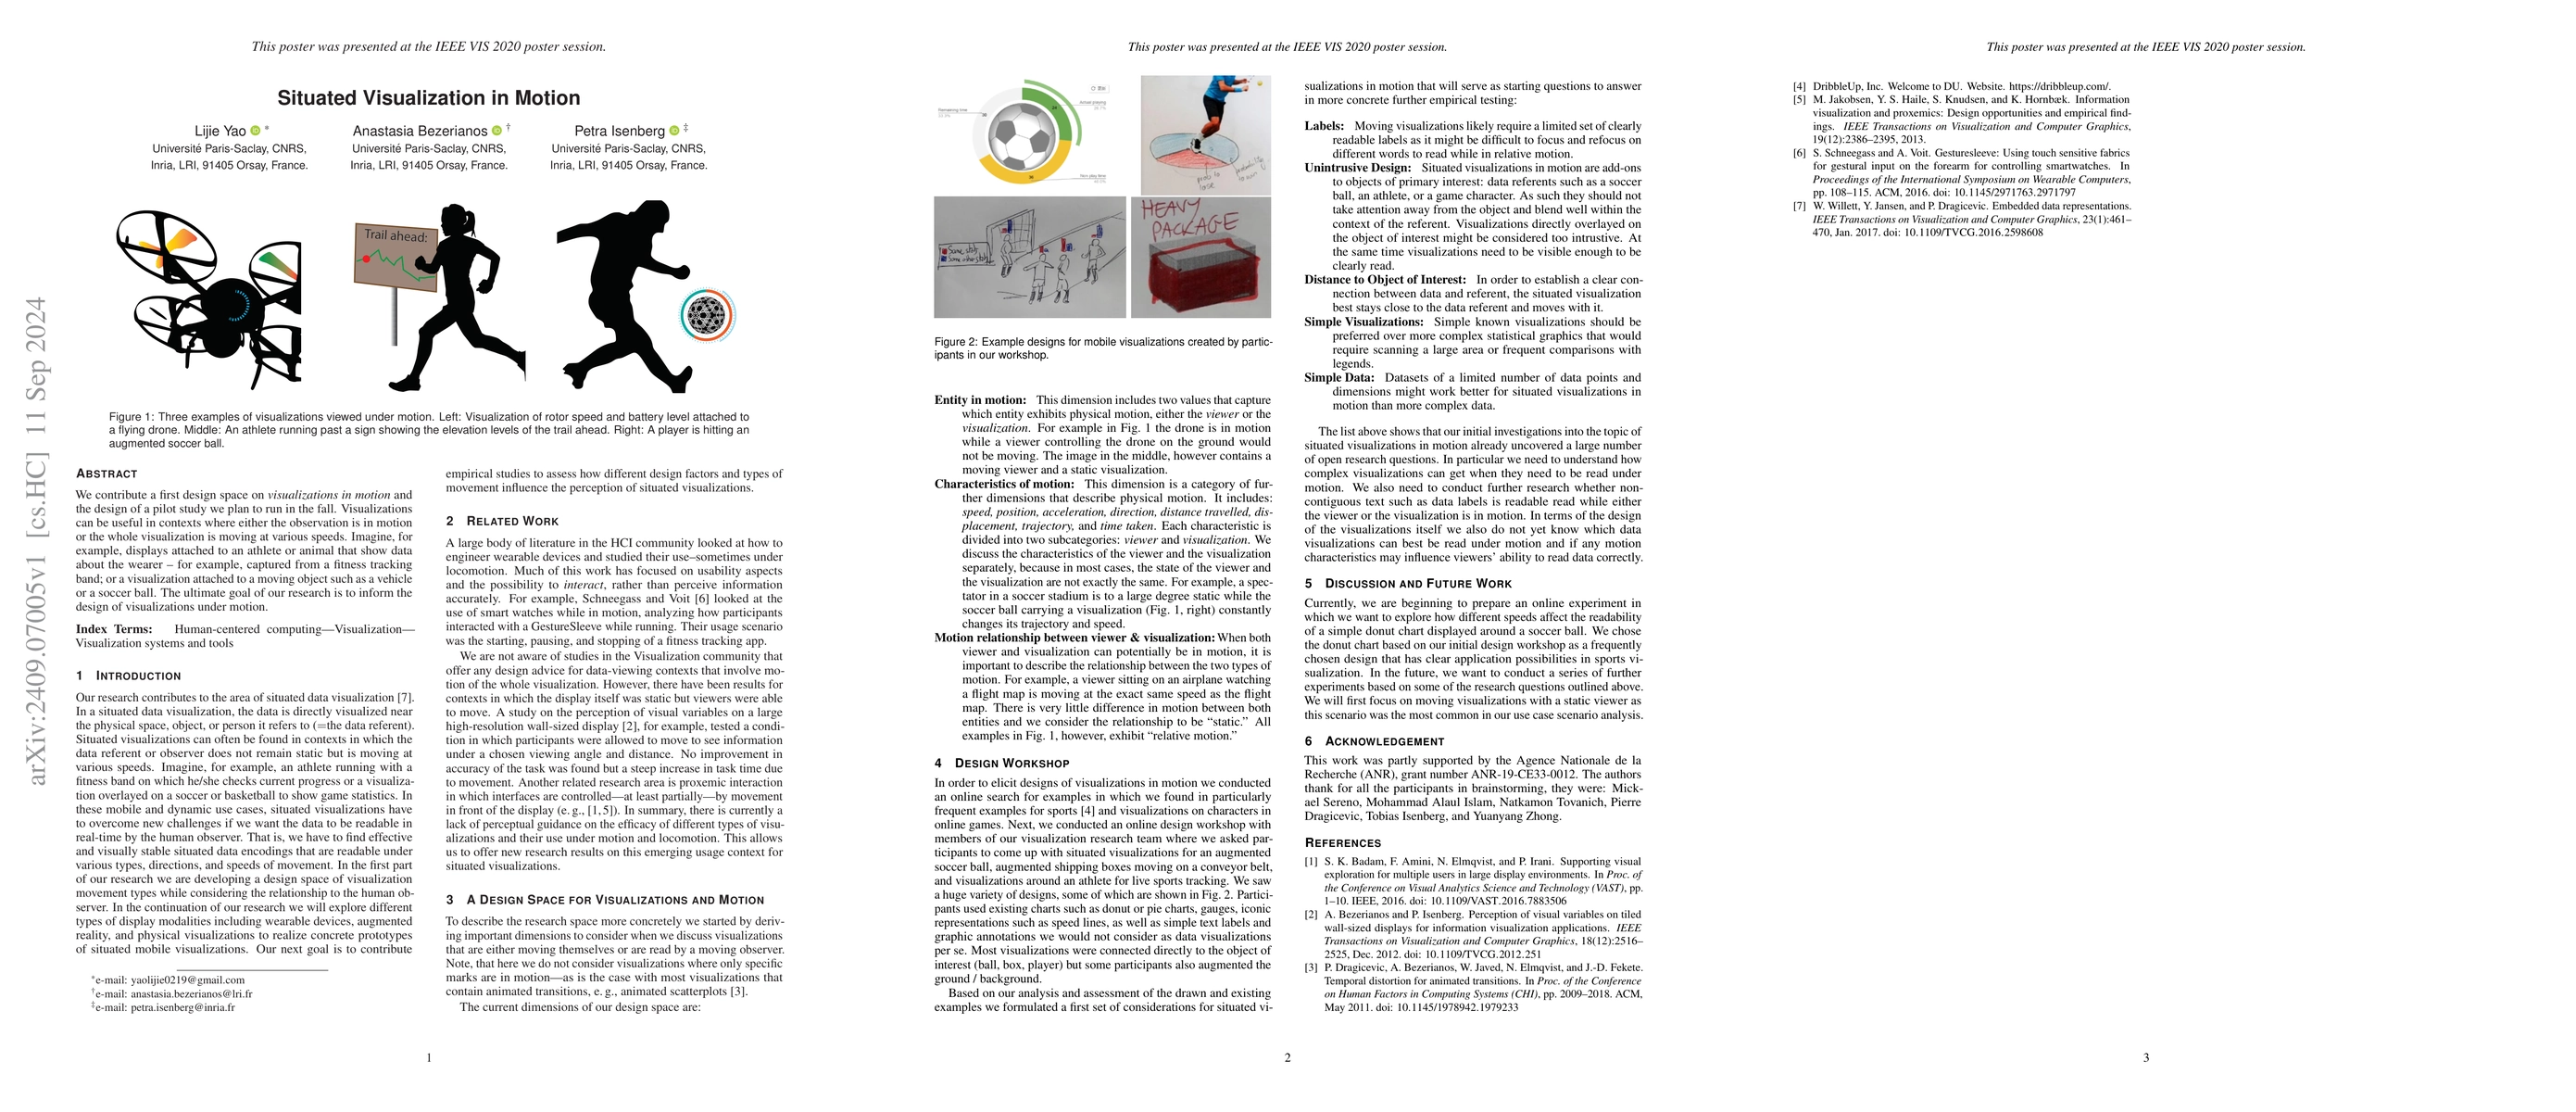
We contribute a first design space on visualizations in motion and the design of a pilot study we plan to run in the fall. Visualizations can be useful in contexts where either the observation is in m...
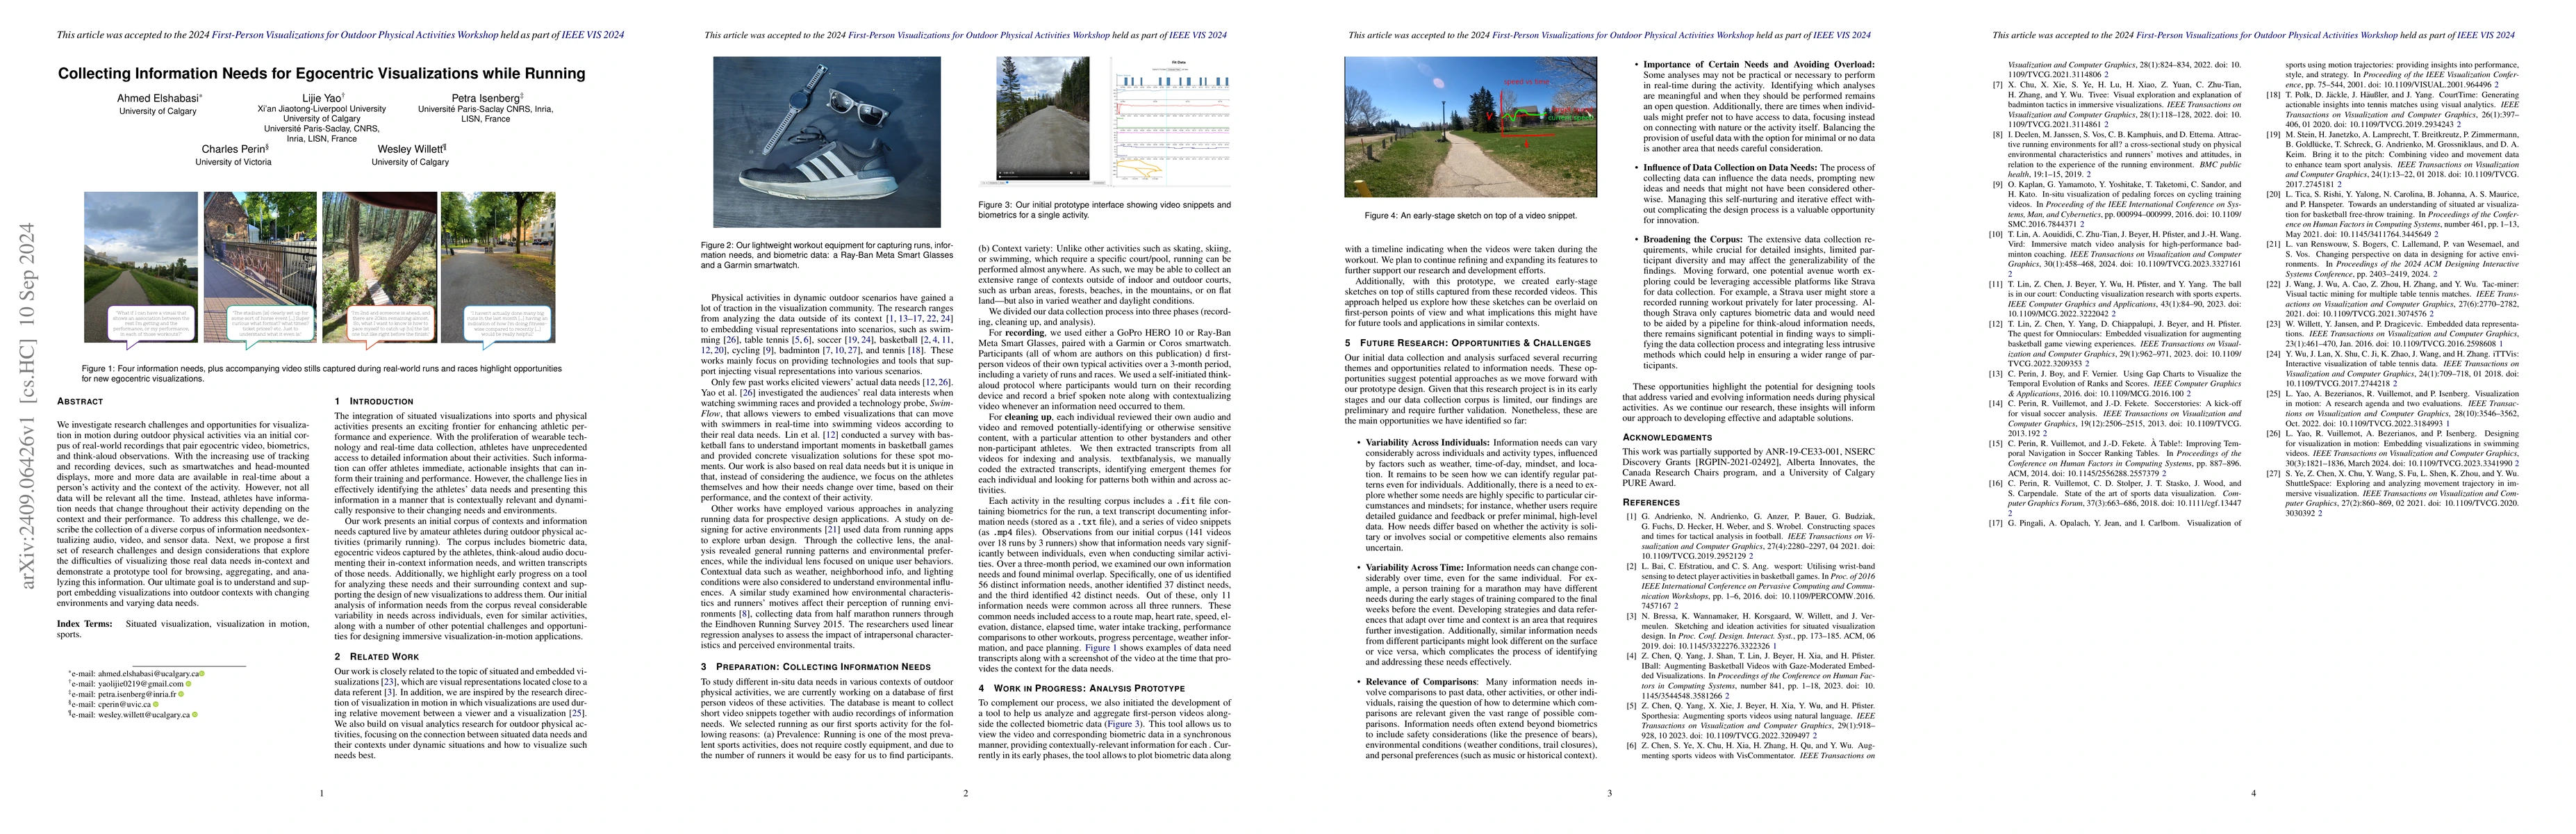
We investigate research challenges and opportunities for visualization in motion during outdoor physical activities via an initial corpus of real-world recordings that pair egocentric video, biometric...
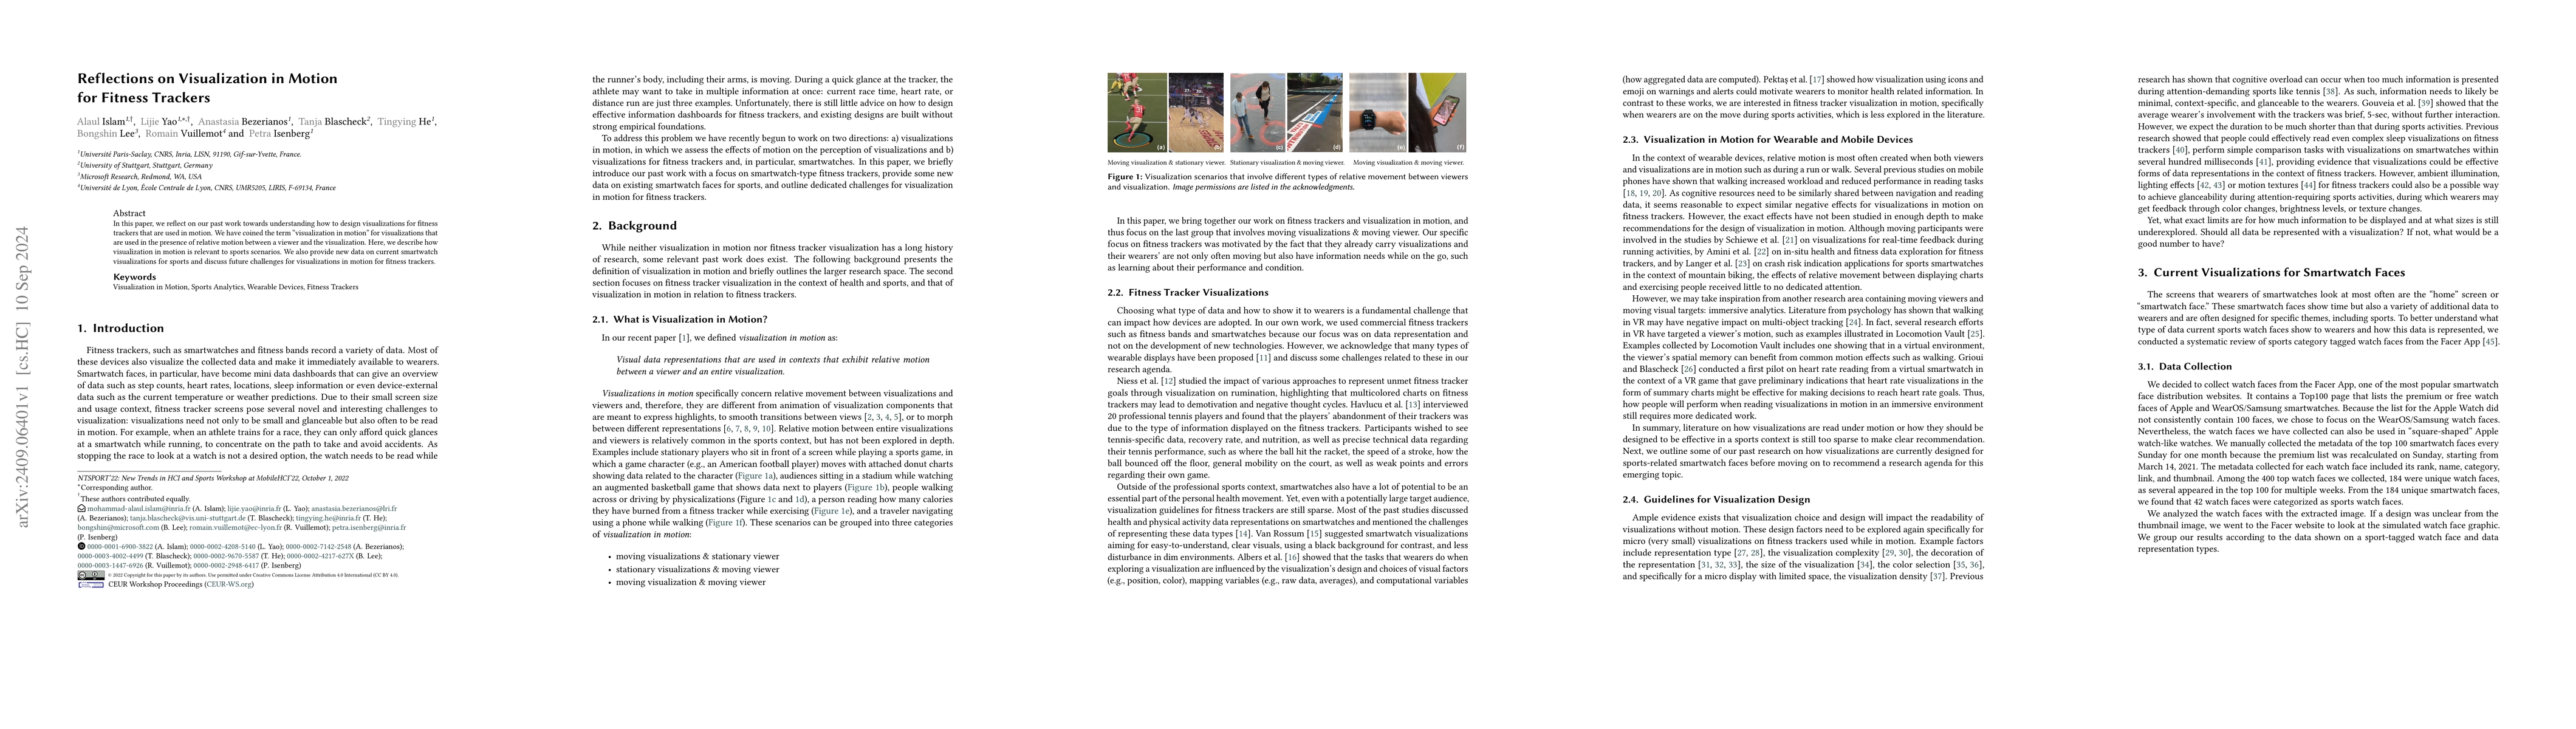
In this paper, we reflect on our past work towards understanding how to design visualizations for fitness trackers that are used in motion. We have coined the term "visualization in motion" for visual...
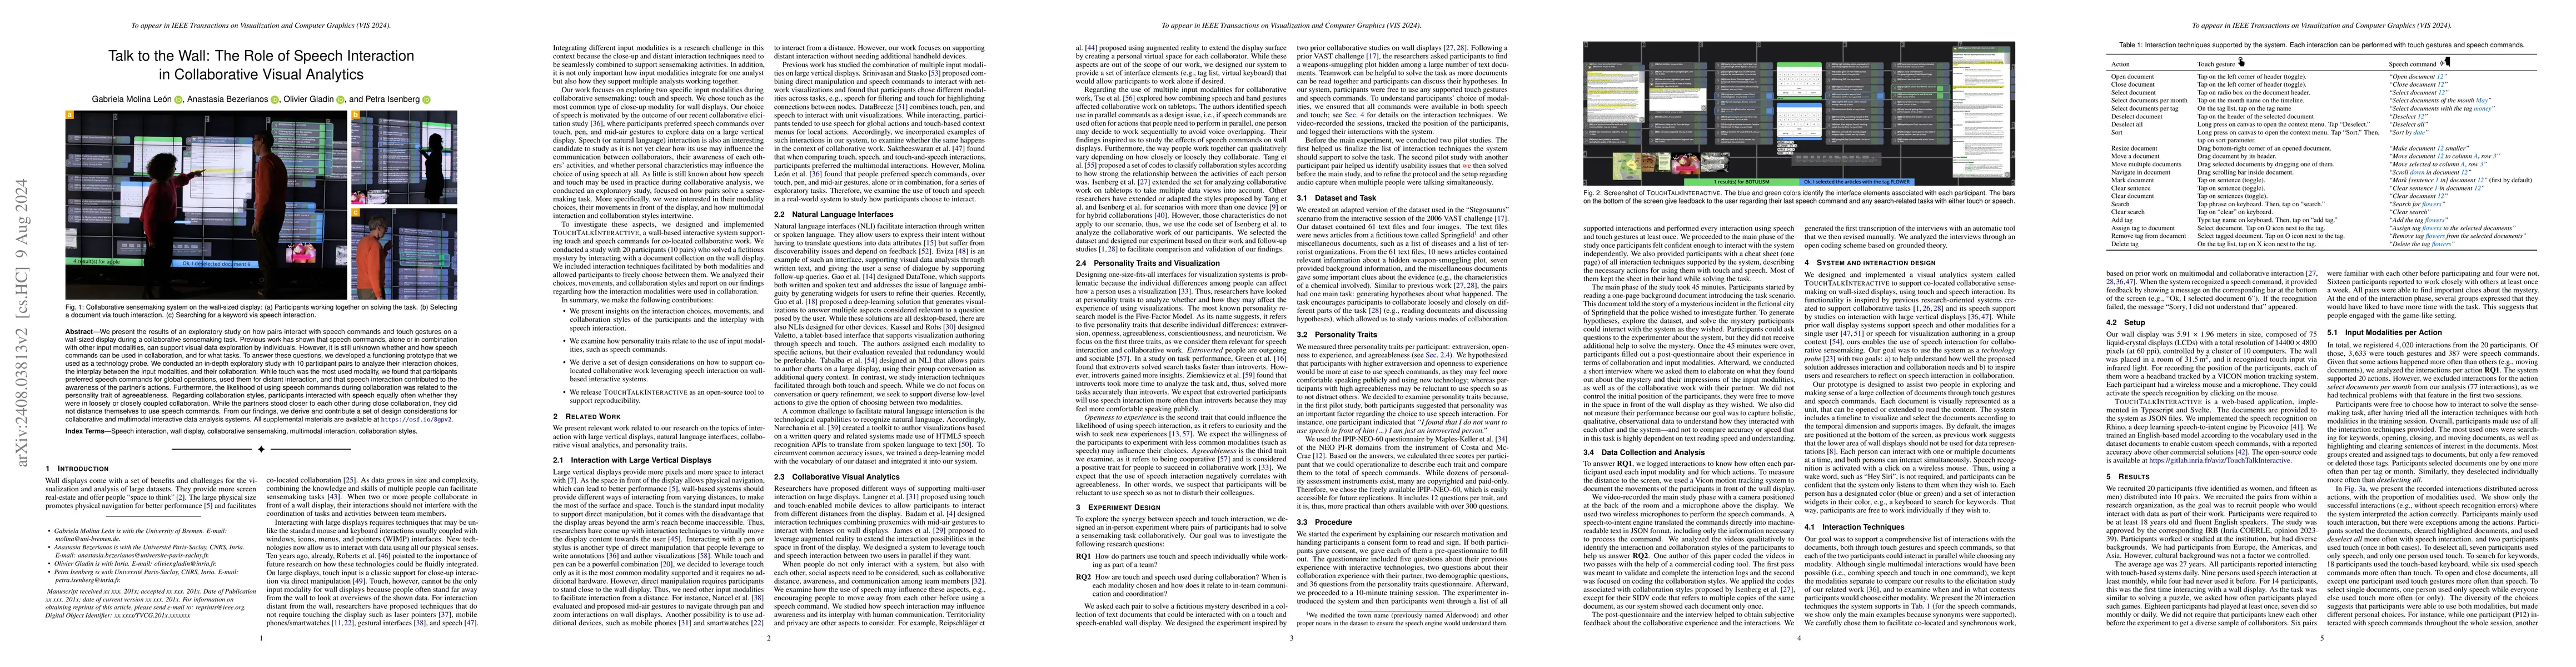
We present the results of an exploratory study on how pairs interact with speech commands and touch gestures on a wall-sized display during a collaborative sensemaking task. Previous work has shown th...
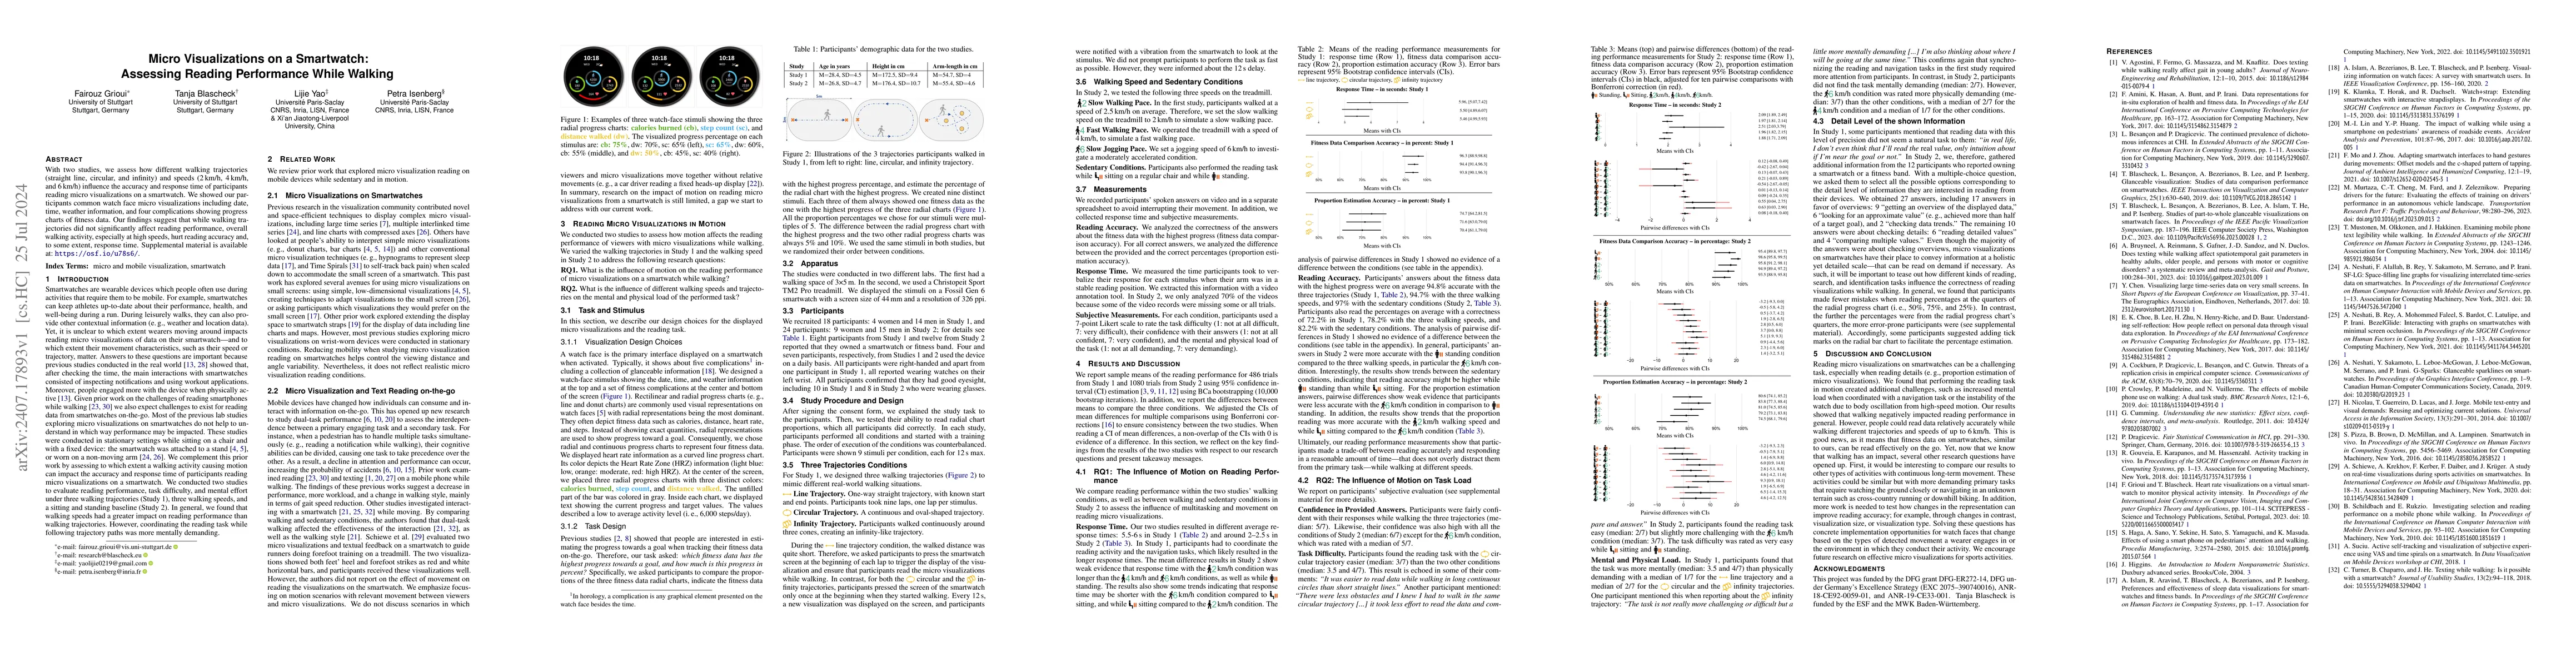
With two studies, we assess how different walking trajectories (straight line, circular, and infinity) and speeds (2 km/h, 4 km/h, and 6 km/h) influence the accuracy and response time of participants ...
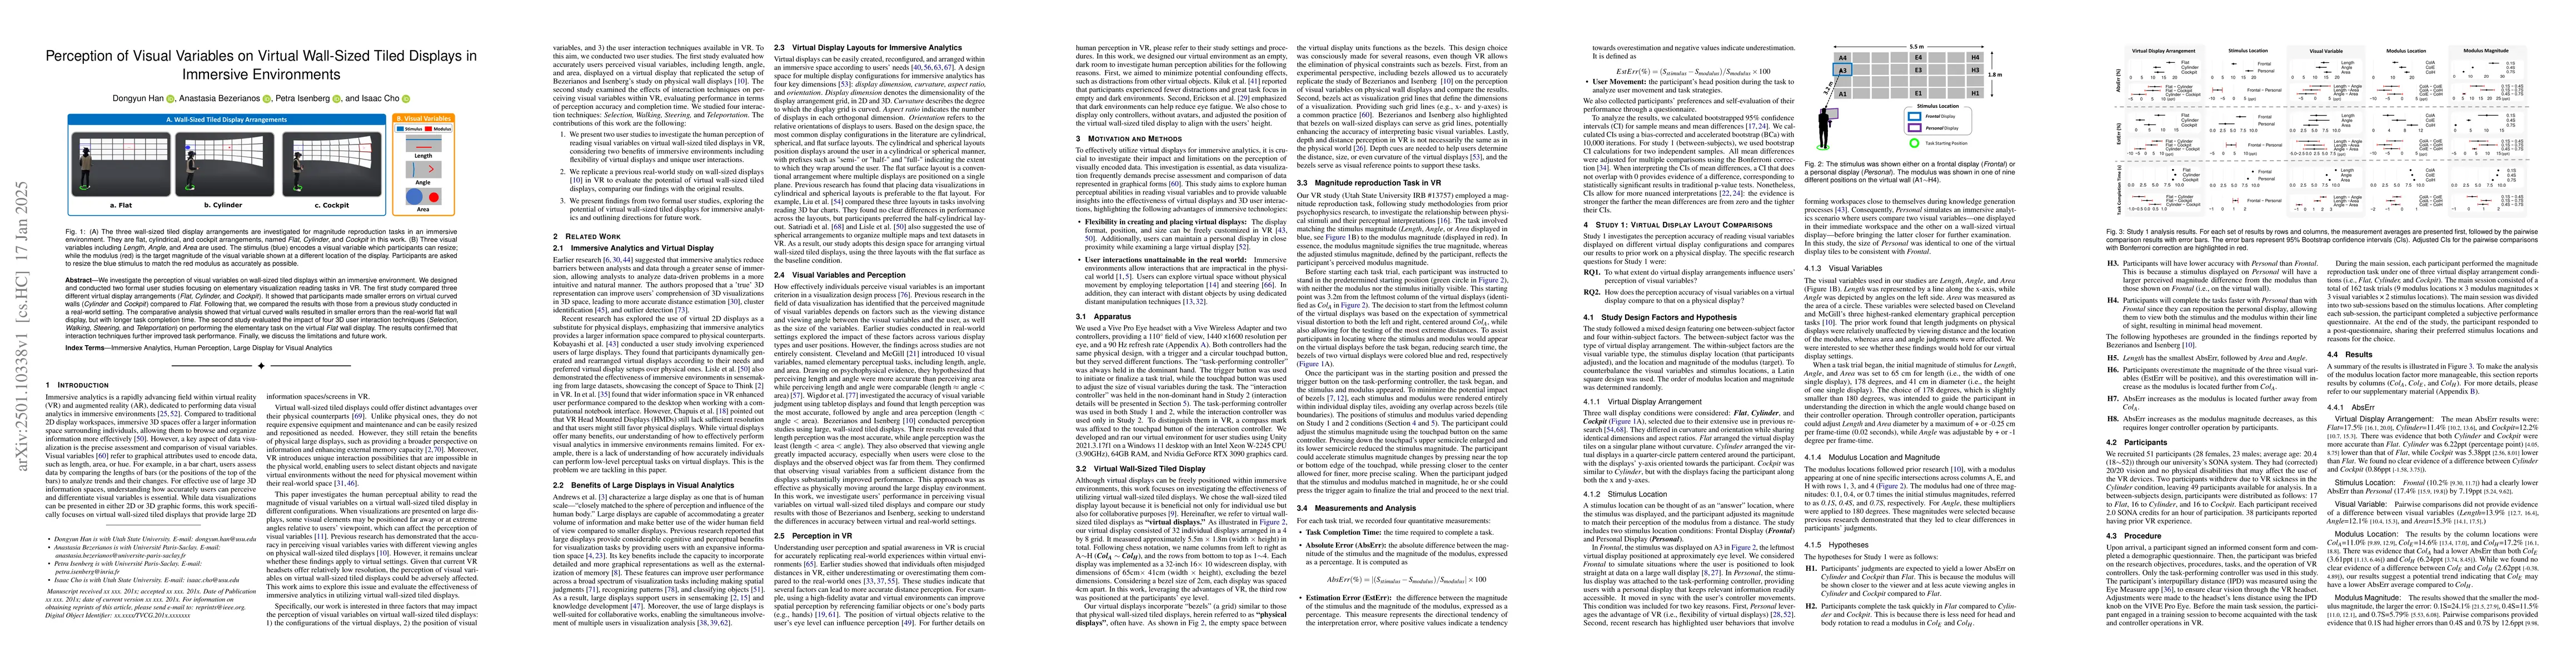
We investigate the perception of visual variables on wall-sized tiled displays within an immersive environment. We designed and conducted two formal user studies focusing on elementary visualization r...
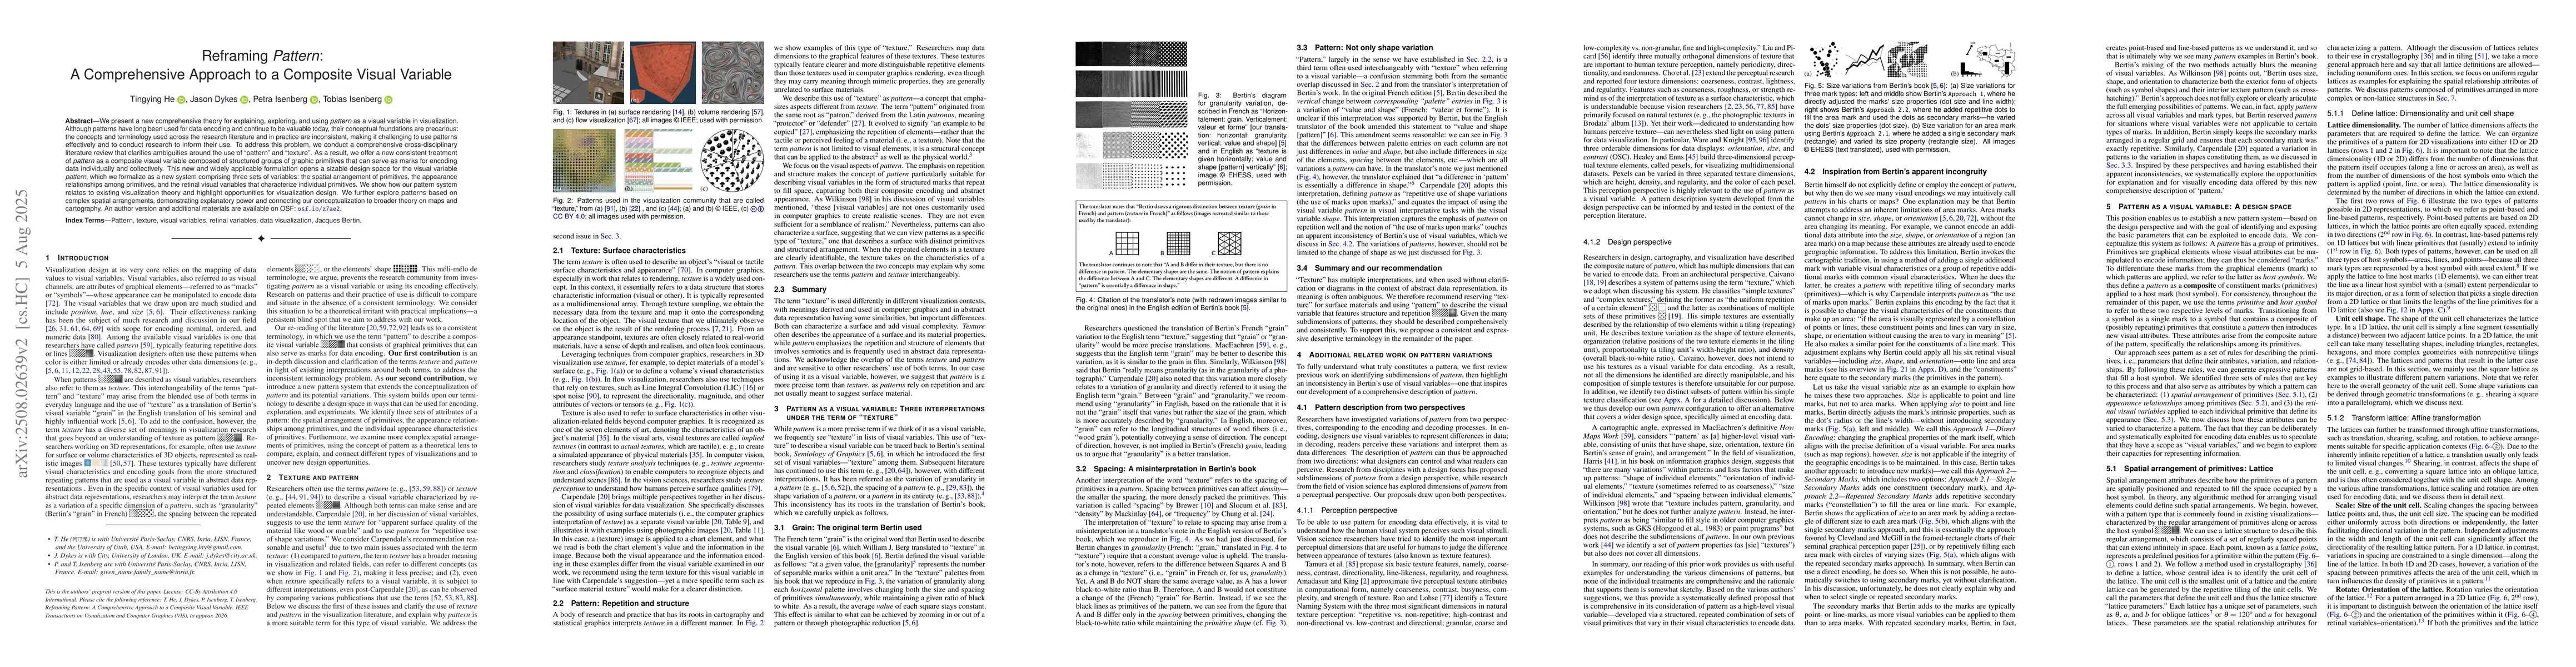
We present a new comprehensive theory for explaining, exploring, and using pattern as a visual variable in visualization. Although patterns have long been used for data encoding and continue to be val...
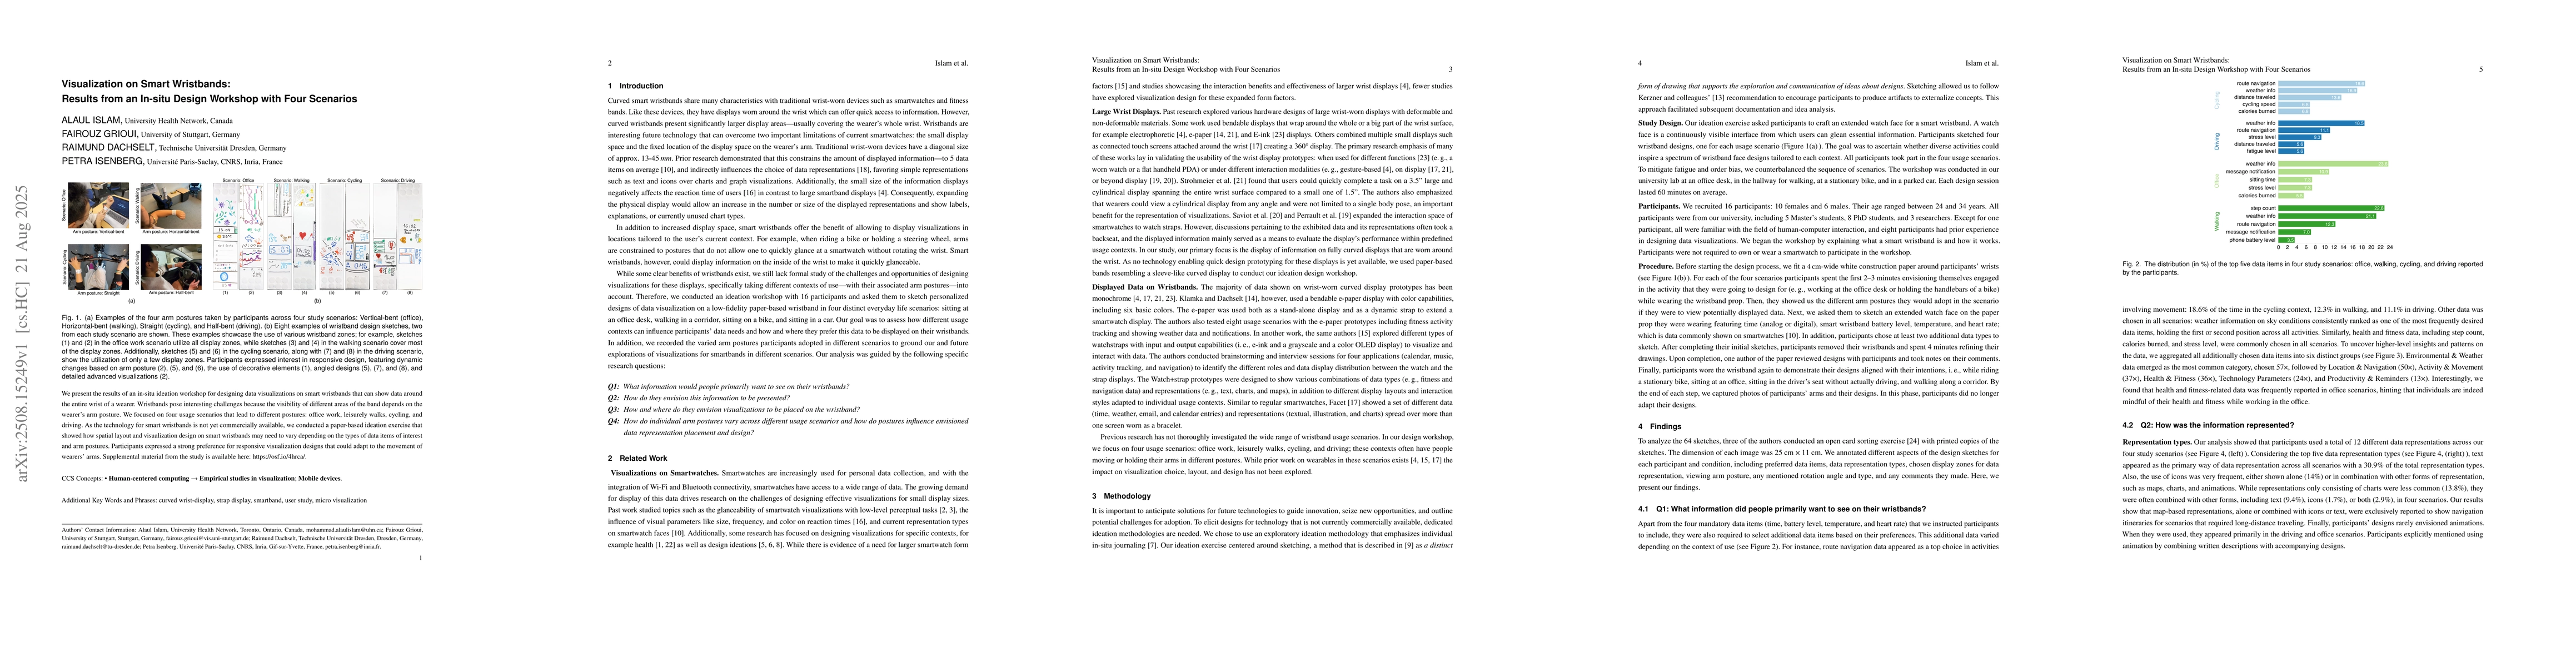
We present the results of an in-situ ideation workshop for designing data visualizations on smart wristbands that can show data around the entire wrist of a wearer. Wristbands pose interesting challen...
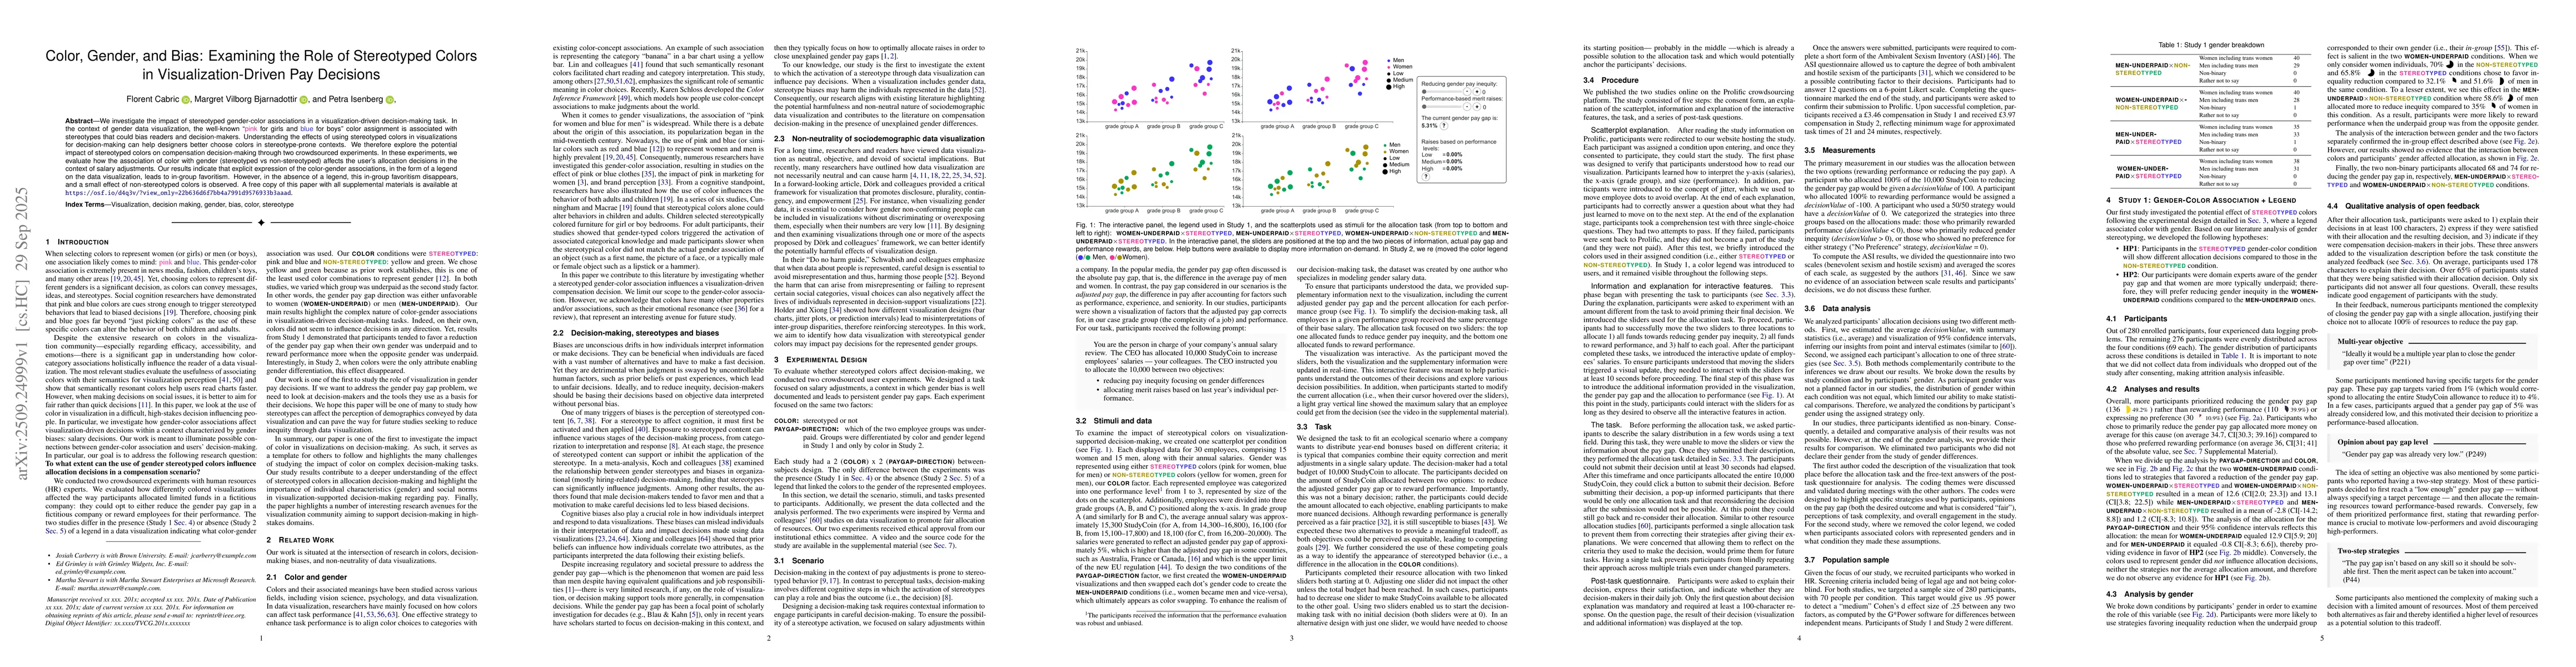
We investigate the impact of stereotyped gender-color associations in a visualization-driven decision-making task. In the context of gender data visualization, the well-known "pink for girls and blue ...
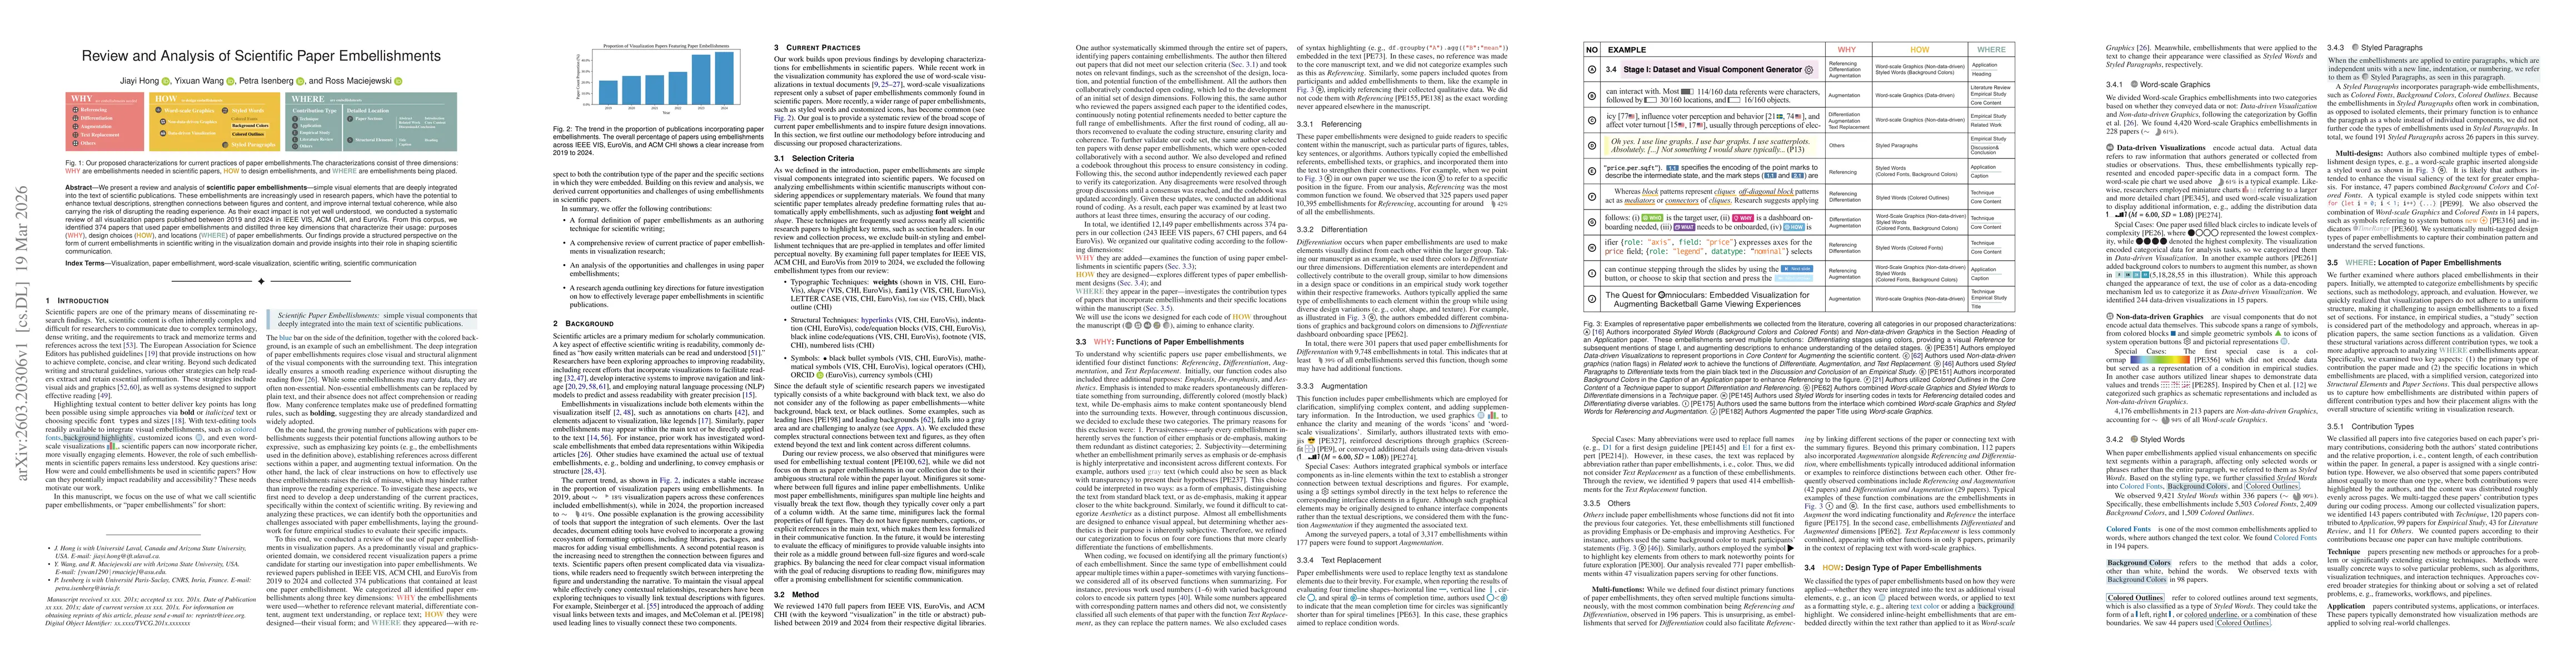
We present a review and analysis of scientific paper embellishments -- simple visual elements that are deeply integrated into the text of scientific publications. These embellishments are increasingly...