PREVis is a newly developed and validated instrument designed to measure perceived readability in data visualizations, consisting of 11 items across four dimensions: understandability, layout clarity, readability of data values, and readability of data patterns. It aims to assist researchers and practitioners in evaluating visual data representations' readability.
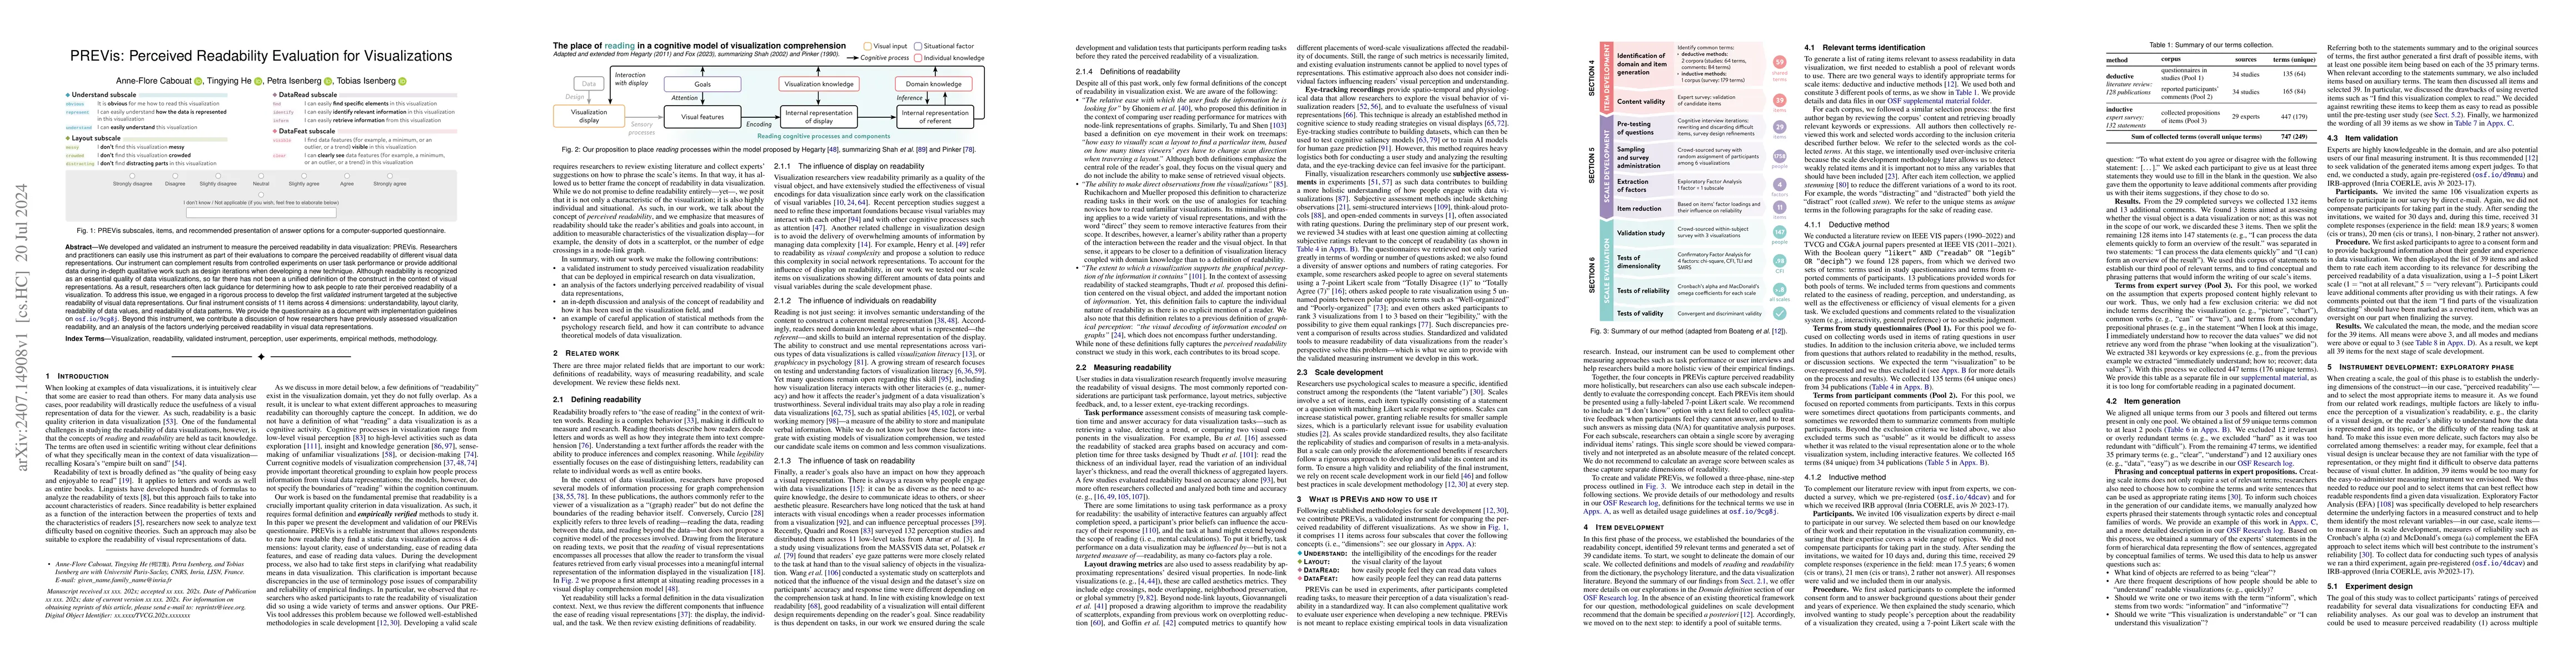
We developed and validated an instrument to measure the perceived readability in data visualization: PREVis. Researchers and practitioners can easily use this instrument as part of their evaluations to compare the perceived readability of different visual data representations. Our instrument can complement results from controlled experiments on user task performance or provide additional data during in-depth qualitative work such as design iterations when developing a new technique. Although readability is recognized as an essential quality of data visualizations, so far there has not been a unified definition of the construct in the context of visual representations. As a result, researchers often lack guidance for determining how to ask people to rate their perceived readability of a visualization. To address this issue, we engaged in a rigorous process to develop the first validated instrument targeted at the subjective readability of visual data representations. Our final instrument consists of 11 items across 4 dimensions: understandability, layout clarity, readability of data values, and readability of data patterns. We provide the questionnaire as a document with implementation guidelines on osf.io/9cg8j. Beyond this instrument, we contribute a discussion of how researchers have previously assessed visualization readability, and an analysis of the factors underlying perceived readability in visual data representations.
Get AI-generated insights about this paper's methodology, results, and significance.
Current paper (gray), citations (green), references (blue)
No similar papers found for this research.
Title | Authors | Year | Actions |
---|---|---|---|
Designing Semantically-Resonant Abstract Patterns for Data Visualization
|
Zihan Lu, Tingying He, Jia-Shun Hong, Lijie Yao, Tobias Isenberg
|
2025
|
View Paper |
HAXplorer: Interactive visual exploration of hierarchical item and attribute spaces
|
Michael Blum, Jonas Blum, M. Sachdeva, Jurgen Bernard
|
2025
|
View Paper |
What Makes a Visualization Visually Complex?
|
Kylie Lin, Sean Sheng-tse Ru, David N. Rapp, Hui Guan, Cindy Xiong Bearfield
|
2025
|
View Paper |
Leveraging personality as a proxy of perceived transparency in hierarchical visualizations
|
Tomás Alves, Carlota Dias, Daniel Gonçalves, S. Gama
|
2025
|
View Paper |
Title | Authors | Year | Actions |
---|---|---|---|
Guaranteed Visibility in Scatterplots with Tolerance
|
Loann Giovannangeli, Frédéric Lalanne, R. Giot, Romain Bourqui
|
2023
|
View Paper |
Vistrust: a Multidimensional Framework and Empirical Study of Trust in Data Visualizations
|
Hamza Elhamdadi, Ádám Stefkovics, Johanna Beyer, Eric Mörth, Hanspeter Pfister, Cindy Xiong Bearfield, Carolina Nobre
|
2023
|
View Paper |
Adaptive Assessment of Visualization Literacy
|
Yuanling Cui, Li Ge, Yiren Ding, Fumeng Yang, Lane Harrison, M. Kay
|
2023
|
View Paper |
Quantivine: A Visualization Approach for Large-Scale Quantum Circuit Representation and Analysis
|
Zhen Wen, Yihan Liu, Siwei Tan, Jie Chen, Minfeng Zhu, Dongming Han, Jianwei Yin, Mingliang Xu, Wei Chen
|
2023
|
View Paper |
Number of Response Categories and Sample Size Requirements in Polytomous IRT Models
|
Dubravka Svetina Valdivia, Shenghai Dai
|
2023
|
View Paper |
The Risks of Ranking: Revisiting Graphical Perception to Model Individual Differences in Visualization Performance
|
Russell Davis, Xiaoying Pu, Yiren Ding, Brian D. Hall, Karen Bonilla, Mi Feng, M. Kay, Lane Harrison
|
2022
|
View Paper |
A Scanner Deeply: Predicting Gaze Heatmaps on Visualizations Using Crowdsourced Eye Movement Data
|
Sungbok Shin, Sunghyo Chung, Sanghyun Hong, N. Elmqvist
|
2022
|
View Paper |
Dual Space Coupling Model Guided Overlap-Free Scatterplot
|
Zeyu Li, Ruizhi Shi, Y. Liu, Shizhuo Long, Ziheng Guo, Shichao Jia, Jiawan Zhang
|
2022
|
View Paper |
Seeing What You Believe or Believing What You See? Belief Biases Correlation Estimation
|
Cindy Xiong, Chase Stokes, Yea-Seul Kim, S. Franconeri
|
2022
|
View Paper |
BeauVis: A Validated Scale for Measuring the Aesthetic Pleasure of Visual Representations
|
Tingying He, Petra Isenberg, Raimund Dachselt, Tobias Isenberg
|
2022
|
View Paper |
Visualization in Motion: A Research Agenda and Two Evaluations
|
L. Yao, A. Bezerianos, Romain Vuillemot, Petra Isenberg
|
2022
|
View Paper |
Effective Use of Likert Scales in Visualization Evaluations: A Systematic Review
|
Laura South, David Saffo, Olga Vitek, Cody Dunne, M. Borkin
|
2022
|
View Paper |
Visualization Psychology for Eye Tracking Evaluation
|
Maurice Koch, K. Kurzhals, Michael Burch, D. Weiskopf
|
2022
|
View Paper |
The State of the Art
|
Rebeca Helfer
|
2021
|
View Paper |
What makes a scatterplot hard to comprehend: data size and pattern salience matter
|
Jiachen Wang, Xiwen Cai, Jiajie Su, Yu Liao, Yingcai Wu
|
2021
|
View Paper |
Professional Differences: A Comparative Study of Visualization Task Performance and Spatial Ability Across Disciplines
|
K. Hall, Anthony Kouroupis, A. Bezerianos, D. Szafir, C. Collins
|
2021
|
View Paper |
A Survey of Perception-Based Visualization Studies by Task
|
Ghulam Jilani Quadri, P. Rosen
|
2021
|
View Paper |
Declutter and Focus: Empirically Evaluating Design Guidelines for Effective Data Communication
|
Kiran Ajani, Elsie Lee, Cindy Xiong, Cole Nussbaumer Knaflic, William T. Kemper, S. Franconeri
|
2021
|
View Paper |
Missing data in surveys: Key concepts, approaches, and applications.
|
A. Mirzaei, S. Carter, A. Patanwala, C. Schneider
|
2021
|
View Paper |
On the Readability of Abstract Set Visualizations
|
Mark Wallinger, Benjamin N. Jacobsen, S. Kobourov, M. Nöllenburg
|
2021
|
View Paper |
Guidelines for Conducting Virtual Cognitive Interviews During a Pandemic
|
J. Shepperd, Gabrielle Pogge, Jean M Hunleth, Sienna Ruiz, Erika A. Waters
|
2020
|
View Paper |
SineStream: Improving the Readability of Streamgraphs by Minimizing Sine Illusion Effects
|
Chuan Bu, Quanjie Zhang, Qianwen Wang, Jian Zhang, M. Sedlmair, O. Deussen, Yunhai Wang
|
2020
|
View Paper |
A Study of Perceptual and Cognitive Models Applied to Prediction of Eye Gaze within Statistical Graphs
|
M. Livingston, Laura E. Matzen, Andre Harrison, Alexander Lulushi, Mikaila Daniel, Megan Dass, Derek P. Brock, Jonathan W. Decker
|
2020
|
View Paper |
Using Fit Statistic Differences to Determine the Optimal Number of Factors to Retain in an Exploratory Factor Analysis
|
W. H. Finch
|
2020
|
View Paper |
Survey on Individual Differences in Visualization
|
Zhengliang Liu, R. Crouser, Alvitta Ottley
|
2020
|
View Paper |
Measuring the Separability of Shape, Size, and Color in Scatterplots
|
Stephen Smart, D. Szafir
|
2019
|
View Paper |
Reading Comprehension Research: Implications for Practice and Policy
|
Amy M. Elleman, Eric L. Oslund
|
2019
|
View Paper |
Evaluating the Readability of Force Directed Graph Layouts: A Deep Learning Approach
|
Hammad Haleem, Y. Wang, Abishek Puri, Sahil Wadhwa, Huamin Qu
|
2018
|
View Paper |
Decision making with visualizations: a cognitive framework across disciplines
|
Lace M. K. Padilla, Sarah H. Creem-Regehr, M. Hegarty, Jeanine K. Stefanucci
|
2018
|
View Paper |
Best Practices for Developing and Validating Scales for Health, Social, and Behavioral Research: A Primer
|
Godfred O Boateng, T. Neilands, E. Frongillo, H. Melgar-Quiñonez, S. Young
|
2018
|
View Paper |
It Pays to Be Lazy: Reusing Force Approximations to Compute Better Graph Layouts Faster
|
R. Gove
|
2018
|
View Paper |
Understanding Fatigue and its Impact in Crowdsourcing
|
Y. Zhang, X. Ding, Ning Gu
|
2018
|
View Paper |
Exploring visual attention and saliency modeling for task-based visual analysis
|
Patrik Polatsek, Manuela Waldner, I. Viola, Peter Kapec, Wanda Benesova
|
2018
|
View Paper |
Exploratory Factor Analysis: A Guide to Best Practice
|
Marley W. Watkins
|
2018
|
View Paper |
On using multiple imputation for exploratory factor analysis of incomplete data
|
V. Nassiri, Aniko Lovik, G. Molenberghs, G. Verbeke
|
2018
|
View Paper |
Exploratory Factor Analysis With Small Samples and Missing Data
|
Daniel M. McNeish
|
2017
|
View Paper |
Evidence-Based Survey Design: The Use of a Midpoint on the Likert Scale
|
S. Chyung, Katherine Roberts, Ieva Swanson, A. Hankinson
|
2017
|
View Paper |
Patterns of Attention: How Data Visualizations Are Read
|
Laura E. Matzen, Michael J. Haass, Kristin M. Divis, Mallory C. Stites
|
2017
|
View Paper |
User performance and reading strategies for metro maps: An eye tracking study
|
Rudolf Netzel, Bettina Ohlhausen, K. Kurzhals, Robin Woods, Michael Burch, D. Weiskopf
|
2017
|
View Paper |
An Empire Built On Sand: Reexamining What We Think We Know About Visualization
|
Robert Kosara
|
2016
|
View Paper |
Cognitive Stages in Visual Data Exploration
|
M. A. Yalçın, N. Elmqvist, B. Bederson
|
2016
|
View Paper |
Beyond Usability and Performance: A Review of User Experience-focused Evaluations in Visualization
|
B. Saket, A. Endert, J. Stasko
|
2016
|
View Paper |
Using Gap Charts to Visualize the Temporal Evolution of Ranks and Scores
|
Charles Perin, Jeremy Boy, F. Vernier
|
2016
|
View Paper |
Investigating aspects of data visualization literacy using 20 information visualizations and 273 science museum visitors
|
K. Börner, A. Maltese, R. N. Balliet, J. Heimlich
|
2016
|
View Paper |
Assessing the Readability of Stacked Graphs
|
Alice Thudt, Jagoda Walny, Charles Perin, Fateme Rajabiyazdi, Lindsay MacDonald, Riane Vardeleon, S. Greenberg, Sheelagh Carpendale
|
2016
|
View Paper |
Using Eye Tracking Metrics and Visual Saliency Maps to Assess Image Utility
|
Laura E. Matzen, Michael J. Haass, Jonathan Tran, Laura A. McNamara
|
2016
|
View Paper |
How do People Make Sense of Unfamiliar Visualizations?: A Grounded Model of Novice's Information Visualization Sensemaking
|
Sukwon Lee, Sung-Hee Kim, Ya-Hsin Hung, Heidi Lam, Youn ah Kang, Ji Soo Yi
|
2016
|
View Paper |
Learning Visualizations by Analogy: Promoting Visual Literacy through Visualization Morphing
|
Puripant Ruchikachorn, K. Mueller
|
2015
|
View Paper |
Evaluating Cartogram Effectiveness
|
S. Nusrat, M. J. Alam, S. Kobourov
|
2015
|
View Paper |
Readability metric feedback for aiding node-link visualization designers
|
Cody Dunne, Steven I. Ross, B. Shneiderman, Mauro Martino
|
2015
|
View Paper |
Visualization Analysis and Design
|
T. Munzner
|
2014
|
View Paper |
Value-driven evaluation of visualizations
|
J. Stasko
|
2014
|
View Paper |
Evaluating visual analytics with eye tracking
|
K. Kurzhals, Brian D. Fisher, Michael Burch, D. Weiskopf
|
2014
|
View Paper |
Knowledge Generation Model for Visual Analytics
|
D. Sacha, A. Stoffel, Florian Stoffel, Bum Chul Kwon, Geoffrey P. Ellis, D. Keim
|
2014
|
View Paper |
A Principled Way of Assessing Visualization Literacy
|
Jeremy Boy, Ronald A. Rensink, E. Bertini, Jean-Daniel Fekete
|
2014
|
View Paper |
Exploring the Placement and Design of Word-Scale Visualizations
|
Pascal Goffin, Wesley Willett, Jean-Daniel Fekete, Petra Isenberg
|
2014
|
View Paper |
How many participants are really enough for usability studies?
|
Roobaea Alroobaea, P. Mayhew
|
2014
|
View Paper |
Word Knowledge in a Theory of Reading Comprehension
|
C. Perfetti, J. Stafura
|
2014
|
View Paper |
A Multi-Level Typology of Abstract Visualization Tasks
|
M. Brehmer, T. Munzner
|
2013
|
View Paper |
A Systematic Review on the Practice of Evaluating Visualization
|
Tobias Isenberg, Petra Isenberg, Jing Chen, M. Sedlmair, Torsten Möller
|
2013
|
View Paper |
User-adaptive information visualization: using eye gaze data to infer visualization tasks and user cognitive abilities
|
Ben Steichen, G. Carenini, C. Conati
|
2013
|
View Paper |
The Generalized Sensitivity Scatterplot
|
Yu-Hsuan Chan, Carlos D. Correa, K. Ma
|
2013
|
View Paper |
RelEx: Visualization for Actively Changing Overlay Network Specifications
|
M. Sedlmair, Annika Frank, T. Munzner, A. Butz
|
2012
|
View Paper |
Towards a 3-dimensional model of individual cognitive differences: position paper
|
Evan M. Peck, B. Yuksel, Lane Harrison, Alvitta Ottley, Remco Chang
|
2012
|
View Paper |
Empirical Studies in Information Visualization: Seven Scenarios
|
Heidi Lam, E. Bertini, Petra Isenberg, C. Plaisant, Sheelagh Carpendale
|
2012
|
View Paper |
Reconstructing Readability: Recent Developments and Recommendations in the Analysis of Text Difficulty
|
Rebekah George Benjamin
|
2012
|
View Paper |
The Cognitive Science of Visual-Spatial Displays: Implications for Design
|
M. Hegarty
|
2011
|
View Paper |
GeneaQuilts: A System for Exploring Large Genealogies
|
A. Bezerianos, Pierre Dragicevic, Jean-Daniel Fekete, Juhee Bae, Benjamin Watson
|
2010
|
View Paper |
Semiology of Graphics - Diagrams, Networks, Maps
|
Jacques Bertin, William J. Berg
|
2010
|
View Paper |
Improving the Readability of Clustered Social Networks using Node Duplication
|
N. Riche, A. Bezerianos, Jean-Daniel Fekete
|
2008
|
View Paper |
Visualizing Changes of Hierarchical Data using Treemaps
|
Ying Tu, Han-Wei Shen
|
2007
|
View Paper |
Visualization Criticism - The Missing Link Between Information Visualization and Art
|
Robert Kosara
|
2007
|
View Paper |
Research Synthesis: The Practice of Cognitive Interviewing
|
P. Beatty, G. Willis
|
2007
|
View Paper |
The Aesthetics of Graph Visualization
|
C. Bennett, Jody Ryall, Leo Spalteholz, A. Gooch
|
2007
|
View Paper |
A Radial Adaptation of the Sugiyama Framework for Visualizing Hierarchical Information
|
C. Bachmaier
|
2007
|
View Paper |
Measuring personality in one minute or less: A 10-item short version of the Big Five Inventory in English and German
|
Beatrice Rammstedt, O. John
|
2007
|
View Paper |
Toward a Comprehensive Model of Graph Comprehension: Making the Case for Spatial Cognition
|
S. Trickett, J. Gregory Trafton
|
2006
|
View Paper |
Low-level components of analytic activity in information visualization
|
R. Amar, James R. Eagan, J. Stasko
|
2005
|
View Paper |
Best practices in exploratory factor analysis: four recommendations for getting the most from your analysis.
|
Anna Costello, J. Osborne
|
2005
|
View Paper |
The Comprehension of Quantitative Information in Graphical Displays.
|
P. Shah, E. Freedman, Ioanna Vekiri
|
2005
|
View Paper |
On the Readability of Graphs Using Node-Link and Matrix-Based Representations: A Controlled Experiment and Statistical Analysis
|
M. Ghoniem, Jean-Daniel Fekete, P. Castagliola
|
2005
|
View Paper |
On the Road to Graphicacy: The learning of graphical representation systems
|
Yolanda Postigo *, J. Pozo
|
2004
|
View Paper |
Text Coherence and Readability
|
B. Meyer
|
2003
|
View Paper |
Metrics for Graph Drawing Aesthetics
|
H. Purchase
|
2002
|
View Paper |
Cognitive Measurements of Graph Aesthetics
|
C. Ware, H. Purchase, Linda Colpoys, Matthew J. McGill
|
2002
|
View Paper |
Toward a Model of Knowledge-Based Graph Comprehension
|
E. Freedman, P. Shah
|
2002
|
View Paper |
Making sense of graphs: Critical factors influencing comprehension and instructional implications.
|
Susan N. Friel, Frances R. Curcio, G. Bright
|
2001
|
View Paper |
Evaluating the use of exploratory factor analysis in psychological research.
|
L. Fabrigar, D. Wegener, R. Maccallum, E. Strahan
|
1999
|
View Paper |
An algorithm for suffix stripping
|
M. Porter
|
1997
|
View Paper |
Metrics for effective information visualization
|
R. Brath
|
1997
|
View Paper |
Scale Development: Theory and Applications.
|
Yu-ping Xie, R. Devellis
|
1992
|
View Paper |
Understanding charts and graphs
|
S. Kosslyn
|
1989
|
View Paper |
Comprehension of Mathematical Relationships Expressed in Graphs.
|
Frances R. Curcio
|
1987
|
View Paper |
An Information-Processing Analysis of Graph Perception
|
David K. Simkin, R. Hastie
|
1987
|
View Paper |
Automating the design of graphical presentations of relational information
|
J. Mackinlay
|
1986
|
View Paper |
Graphical Perception: Theory, Experimentation, and Application to the Development of Graphical Methods
|
W. Cleveland, R. McGill
|
1984
|
View Paper |
Readability
|
2019
|
View Paper | |
VLAT: Development of a Visualization Literacy Assessment Test
|
Sukwon Lee, Sung-Hee Kim, Bum Chul Kwon
|
2017
|
View Paper |
Readability and Precision in Pictorial Bar Charts
|
Drew Skau, Robert Kosara
|
2017
|
View Paper |
Exploratory Factor Analysis ; Concepts and Theory
|
Hamed Taherdoost, S. Sahibuddin, N. Jalaliyoon
|
2014
|
View Paper |
The linguistic assumptions underlying read-ability formulae: A critique
|
2001
|
||
Cutoff criteria for fit indexes in covariance structure analysis : Conventional criteria versus new alternatives
|
Li-tze Hu, P. Bentler
|
1999
|
View Paper |
Readings in information visualization - using vision to think
|
S. Card, J. Mackinlay, B. Shneiderman
|
1999
|
View Paper |
FROM IMPRESSIONS TO DATA: INCREASING THE OBJECTIVITY OF COGNITIVE INTERVIEWS
|
F. Conrad
|
1996
|
View Paper |
Constructingvalidity: Basicissuesinobjective scale development
|
1995
|
||
A theory of graph comprehension.
|
S. Pinker
|
1990
|
View Paper |
Atestofmissingcompletelyatrandomformultivariatedatawith missing values
|
1988
|
||
Pondering the reading of visual representations, 2023
|
|||
Position paper: A case to study the relationship between data visualization readability and visualization literacy
|
|||
Ieee Transactions on Visualization and Computer Graphics Attention and Visual Memory in Visualization and Computer Graphics
|
C. Healey, J. Enns
|
View Paper | |
Interactive visualization literacy: Authorized licensed use limited to the terms of the applicable license agreement with
|
Showing first page preview. Click "Open Full PDF" to view the complete paper.
Your comment contains inappropriate language and has been rejected.
Are you sure you want to remove this tag? This action cannot be undone.
Someone just favorited a paper!
Comments (0)