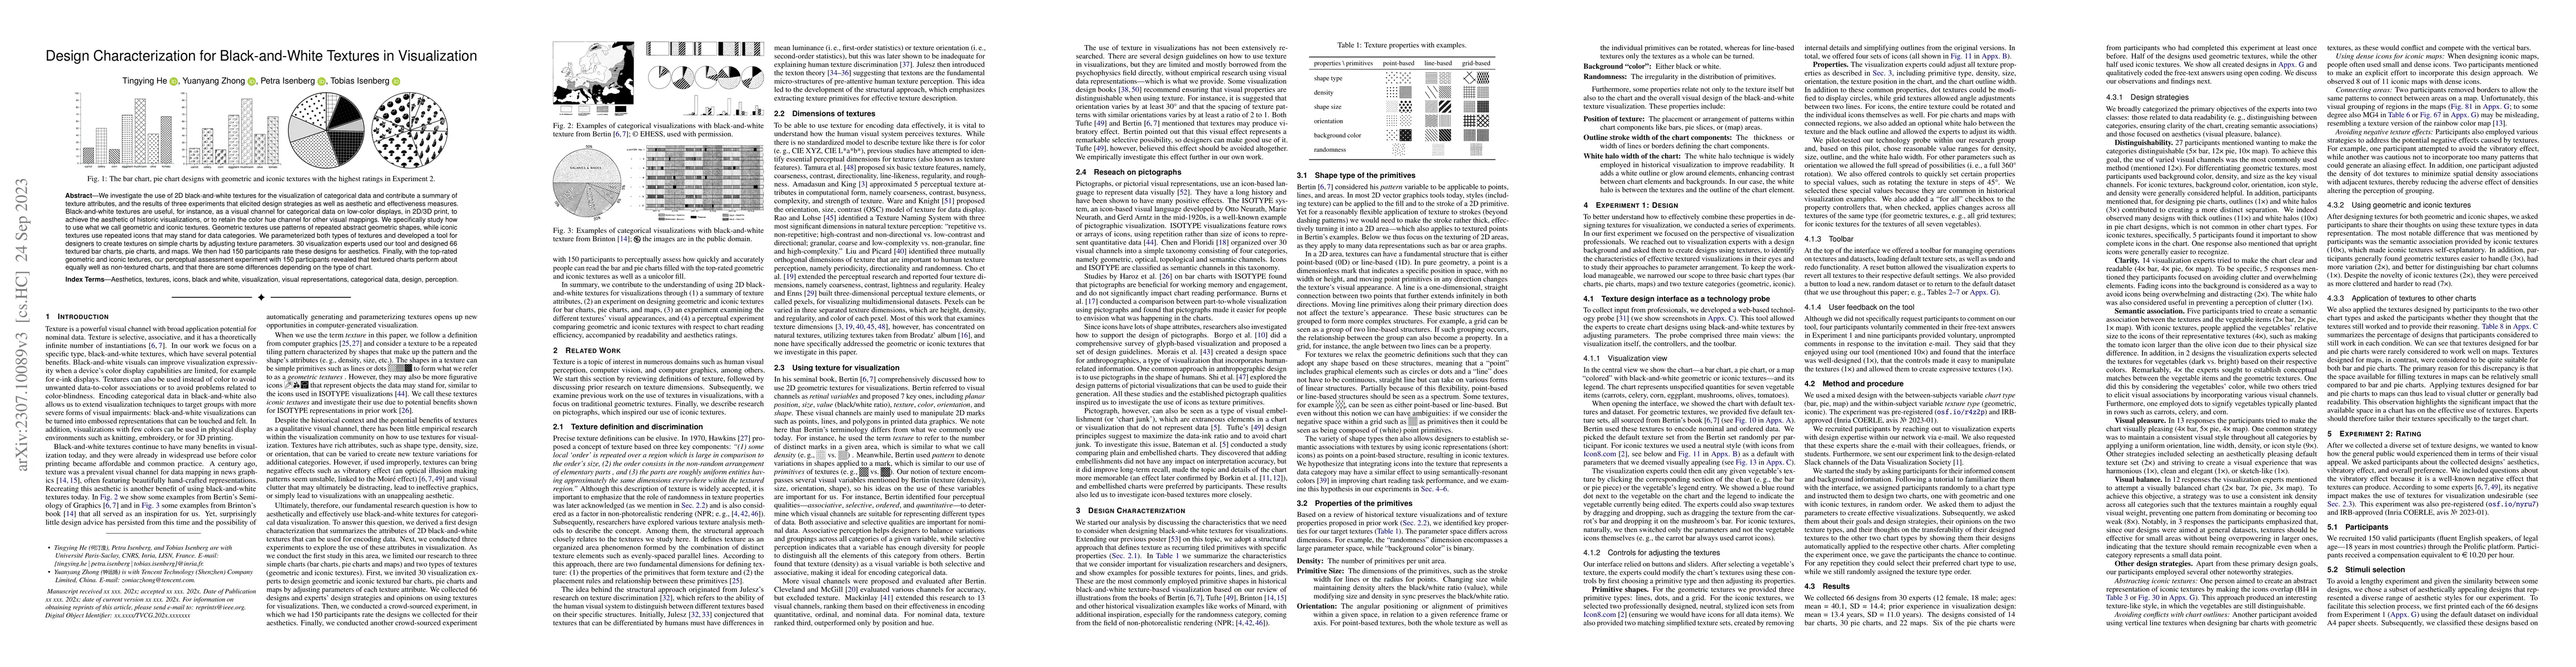
Design Characterization for Black-and-White Textures in Visualization
Publication
Metrics
AI Quick Summary
This research explores the use of black-and-white textures in visualizing categorical data, evaluating geometric and iconic textures through design strategies and perceptual assessments. Experiments with visualization experts and participants found that textured charts are as effective as non-textured ones, though effectiveness varies by chart type.
Paper Preview
Abstract
We investigate the use of 2D black-and-white textures for the visualization of categorical data and contribute a summary of texture attributes, and the results of three experiments that elicited design strategies as well as aesthetic and effectiveness measures. Black-and-white textures are useful, for instance, as a visual channel for categorical data on low-color displays, in 2D/3D print, to achieve the aesthetic of historic visualizations, or to retain the color hue channel for other visual mappings. We specifically study how to use what we call geometric and iconic textures. Geometric textures use patterns of repeated abstract geometric shapes, while iconic textures use repeated icons that may stand for data categories. We parameterized both types of textures and developed a tool for designers to create textures on simple charts by adjusting texture parameters. 30 visualization experts used our tool and designed 66 textured bar charts, pie charts, and maps. We then had 150 participants rate these designs for aesthetics. Finally, with the top-rated geometric and iconic textures, our perceptual assessment experiment with 150 participants revealed that textured charts perform about equally well as non-textured charts, and that there are some differences depending on the type of chart.
AI Key Findings
Get AI-generated insights about this paper's methodology, results, significance, and more — seven facets brought into focus.
Impact
Paper Details
Authors
PDF Preview
Key Terms
Citation Network
Current paper (gray), citations (green), references (blue)
Display is limited for performance on very large graphs.
Discussion 0