Quick Summary:

The BeauVis scale is a newly developed and validated instrument to measure the aesthetic pleasure of visual data representations. It consists of five items: "enjoyable," "likable," "pleasing," "nice," and "appealing," and aims to provide researchers with a standardized tool for comparing visualization aesthetics independently of data or context.

Summary

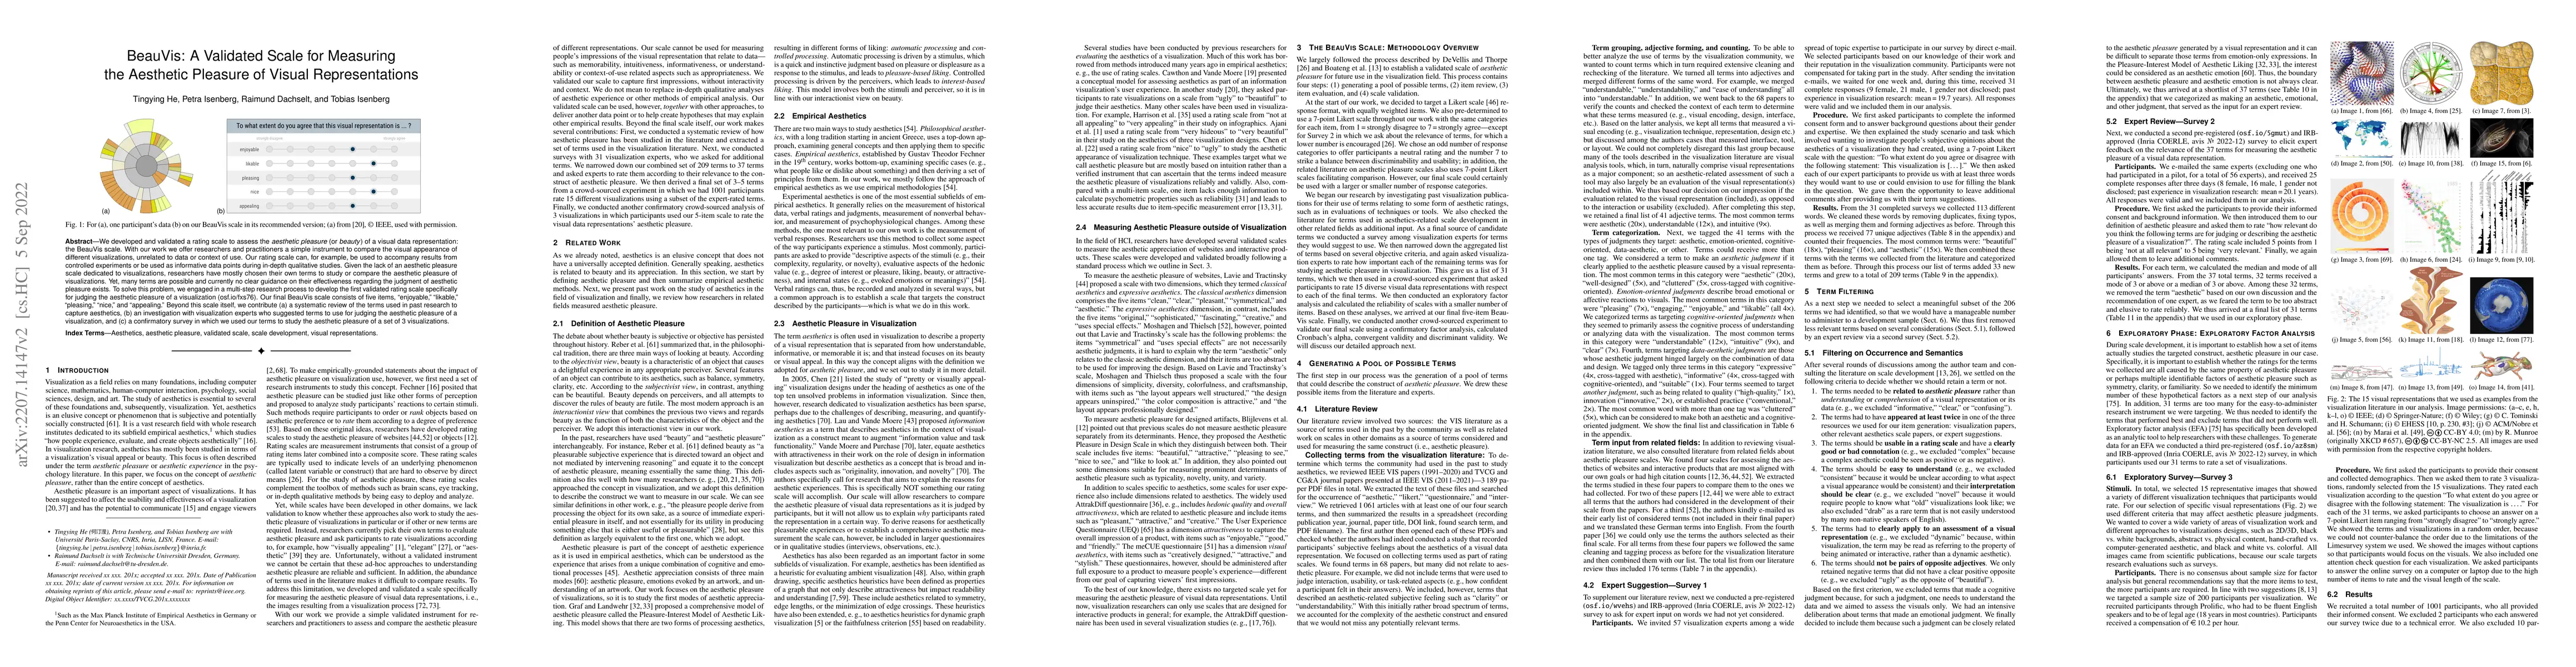
We developed and validated a rating scale to assess the aesthetic pleasure (or beauty) of a visual data representation: the BeauVis scale. With our work we offer researchers and practitioners a simple instrument to compare the visual appearance of different visualizations, unrelated to data or context of use. Our rating scale can, for example, be used to accompany results from controlled experiments or be used as informative data points during in-depth qualitative studies. Given the lack of an aesthetic pleasure scale dedicated to visualizations, researchers have mostly chosen their own terms to study or compare the aesthetic pleasure of visualizations. Yet, many terms are possible and currently no clear guidance on their effectiveness regarding the judgment of aesthetic pleasure exists. To solve this problem, we engaged in a multi-step research process to develop the first validated rating scale specifically for judging the aesthetic pleasure of a visualization (osf.io/fxs76). Our final BeauVis scale consists of five items, "enjoyable," "likable," "pleasing," "nice," and "appealing." Beyond this scale itself, we contribute (a) a systematic review of the terms used in past research to capture aesthetics, (b) an investigation with visualization experts who suggested terms to use for judging the aesthetic pleasure of a visualization, and (c) a confirmatory survey in which we used our terms to study the aesthetic pleasure of a set of 3 visualizations.

AI Key Findings

Get AI-generated insights about this paper's methodology, results, and significance.

Paper Details

PDF Preview

Download PDF

Key Terms

visualization (0.300)
validated (0.241)
scale (0.235)
scale (0.229)
validated (0.227)
researchers (0.214)
researchers (0.209)
terms (0.205)
visual (0.197)
terms (0.194)
visual (0.189)
compare (0.165)
items (0.161)
compare (0.159)
used (0.159)
research (0.153)
research (0.153)
used (0.152)
practitioners (0.148)
guidance (0.146)

Citation Network

Current paper (gray), citations (green), references (blue)

Current Paper
Citations
References
Click to view
Title Authors Year Actions
Designing Semantically-Resonant Abstract Patterns for Data Visualization
Zihan Lu, Tingying He, Jia-Shun Hong, Lijie Yao, Tobias Isenberg
2025
View Paper
A Study of Visual Language Extraction From Uttarakhand’s Cultural and Natural Resources for Application in Ringaal Craft Design
Soumitra Bhattacharya, Naveen Kumar, Debkumar Chakrabarti
2025
View Paper
MAVIL: Design of a Multidimensional Assessment of Visual Data Literacy and its Application in a Representative Survey
Antonia Saske, T. Möller, Laura Koesten, Judith Staudner, Sylvia Kritzinger
2024
View Paper
Mind Drifts, Data Shifts: Utilizing Mind Wandering to Track the Evolution of User Experience with Data Visualizations
Anjana Arunkumar, L. Padilla, C. Bryan
2024
View Paper
User Experience of Visualizations in Motion: A Case Study and Design Considerations
Lijie Yao, Federica Bucchieri, Victoria McArthur, A. Bezerianos, Petra Isenberg
2024
View Paper
PREVis: Perceived Readability Evaluation for Visualizations
Anne-Flore Cabouat, Tingying He, Petra Isenberg, Tobias Isenberg
2024
View Paper
Investigating the Role of Interactivity for the Aesthetic Pleasure of Information Visualization
Elena Stoll, Benjamin Ost, Dietrich Kammer
2024
View Paper
A Chinese Version of the Aesthetics Scale: Cultural Adaptation and Psychological Measurement
Xinyun Deng, Yuhui Wang, Jiayu Su, Zhirong Li
2024
View Paper
Tensions between Preference and Performance: Designing for Visual Exploration of Multi-frequency Medical Network Data
Christian Knoll, Laura Koesten, I. Rigoni, Serge Vulliémoz, T. Möller
2024
View Paper
An Image-based Typology for Visualization
Jian Chen, Petra Isenberg, R. Laramee, Tobias Isenberg, Michael Sedlmair, Torsten Moeller, Rui Li
2024
View Paper
Cieran: Designing Sequential Colormaps via In-Situ Active Preference Learning
Matt-Heun Hong, Zachary Sunberg, D. Szafir
2024
View Paper
Data Embroidery with Black-and-White Textures
Tingying He, Petra Isenberg, Tobias Isenberg
2023
View Paper
A Heuristic Approach for Dual Expert/End-User Evaluation of Guidance in Visual Analytics
D. Ceneda, C. Collins, Mennatallah El-Assady, S. Miksch, C. Tominski, Alessio Arleo
2023
View Paper
Image or Information? Examining the Nature and Impact of Visualization Perceptual Classification
Anjana Arunkumar, Lace M. K. Padilla, Gi-Yeul Bae, Chris Bryan
2023
View Paper
Design Characterization for Black-and-White Textures in Visualization
Tingying He, Yuanyang Zhong, Petra Isenberg, Tobias Isenberg
2023
View Paper
Doom or Deliciousness: Challenges and Opportunities for Visualization in the Age of Generative Models
V. Schetinger, Sara Di Bartolomeo, Mennatallah El-Assady, A. Mcnutt, M. Miller, J. P. A. Passos, J. L. Adams
2023
View Paper
What is the message? Perspectives on Visual Data Communication
Laura Koesten, Kathleen Gregory, Regina Schuster, Christian Knoll, Sarah Davies, T. Möller
2023
View Paper

Comments (0)

This website uses cookies to ensure you get the best experience. Learn more