Publication
Metrics
AI Quick Summary
This paper investigates visual ensemble analysis techniques to compare nine CO2 injection simulations in porous media, finding that a machine-learning based similarity metric yields the best visualization results. The study employs dimensionality reduction and space-time cube volume rendering to provide insights into simulation rankings and gravity finger development compared to experimental data.
Paper Preview
Abstract
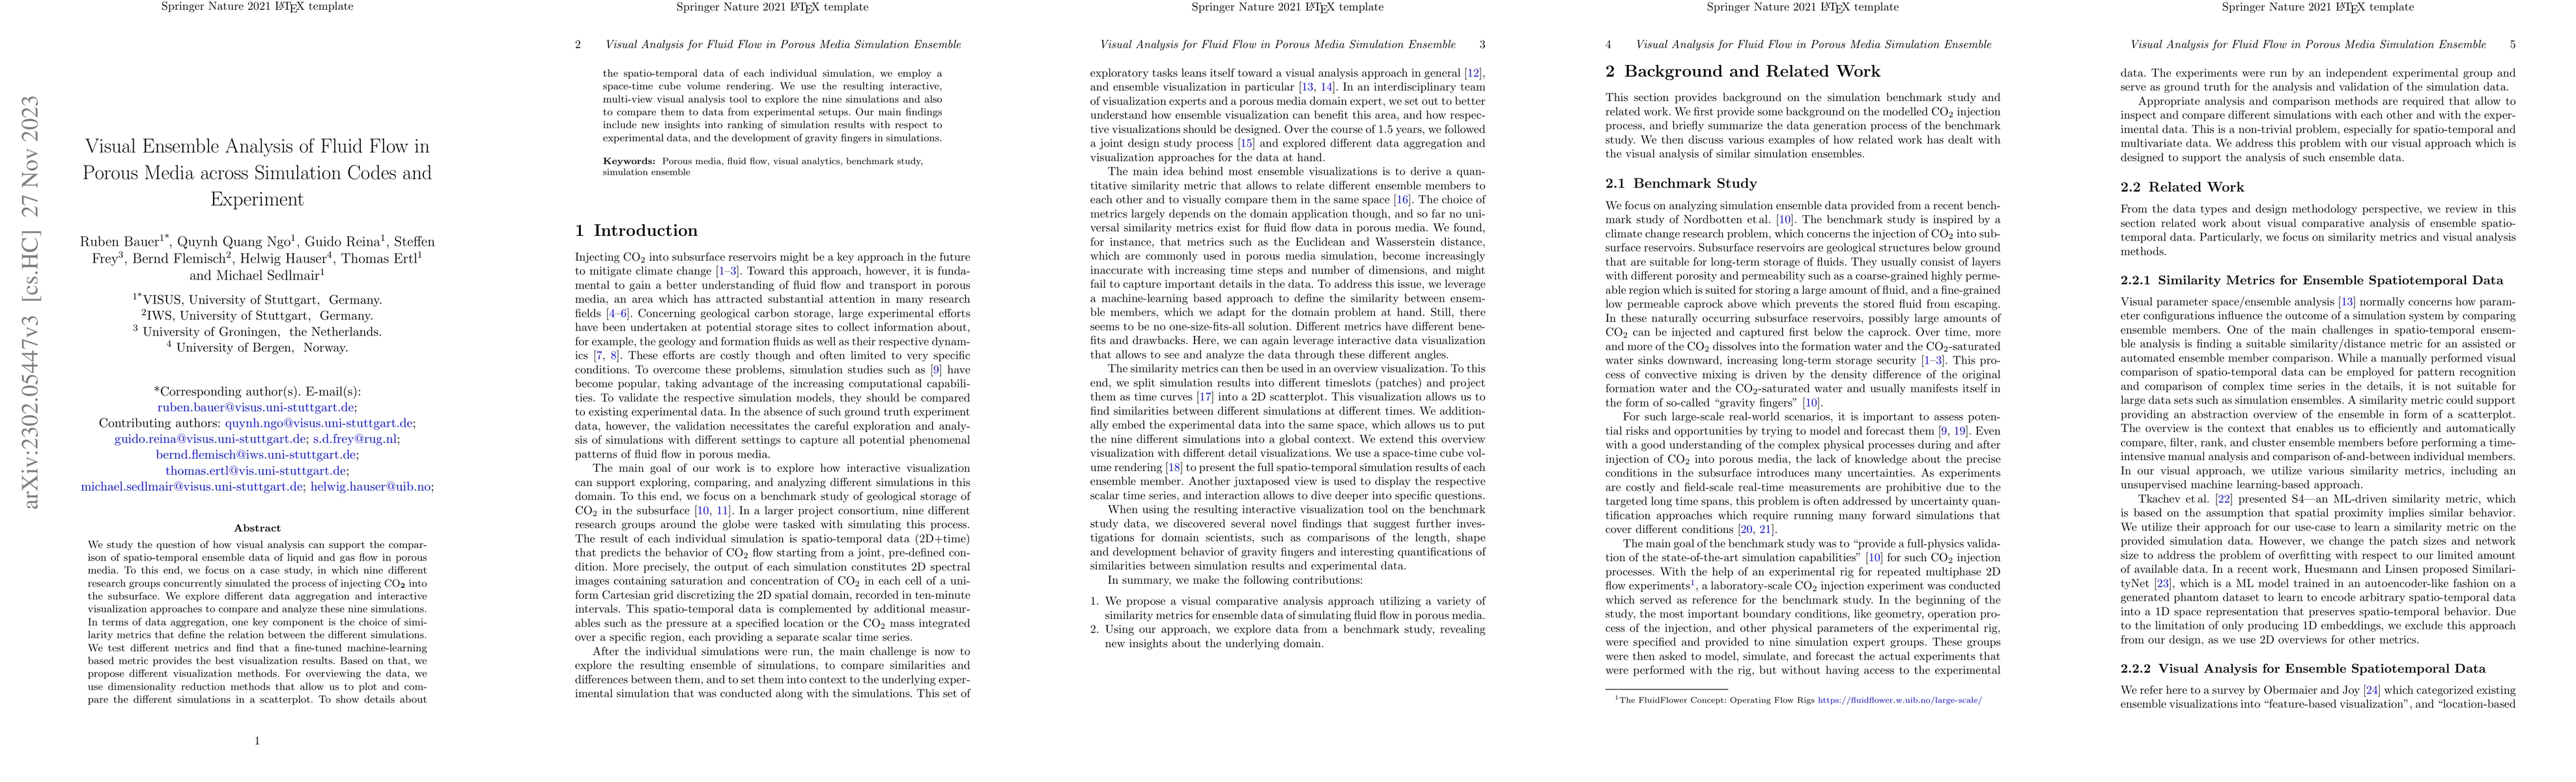
We study the question of how visual analysis can support the comparison of spatio-temporal ensemble data of liquid and gas flow in porous media. To this end, we focus on a case study, in which nine different research groups concurrently simulated the process of injecting CO2 into the subsurface. We explore different data aggregation and interactive visualization approaches to compare and analyze these nine simulations. In terms of data aggregation, one key component is the choice of similarity metrics that define the relation between the different simulations. We test different metrics and find that a fine-tuned machine-learning based metric provides the best visualization results. Based on that, we propose different visualization methods. For overviewing the data, we use dimensionality reduction methods that allow us to plot and compare the different simulations in a scatterplot. To show details about the spatio-temporal data of each individual simulation, we employ a space-time cube volume rendering. We use the resulting interactive, multi-view visual analysis tool to explore the nine simulations and also to compare them to data from experimental setups. Our main findings include new insights into ranking of simulation results with respect to experimental data, and the development of gravity fingers in simulations.
AI Key Findings
Get AI-generated insights about this paper's methodology, results, significance, and more — seven facets brought into focus.
Impact
Paper Details
Authors
PDF Preview
Key Terms
Citation Network
Current paper (gray), citations (green), references (blue)
Display is limited for performance on very large graphs.
Discussion 0