Visual Analysis of Displacement Processes in Porous Media using Spatio-Temporal Flow Graphs
Publication
Metrics
AI Quick Summary
This paper introduces a novel visualization method using spatio-temporal flow graphs to analyze displacement processes in porous media. The approach condenses experimental image series into time maps and generates simplified graphs to reflect topological changes, enabling interactive visual analysis and comparison of ensemble datasets.
Paper Preview
Abstract
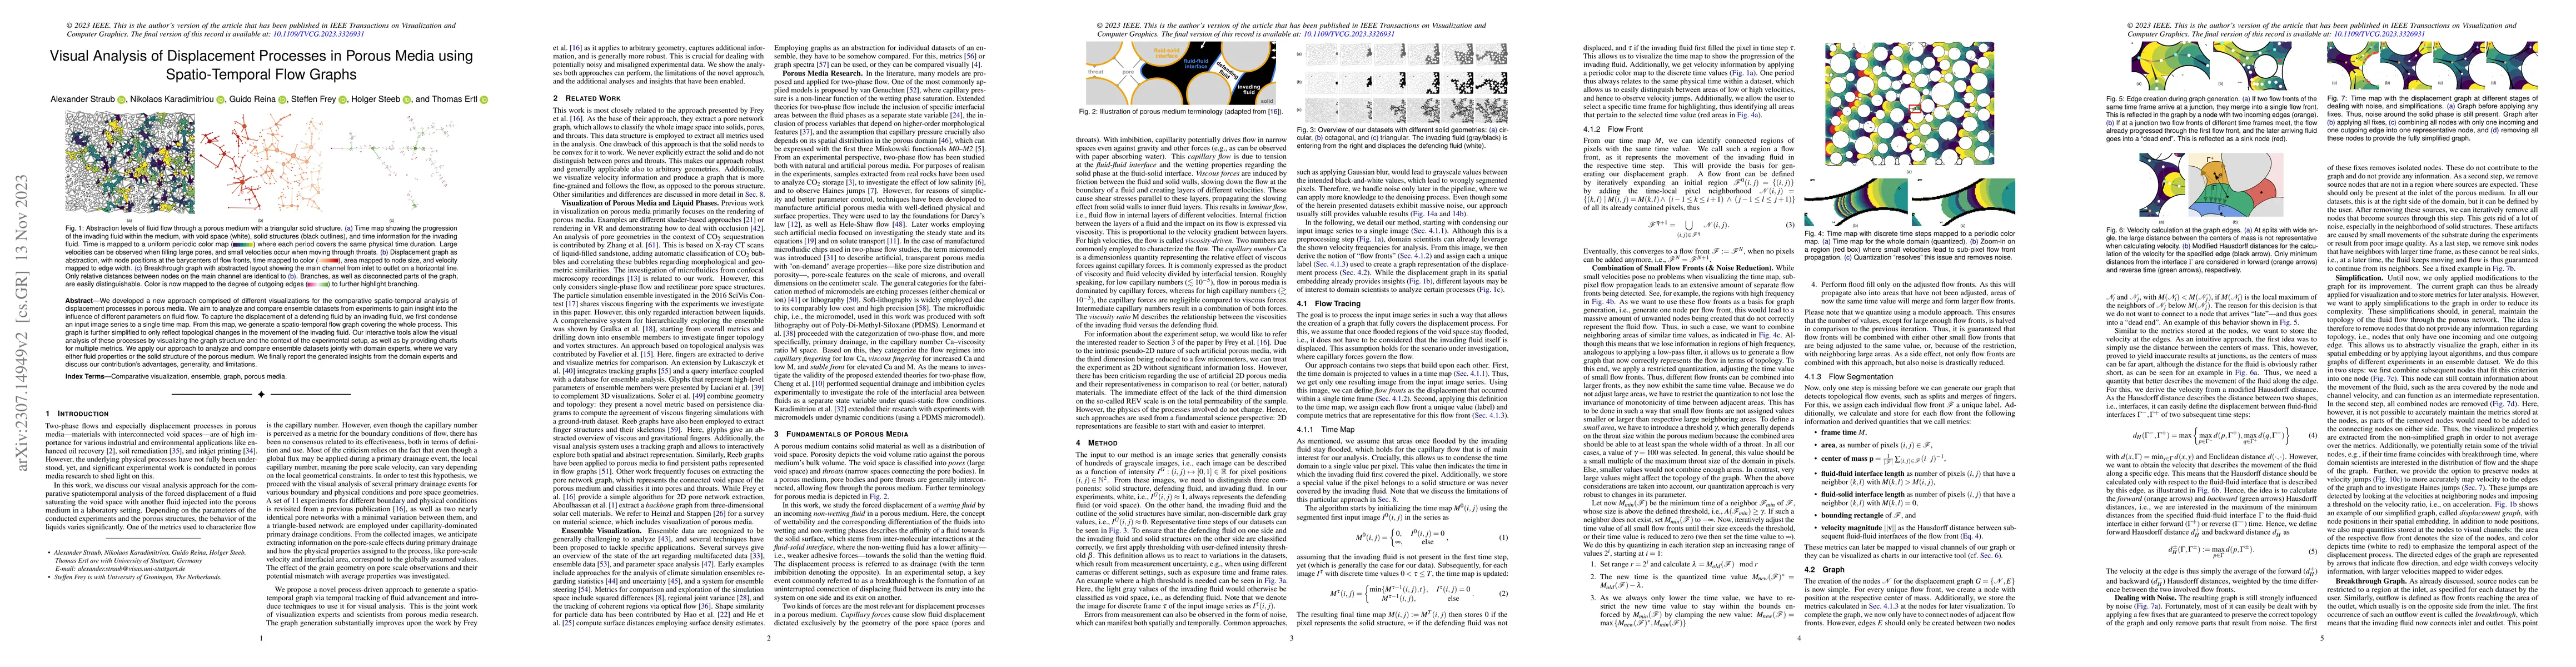
We developed a new approach comprised of different visualizations for the comparative spatio-temporal analysis of displacement processes in porous media. We aim to analyze and compare ensemble datasets from experiments to gain insight into the influence of different parameters on fluid flow. To capture the displacement of a defending fluid by an invading fluid, we first condense an input image series to a single time map. From this map, we generate a spatio-temporal flow graph covering the whole process. This graph is further simplified to only reflect topological changes in the movement of the invading fluid. Our interactive tools allow the visual analysis of these processes by visualizing the graph structure and the context of the experimental setup, as well as by providing charts for multiple metrics. We apply our approach to analyze and compare ensemble datasets jointly with domain experts, where we vary either fluid properties or the solid structure of the porous medium. We finally report the generated insights from the domain experts and discuss our contribution's advantages, generality, and limitations.
AI Key Findings
Get AI-generated insights about this paper's methodology, results, significance, and more — seven facets brought into focus.
Impact
Paper Details
Authors
PDF Preview
Key Terms
Citation Network
Current paper (gray), citations (green), references (blue)
Display is limited for performance on very large graphs.
Discussion 0