This paper introduces a conceptual model for scalability in visualization research, analyzing over 120 publications to identify inconsistencies in the term's usage. It proposes a consistent terminology and methodology to characterize scalability, aiming to improve comparisons and reproducibility among visualization techniques.
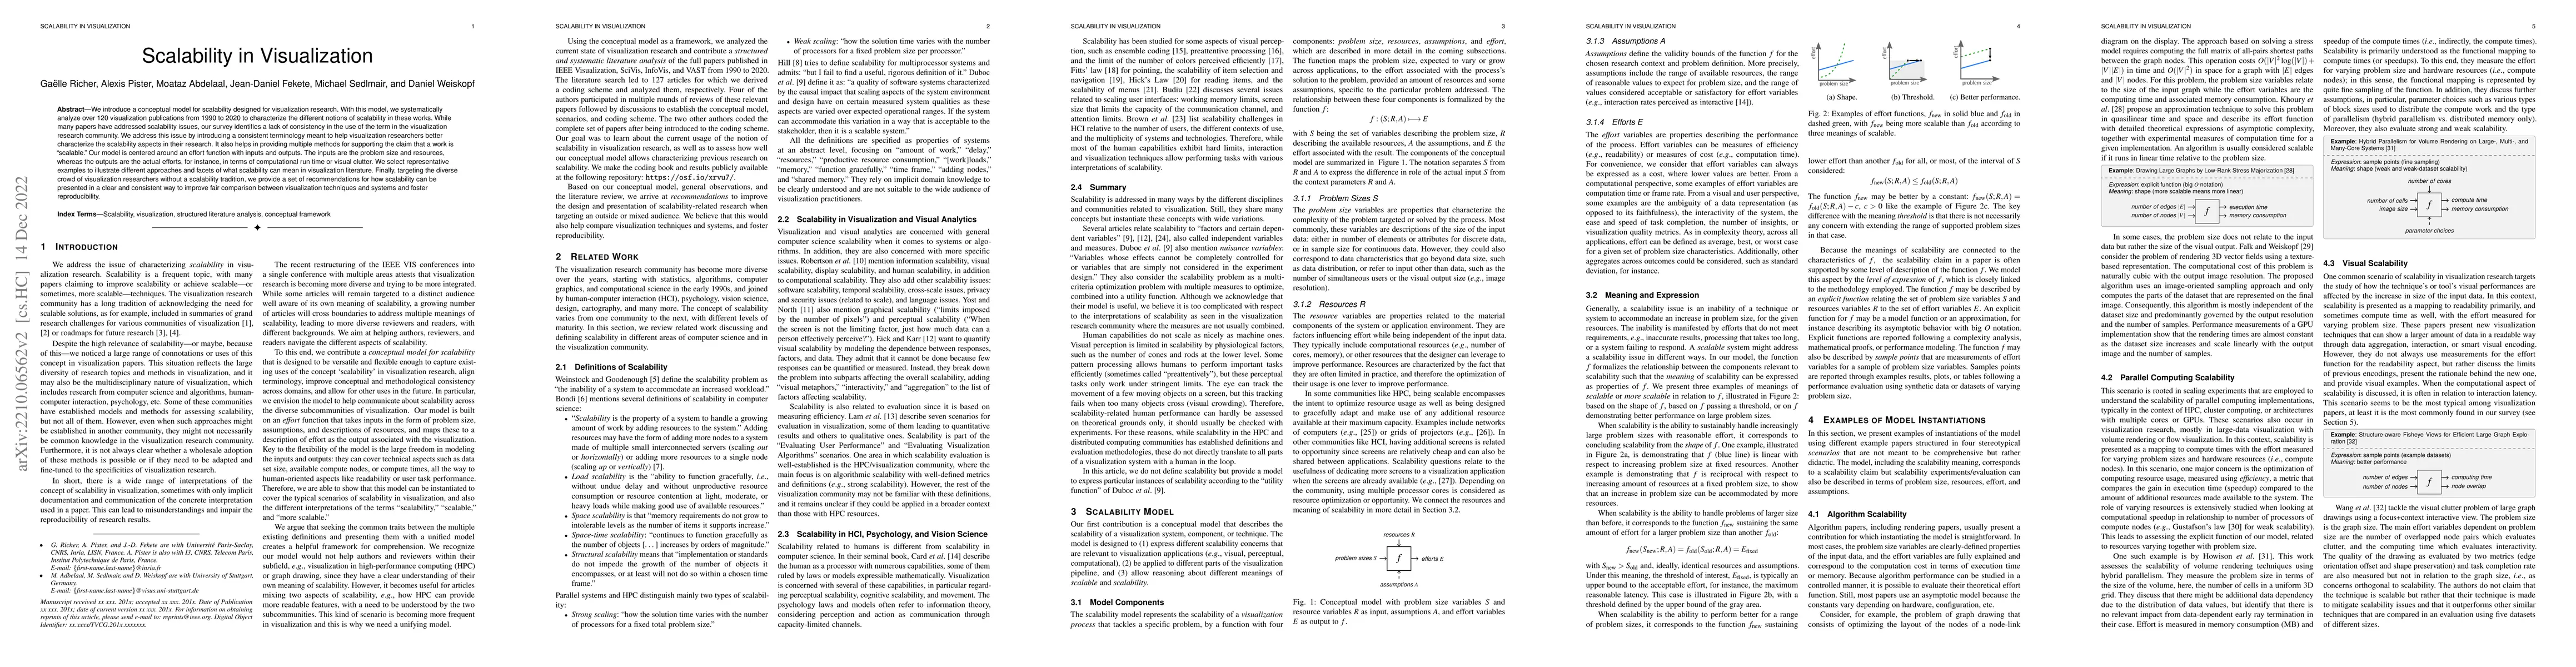
We introduce a conceptual model for scalability designed for visualization research. With this model, we systematically analyze over 120 visualization publications from 1990-2020 to characterize the different notions of scalability in these works. While many papers have addressed scalability issues, our survey identifies a lack of consistency in the use of the term in the visualization research community. We address this issue by introducing a consistent terminology meant to help visualization researchers better characterize the scalability aspects in their research. It also helps in providing multiple methods for supporting the claim that a work is "scalable". Our model is centered around an effort function with inputs and outputs. The inputs are the problem size and resources, whereas the outputs are the actual efforts, for instance, in terms of computational run time or visual clutter. We select representative examples to illustrate different approaches and facets of what scalability can mean in visualization literature. Finally, targeting the diverse crowd of visualization researchers without a scalability tradition, we provide a set of recommendations for how scalability can be presented in a clear and consistent way to improve fair comparison between visualization techniques and systems and foster reproducibility.
This graph shows how this paper is connected to other research. The current paper is shown in dark gray, papers that cite it are in green, and papers it references are in blue. You can:
• Hover over any node to see the paper title
• Click a node to view that paper's details
• Drag nodes to rearrange the graph
• Use the zoom controls (bottom right) to zoom in/out
Title | Authors | Year | Actions |
---|---|---|---|
Exploring similarity patterns in a large scientific corpus
|
D. Witschard, Ilir Jusufi, Kostiantyn Kucher, A. Kerren
|
2025
|
View Paper |
Towards Visual Analytics for Explainable AI in Industrial Applications
|
Kostiantyn Kucher, E. Zohrevandi, Carl A. L. Westin
|
2025
|
View Paper |
Design and Implementation of a Dashboard System for Monitoring Key Performance Indicators in Digitalized Higher Education Institutions: A Case Study
|
Iskan Mustamir, Ahmad Nasikun, S. Wibirama
|
2024
|
View Paper |
UnDRground Tubes: Exploring Spatial Data with Multidimensional Projections and Set Visualization
|
Nikolaus Piccolotto, Mark Wallinger, Silvia Miksch, M. Bögl
|
2024
|
View Paper |
Out-of-Core Dimensionality Reduction for Large Data via Out-of-Sample Extensions
|
Luca Reichmann, David Hägele, Daniel Weiskopf
|
2024
|
View Paper |
Visual Analysis of Multi-Outcome Causal Graphs
|
Mengjie Fan, Jinlu Yu, D. Weiskopf, Nan Cao, Huai-Yu Wang, Liang Zhou
|
2024
|
View Paper |
BEMTrace: Visualization-Driven Approach for Deriving Building Energy Models from BIM
|
A. Walch, Attila Szabó, H. Steinlechner, Thomas Ortner, Eduard Gröller, Johanna Schmidt
|
2024
|
View Paper |
Nuwa: An Authoring Tool for Graph Visualizations
|
Dongming Han, Haiyang Zhu, Wei Chen, Jiacheng Pan, Ran Chen, Xumeng Wang, Zhen Wen, Luoxuan Weng, Minfeng Zhu, Yingcai Wu, Rüdiger Westermann
|
2024
|
View Paper |
Active Gaze Labeling: Visualization for Trust Building.
|
Maurice Koch, Nan Cao, D. Weiskopf, K. Kurzhals
|
2024
|
View Paper |
NMF-Based Analysis of Mobile Eye-Tracking Data
|
Daniel Klötzl, Tim Krake, Frank Heyen, Michael Becher, Maurice Koch, D. Weiskopf, K. Kurzhals
|
2024
|
View Paper |
From word clouds to Word Rain: Revisiting the classic word cloud to visualize climate change texts
|
Maria Skeppstedt, Magnus Ahltorp, Kostiantyn Kucher, Matts Lindström
|
2024
|
View Paper |
Visual Highlighting for Situated Brushing and Linking
|
Nina Doerr, Benjamin Lee, Katarina Baricova, Dieter Schmalstieg, Michael Sedlmair
|
2024
|
View Paper |
Big Data and Data Visualization Challenges
|
M. Muniswamaiah, T. Agerwala, C. Tappert
|
2023
|
View Paper |
Foundation Models Meet Visualizations: Challenges and Opportunities
|
Weikai Yang, Mengchen Liu, Zheng Wang, Shixia Liu
|
2023
|
View Paper |
Accelerated 2D visualization using adaptive resolution scaling and temporal reconstruction
|
M. Becher, Moritz Heinemann, Thomas Marmann, G. Reina, D. Weiskopf, T. Ertl
|
2023
|
View Paper |
Visualizing the recovery of patients in Critical Care Units
|
L. Stuart, Christopher Haynes, K. Tantam, R. Gardner, Marco A. Palomino
|
2023
|
View Paper |
RanViz: Ransomware Visualization and Classification Based on Time-Series Categorical Representation of API Calls
|
Vhuhwavho Mokoma, Avinash Singh
|
2025
|
View Paper |
Does Automation Scale? Notes From an HCI Perspective
|
T. Mentler, Nadine Flegel, Jonas Pöhler, Kristof Van Laerhoven
|
2023
|
View Paper |
Better Information Visualization Software Through Packages for Data Science Ecosystems
|
R. Henkin
|
2023
|
View Paper |
Wei Wei, Yvonne Jansen, Samuel Huron
Published: 2023-08-09
Comments (0)