Academic Profile
Statistics
Similar Authors
Papers on arXiv
The need to visualize large social networks is growing as hardware capabilities make analyzing large networks feasible and many new data sets become available. Unfortunately, the visualizations in e...
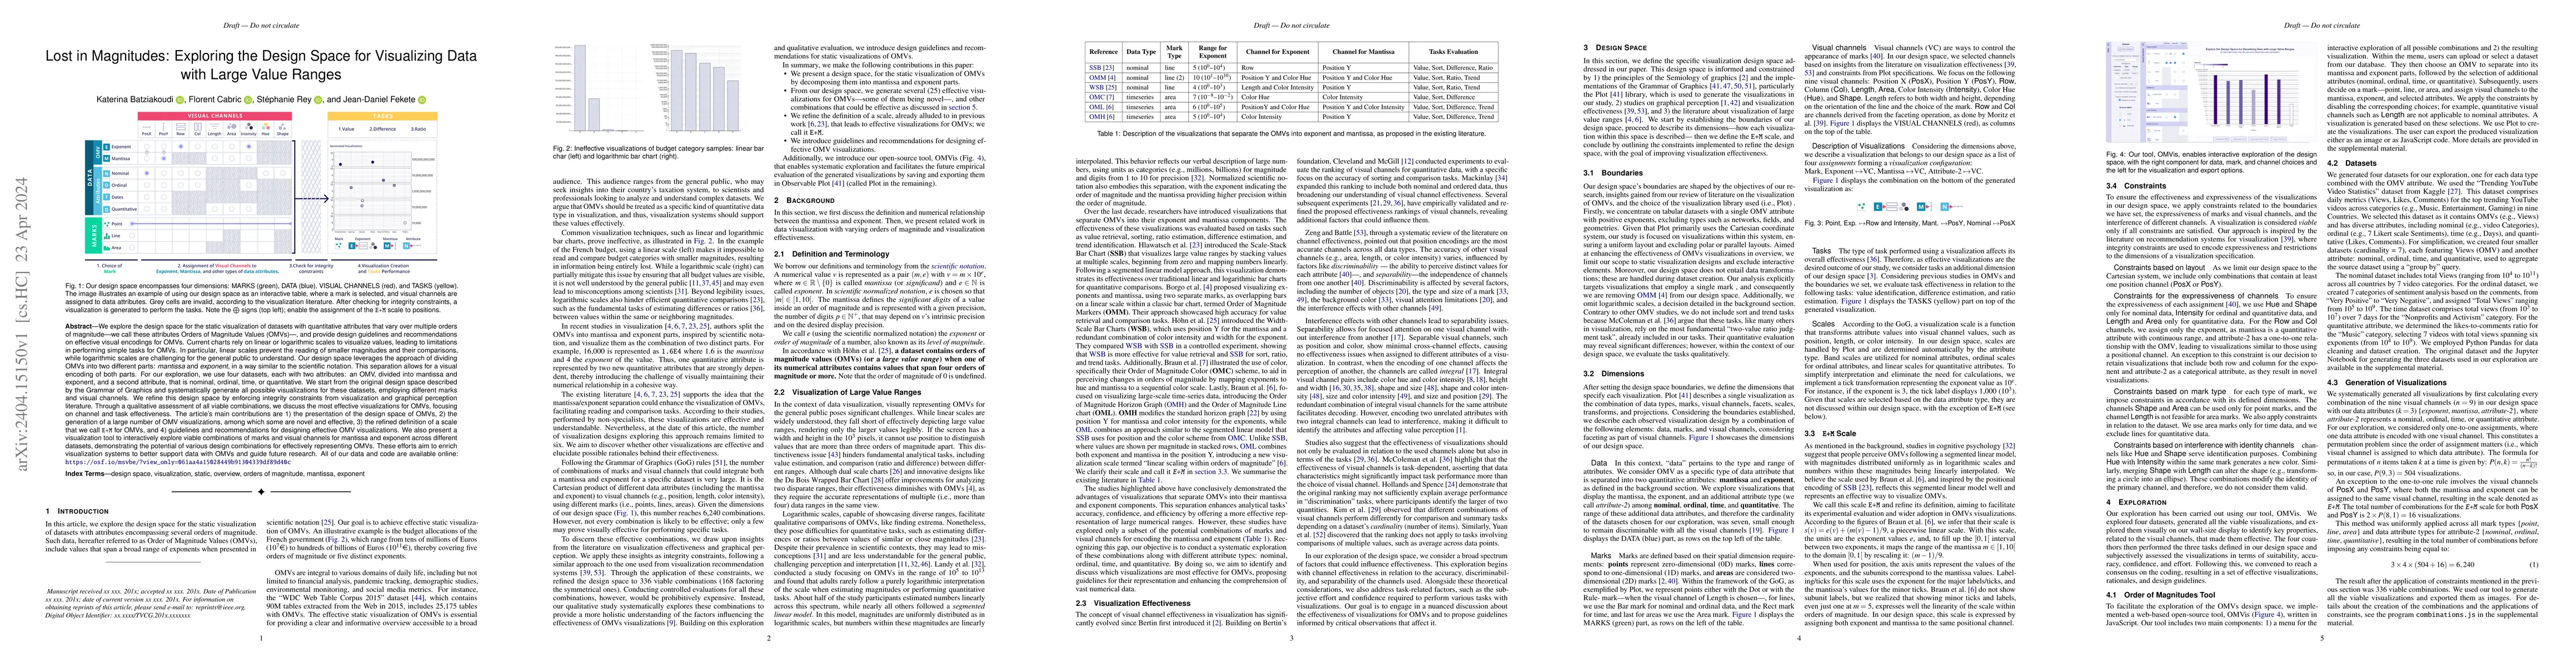
We explore the design space for the static visualization of datasets with quantitative attributes that vary over multiple orders of magnitude-we call these attributes Orders of Magnitude Values (OMV...
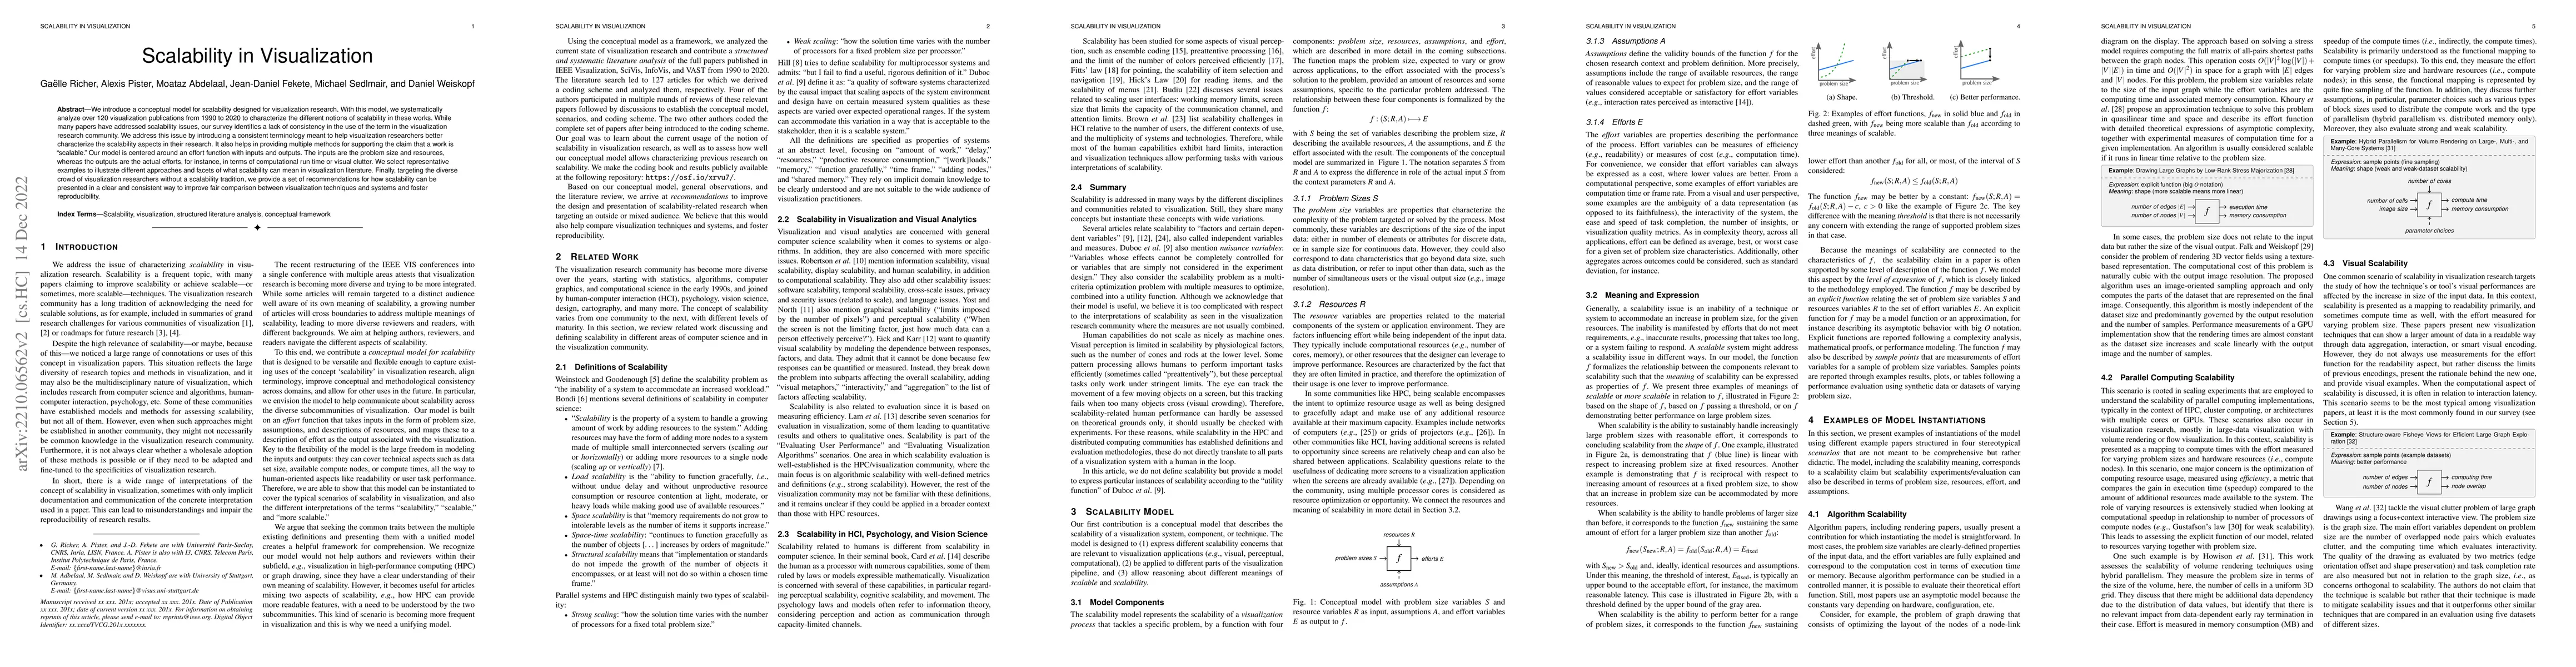
We introduce a conceptual model for scalability designed for visualization research. With this model, we systematically analyze over 120 visualization publications from 1990-2020 to characterize the...
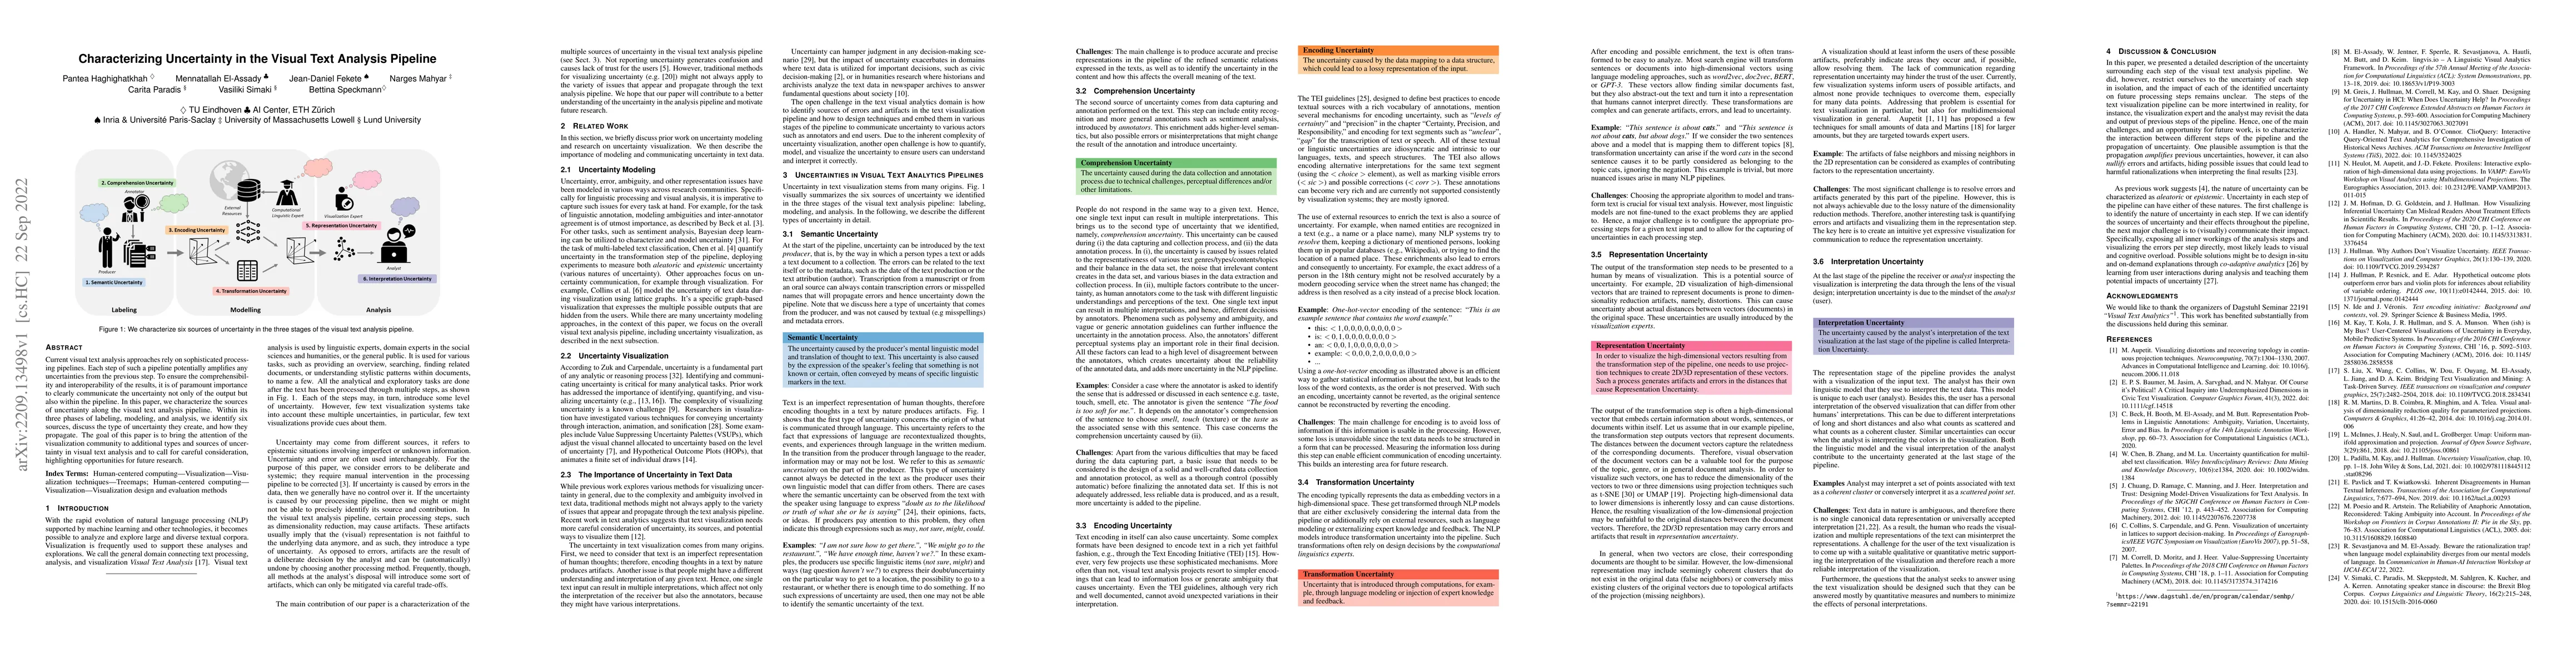
Current visual text analysis approaches rely on sophisticated processing pipelines. Each step of such a pipeline potentially amplifies any uncertainties from the previous step. To ensure the compreh...
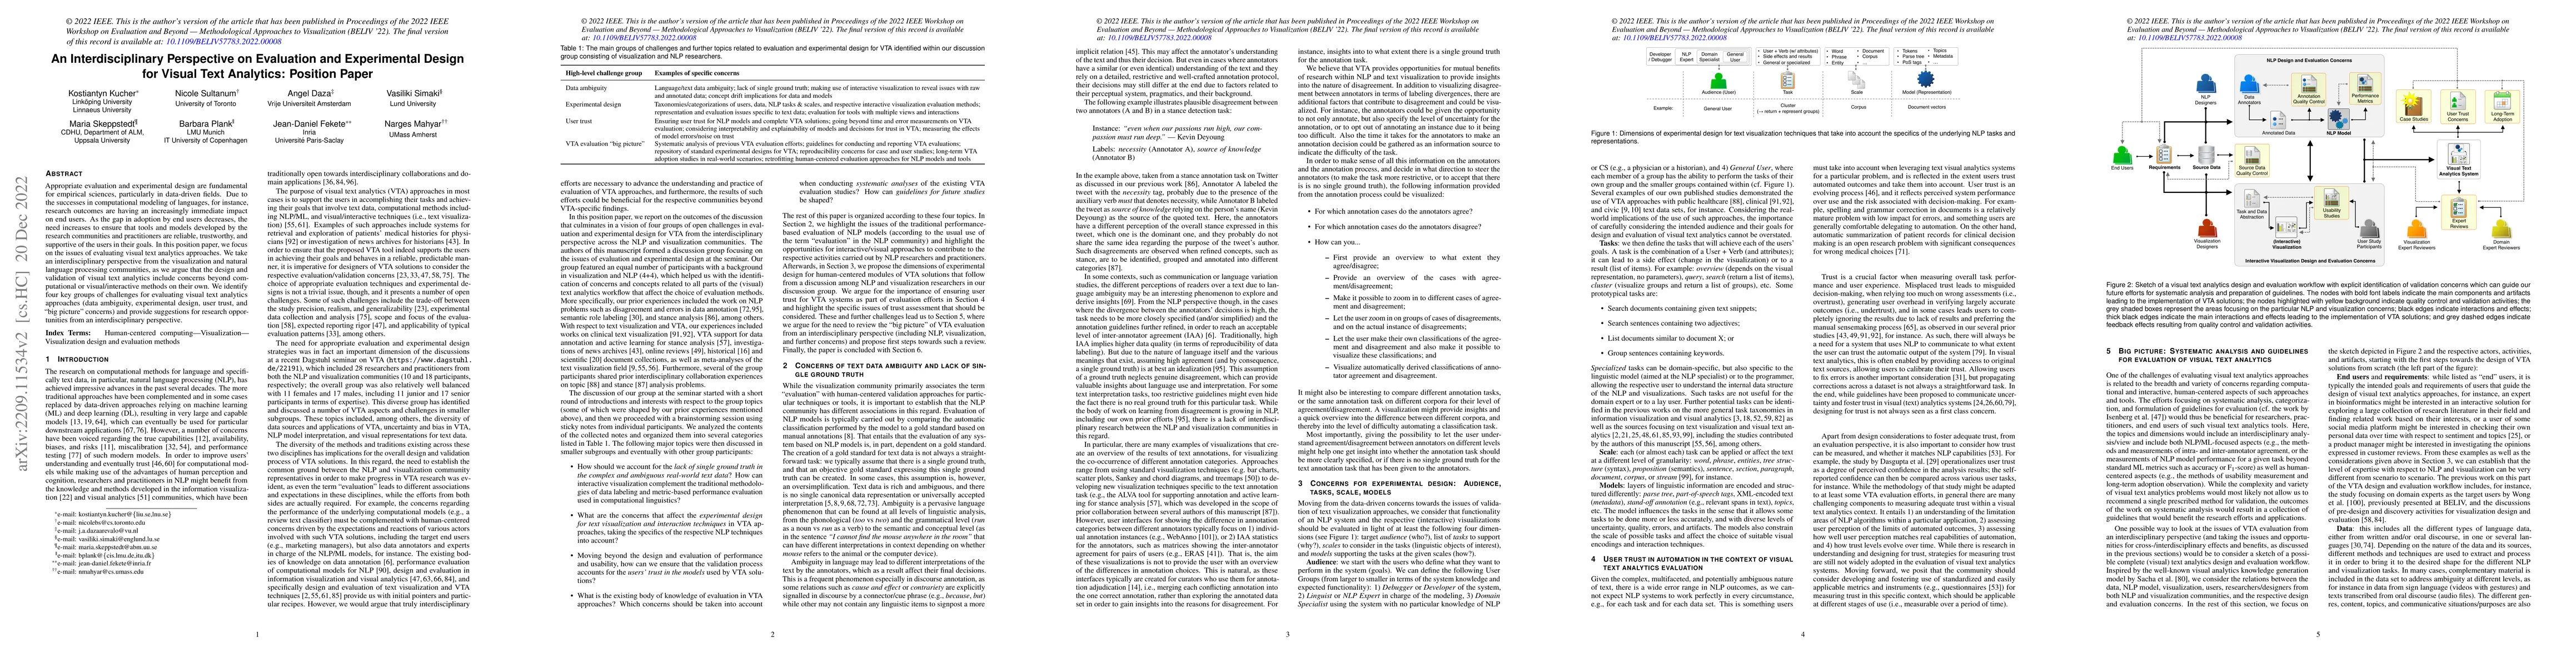
Appropriate evaluation and experimental design are fundamental for empirical sciences, particularly in data-driven fields. Due to the successes in computational modeling of languages, for instance, ...

Knowledge Graphs (KG) allow to merge and connect heterogeneous data despite their differences; they are incomplete by design. Yet, KG data producers need to ensure the best level of completeness, as...
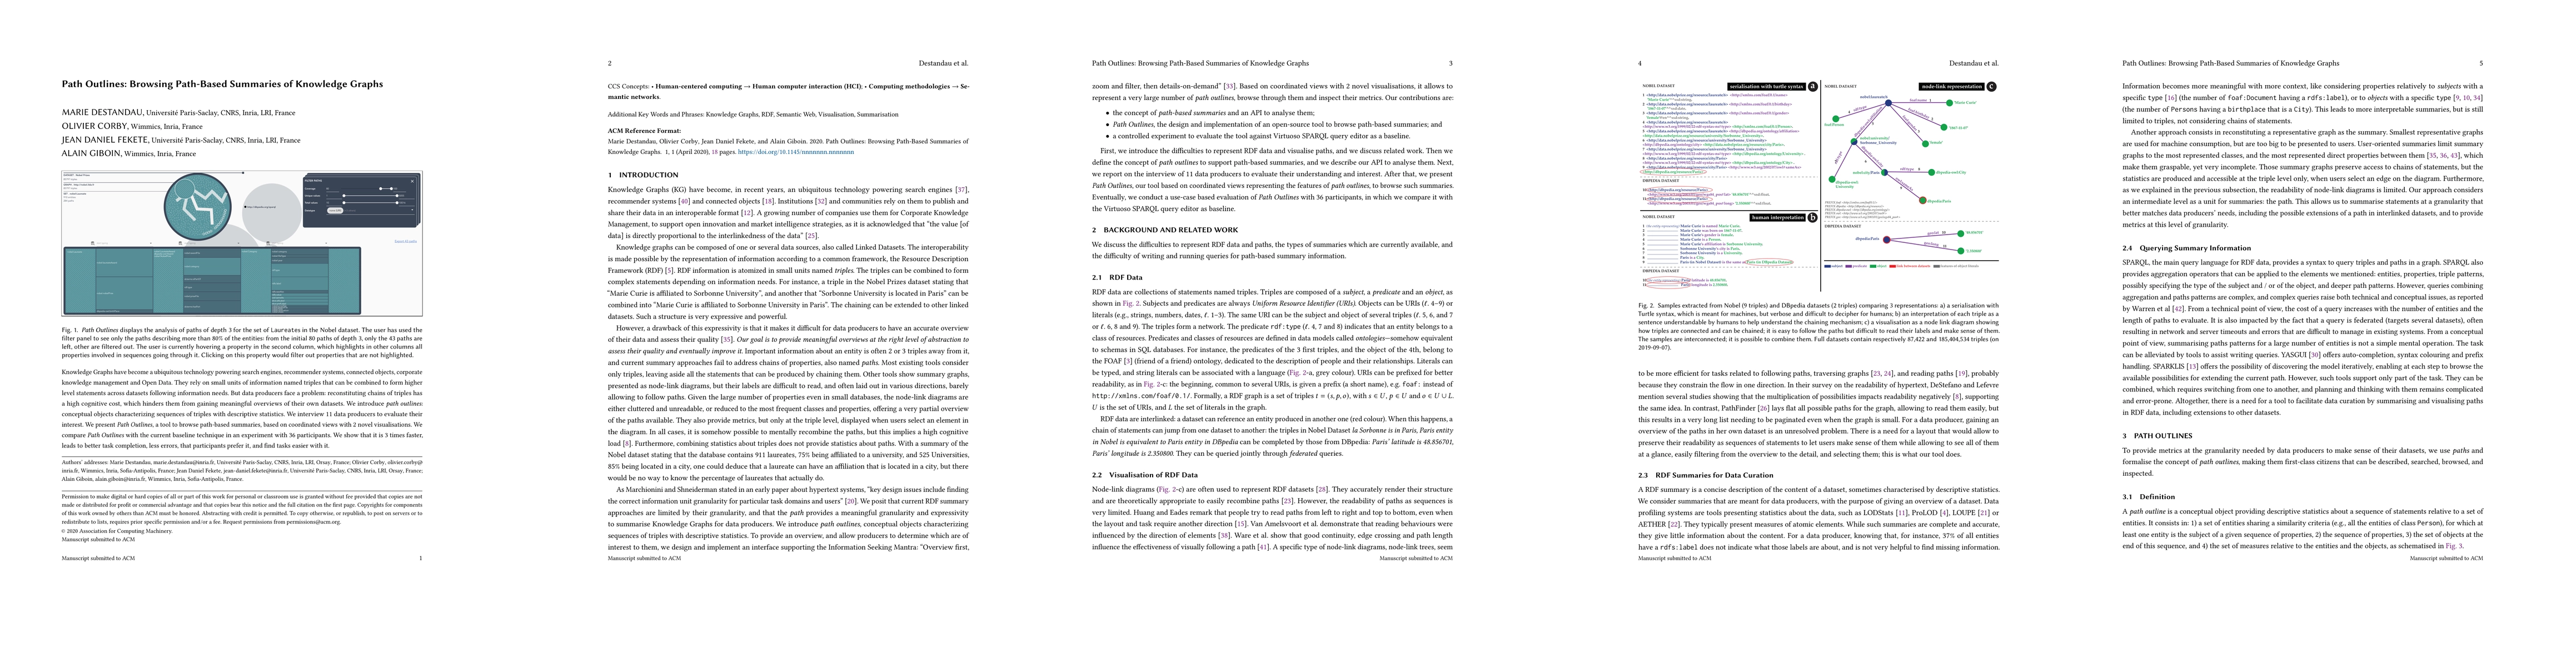
Knowledge Graphs have become a ubiquitous technology powering search engines, recommender systems, connected objects, corporate knowledge management and Open Data. They rely on small units of inform...
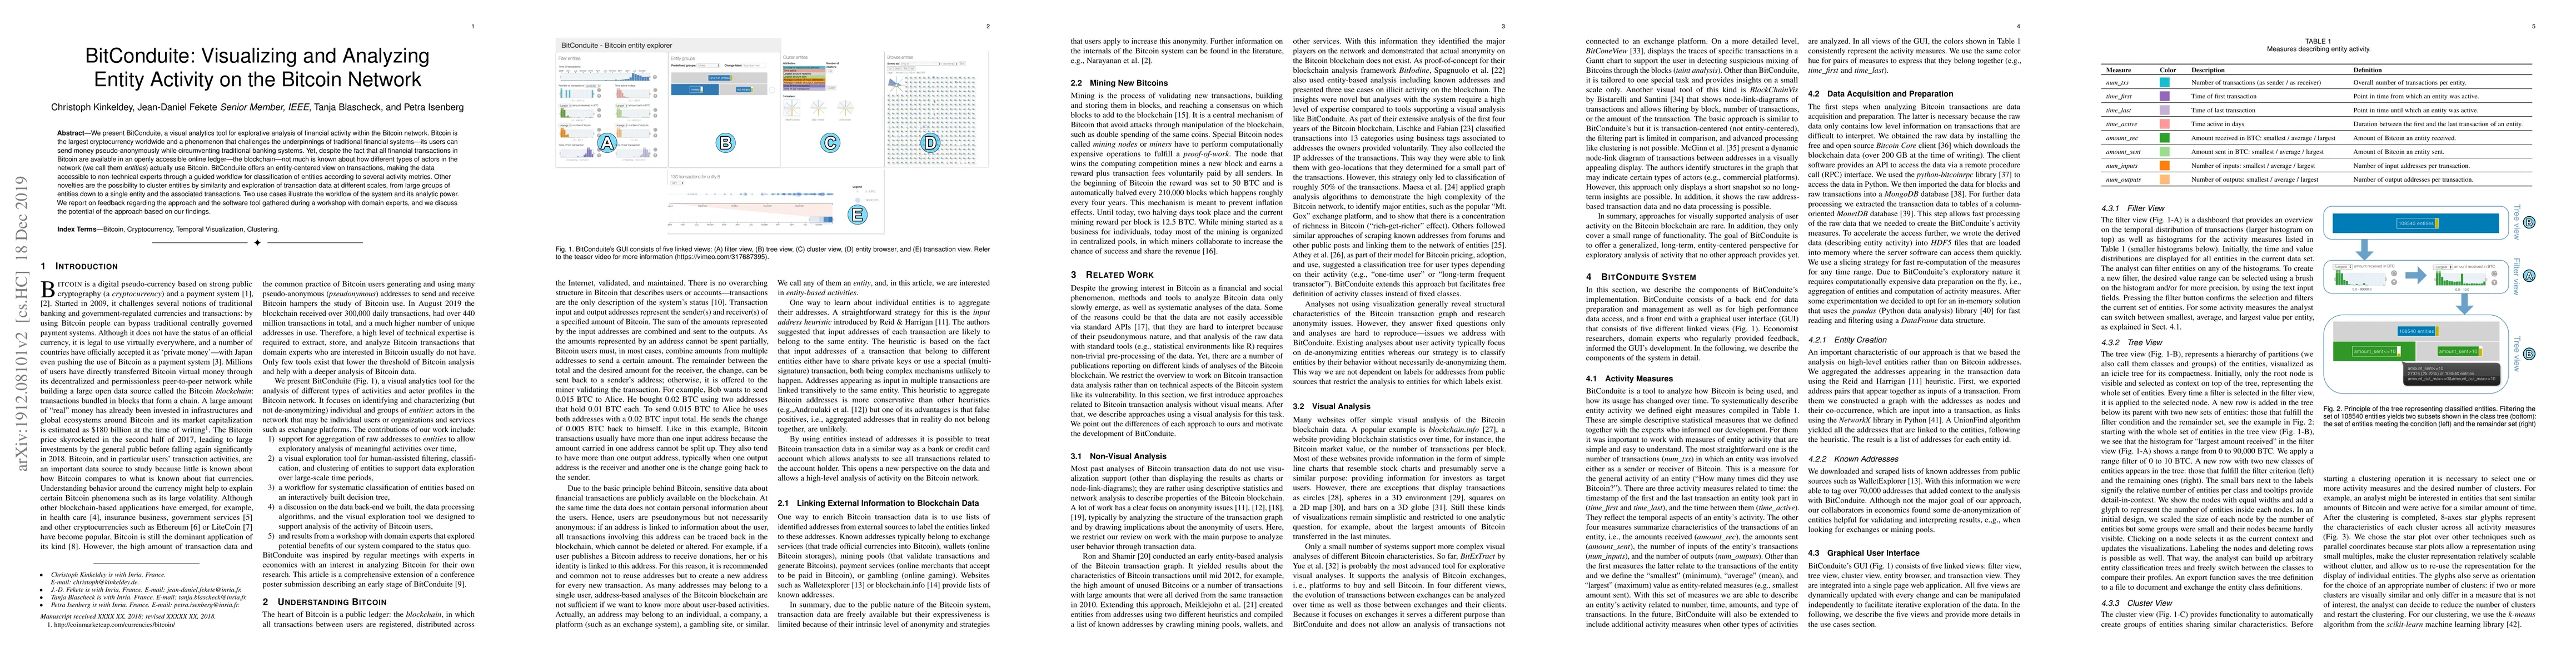
We present BitConduite, a visual analytics tool for explorative analysis of financial activity within the Bitcoin network. Bitcoin is the largest cryptocurrency worldwide and a phenomenon that chall...
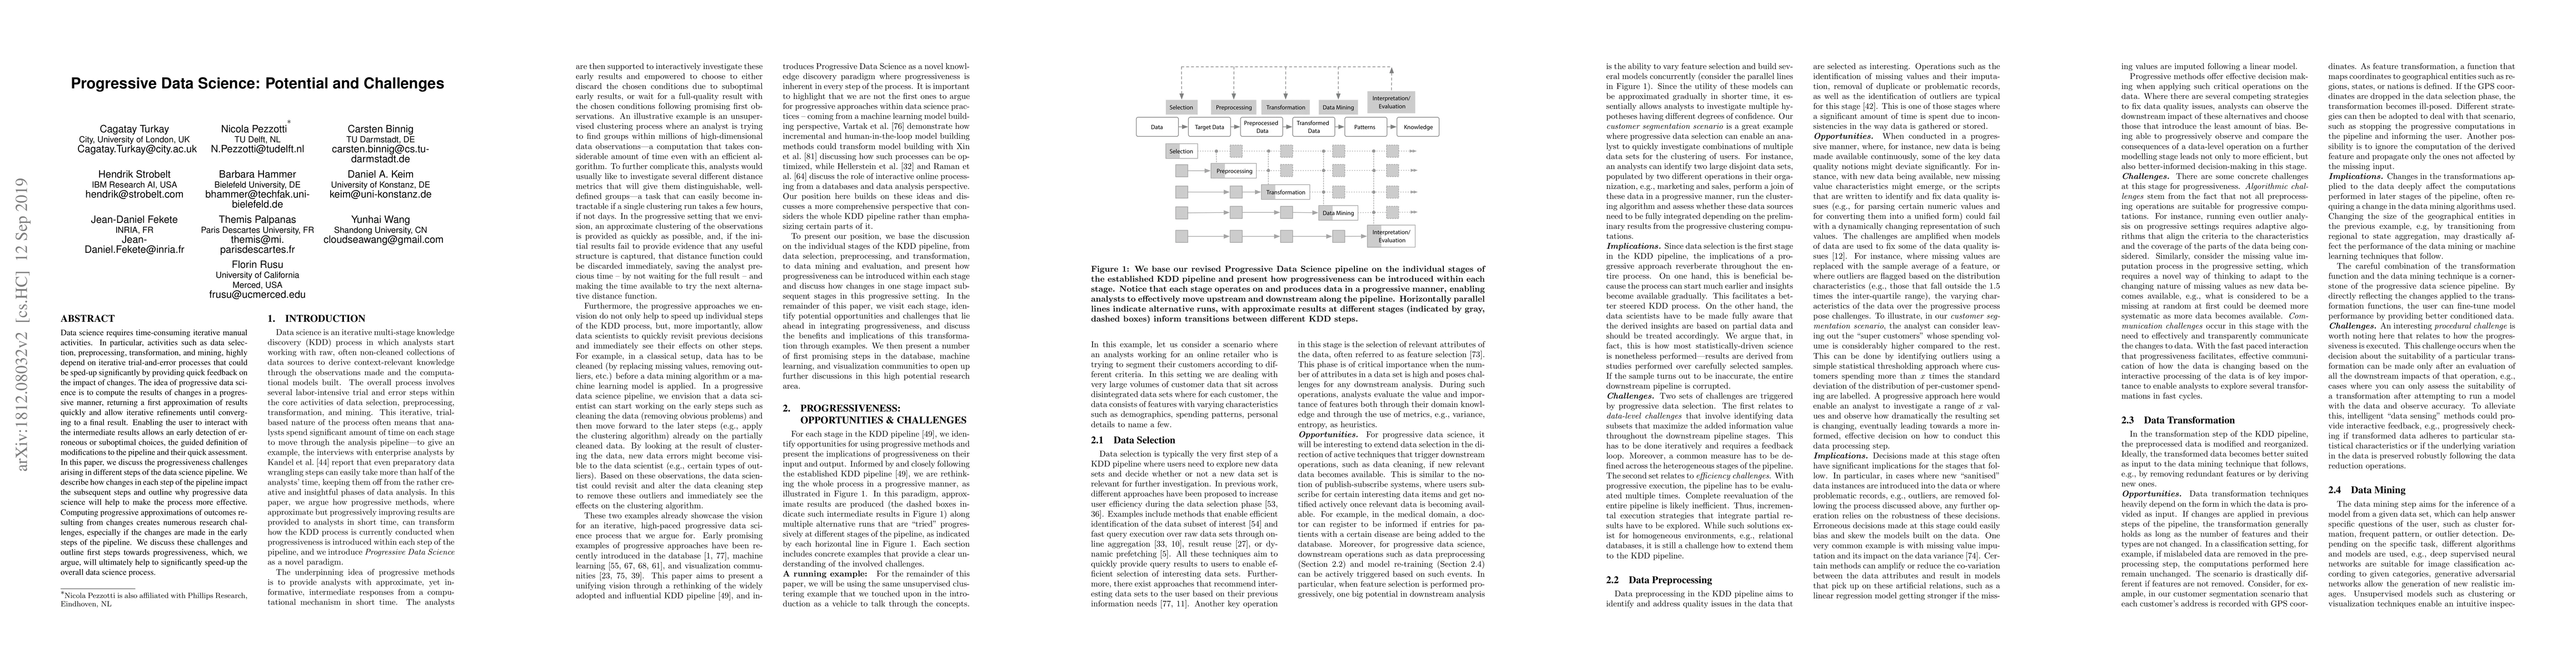
Data science requires time-consuming iterative manual activities. In particular, activities such as data selection, preprocessing, transformation, and mining, highly depend on iterative trial-and-er...
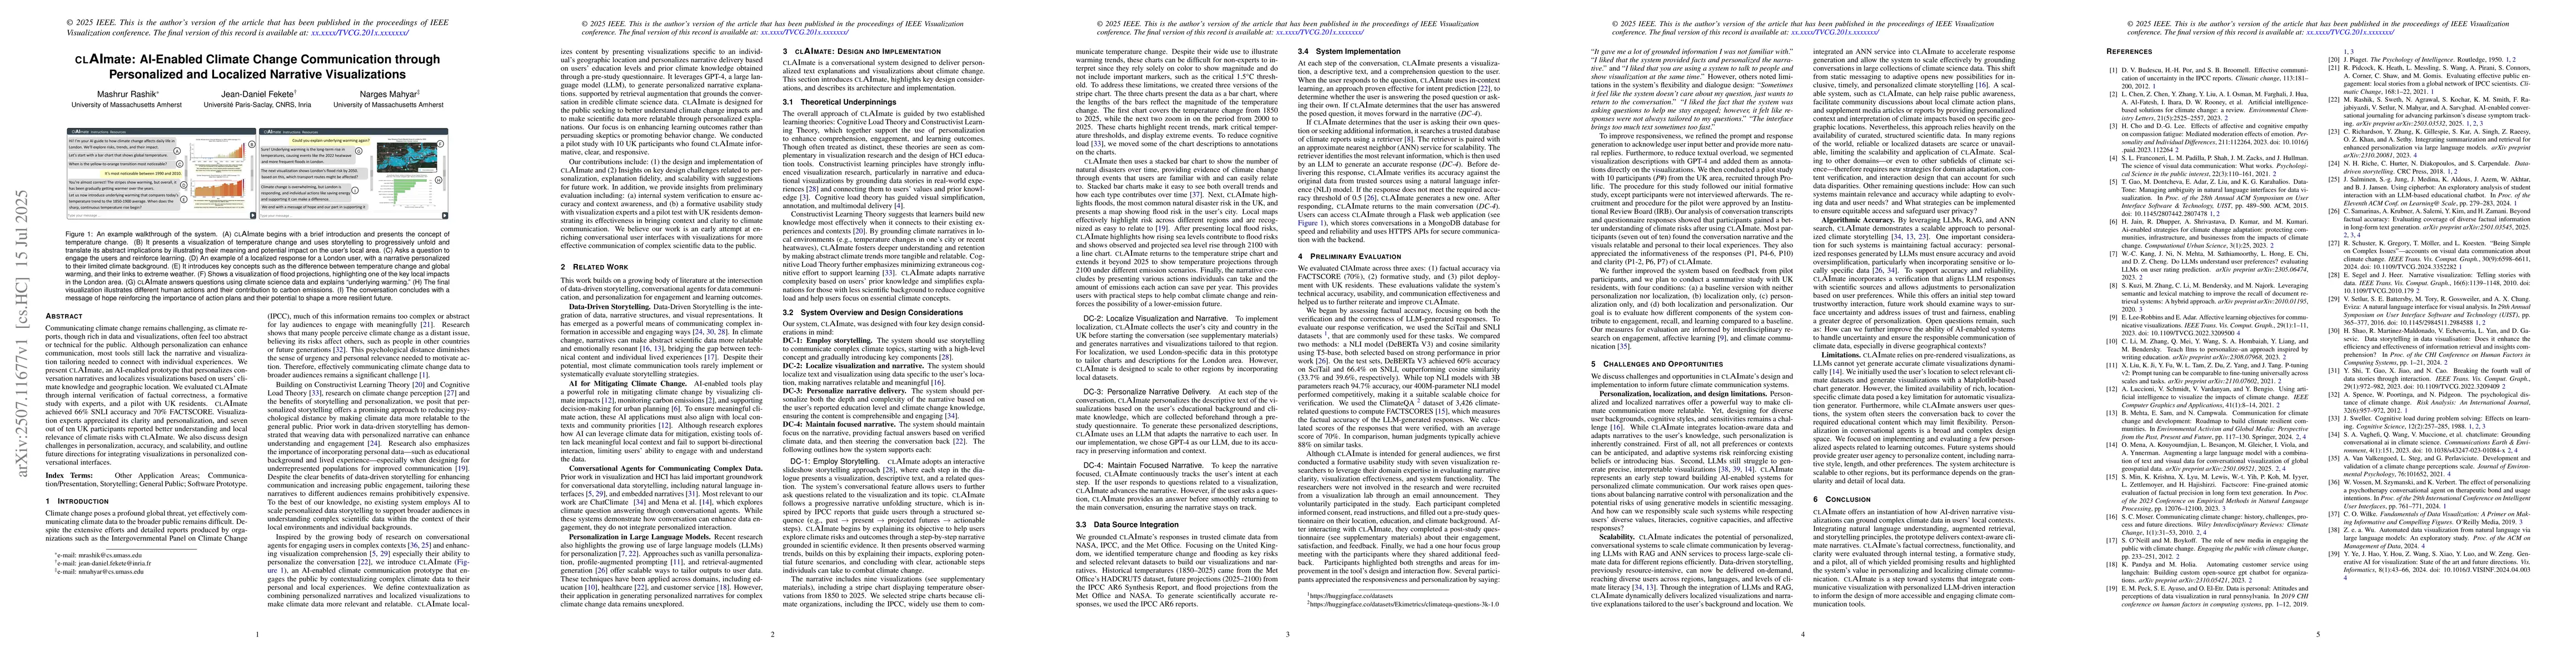
Communicating climate change remains challenging, as climate reports, though rich in data and visualizations, often feel too abstract or technical for the public. Although personalization can enhance ...
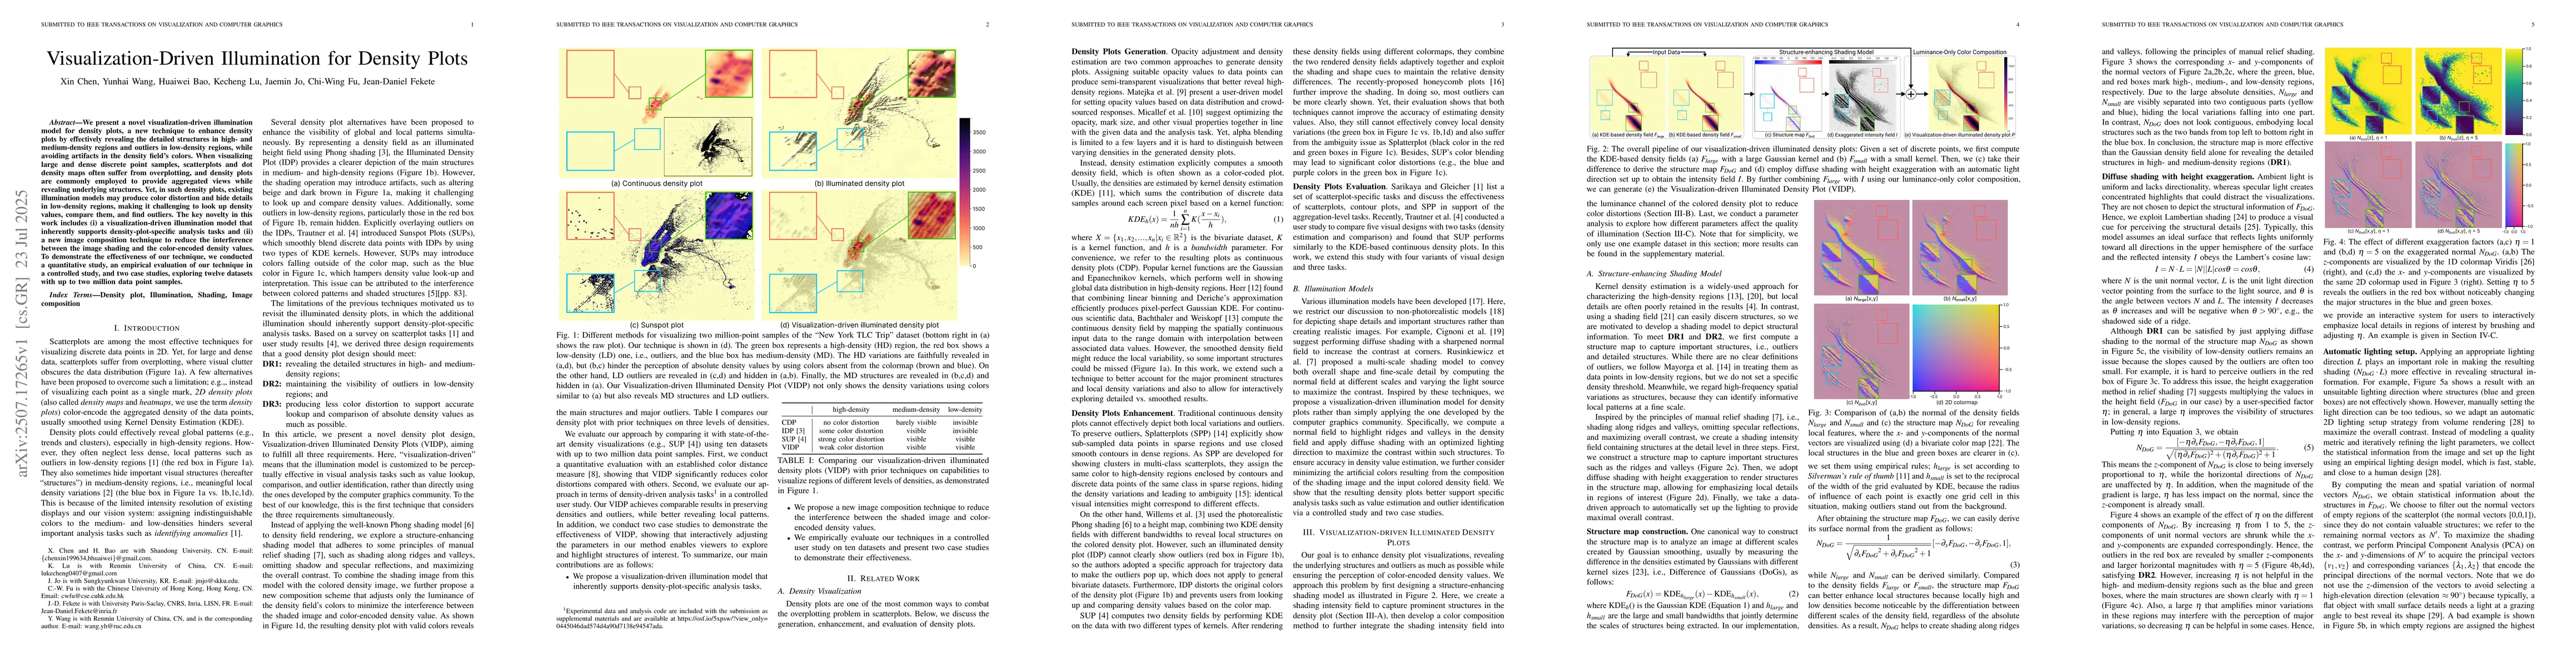
We present a novel visualization-driven illumination model for density plots, a new technique to enhance density plots by effectively revealing the detailed structures in high- and medium-density regi...
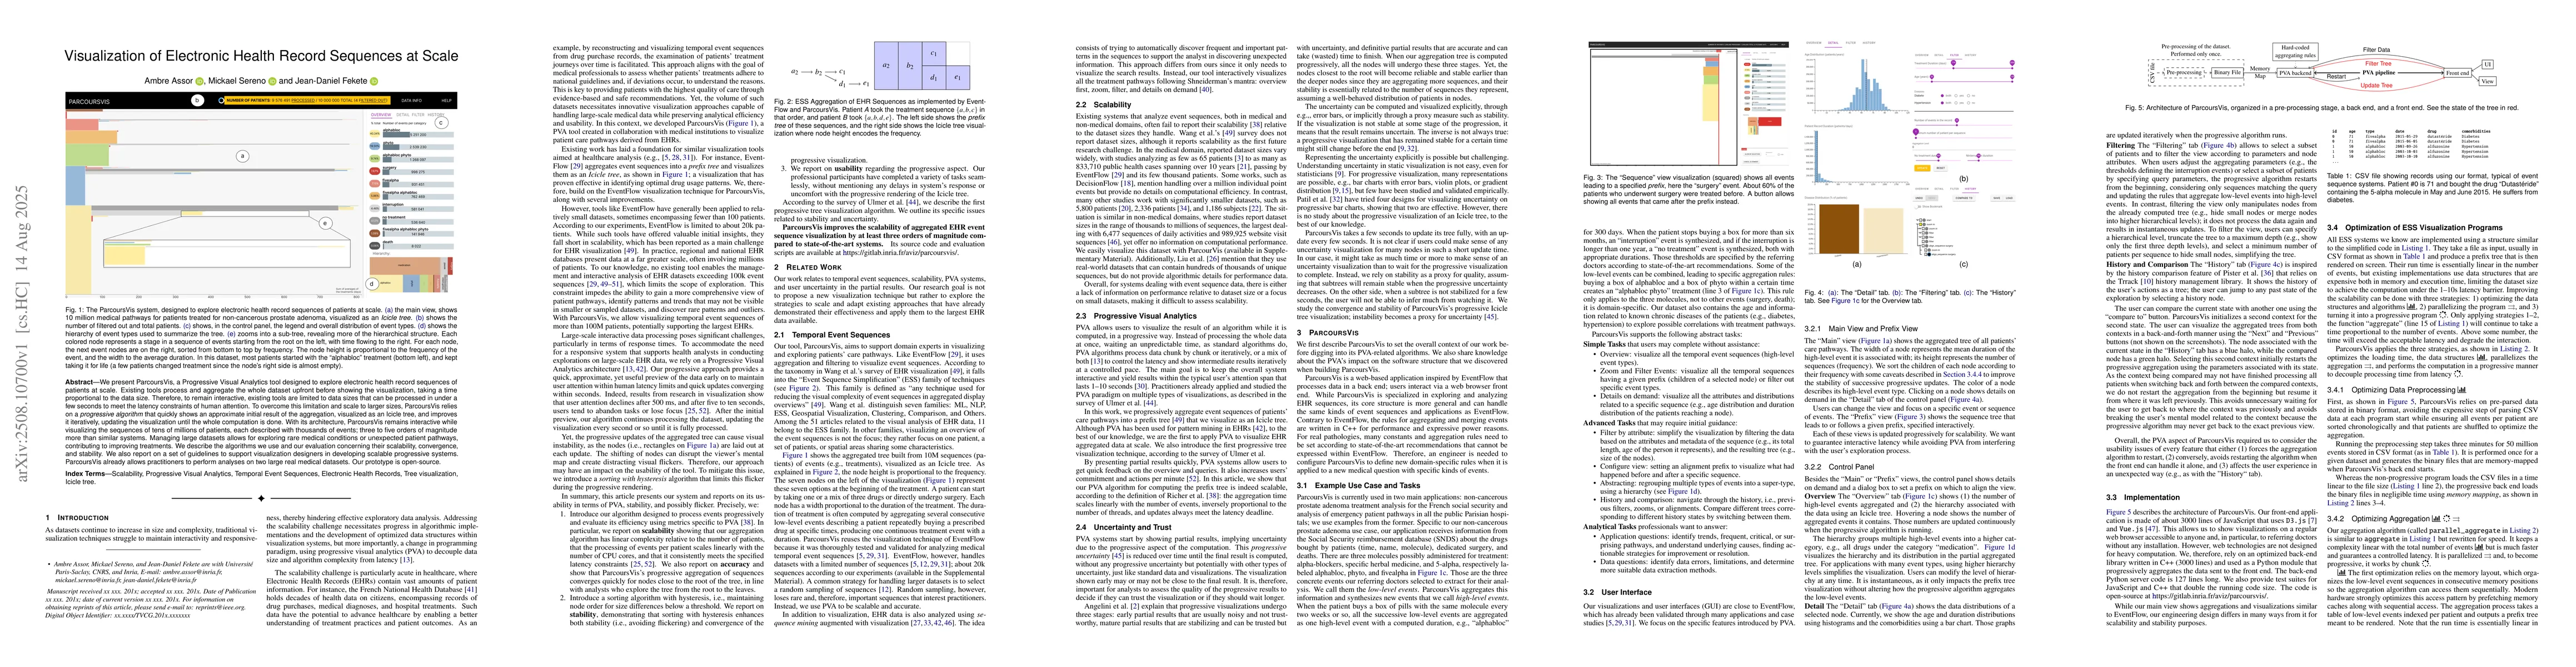
We present ParcoursVis, a Progressive Visual Analytics tool designed to explore electronic health record sequences of patients at scale. Existing tools process and aggregate the whole dataset upfront ...
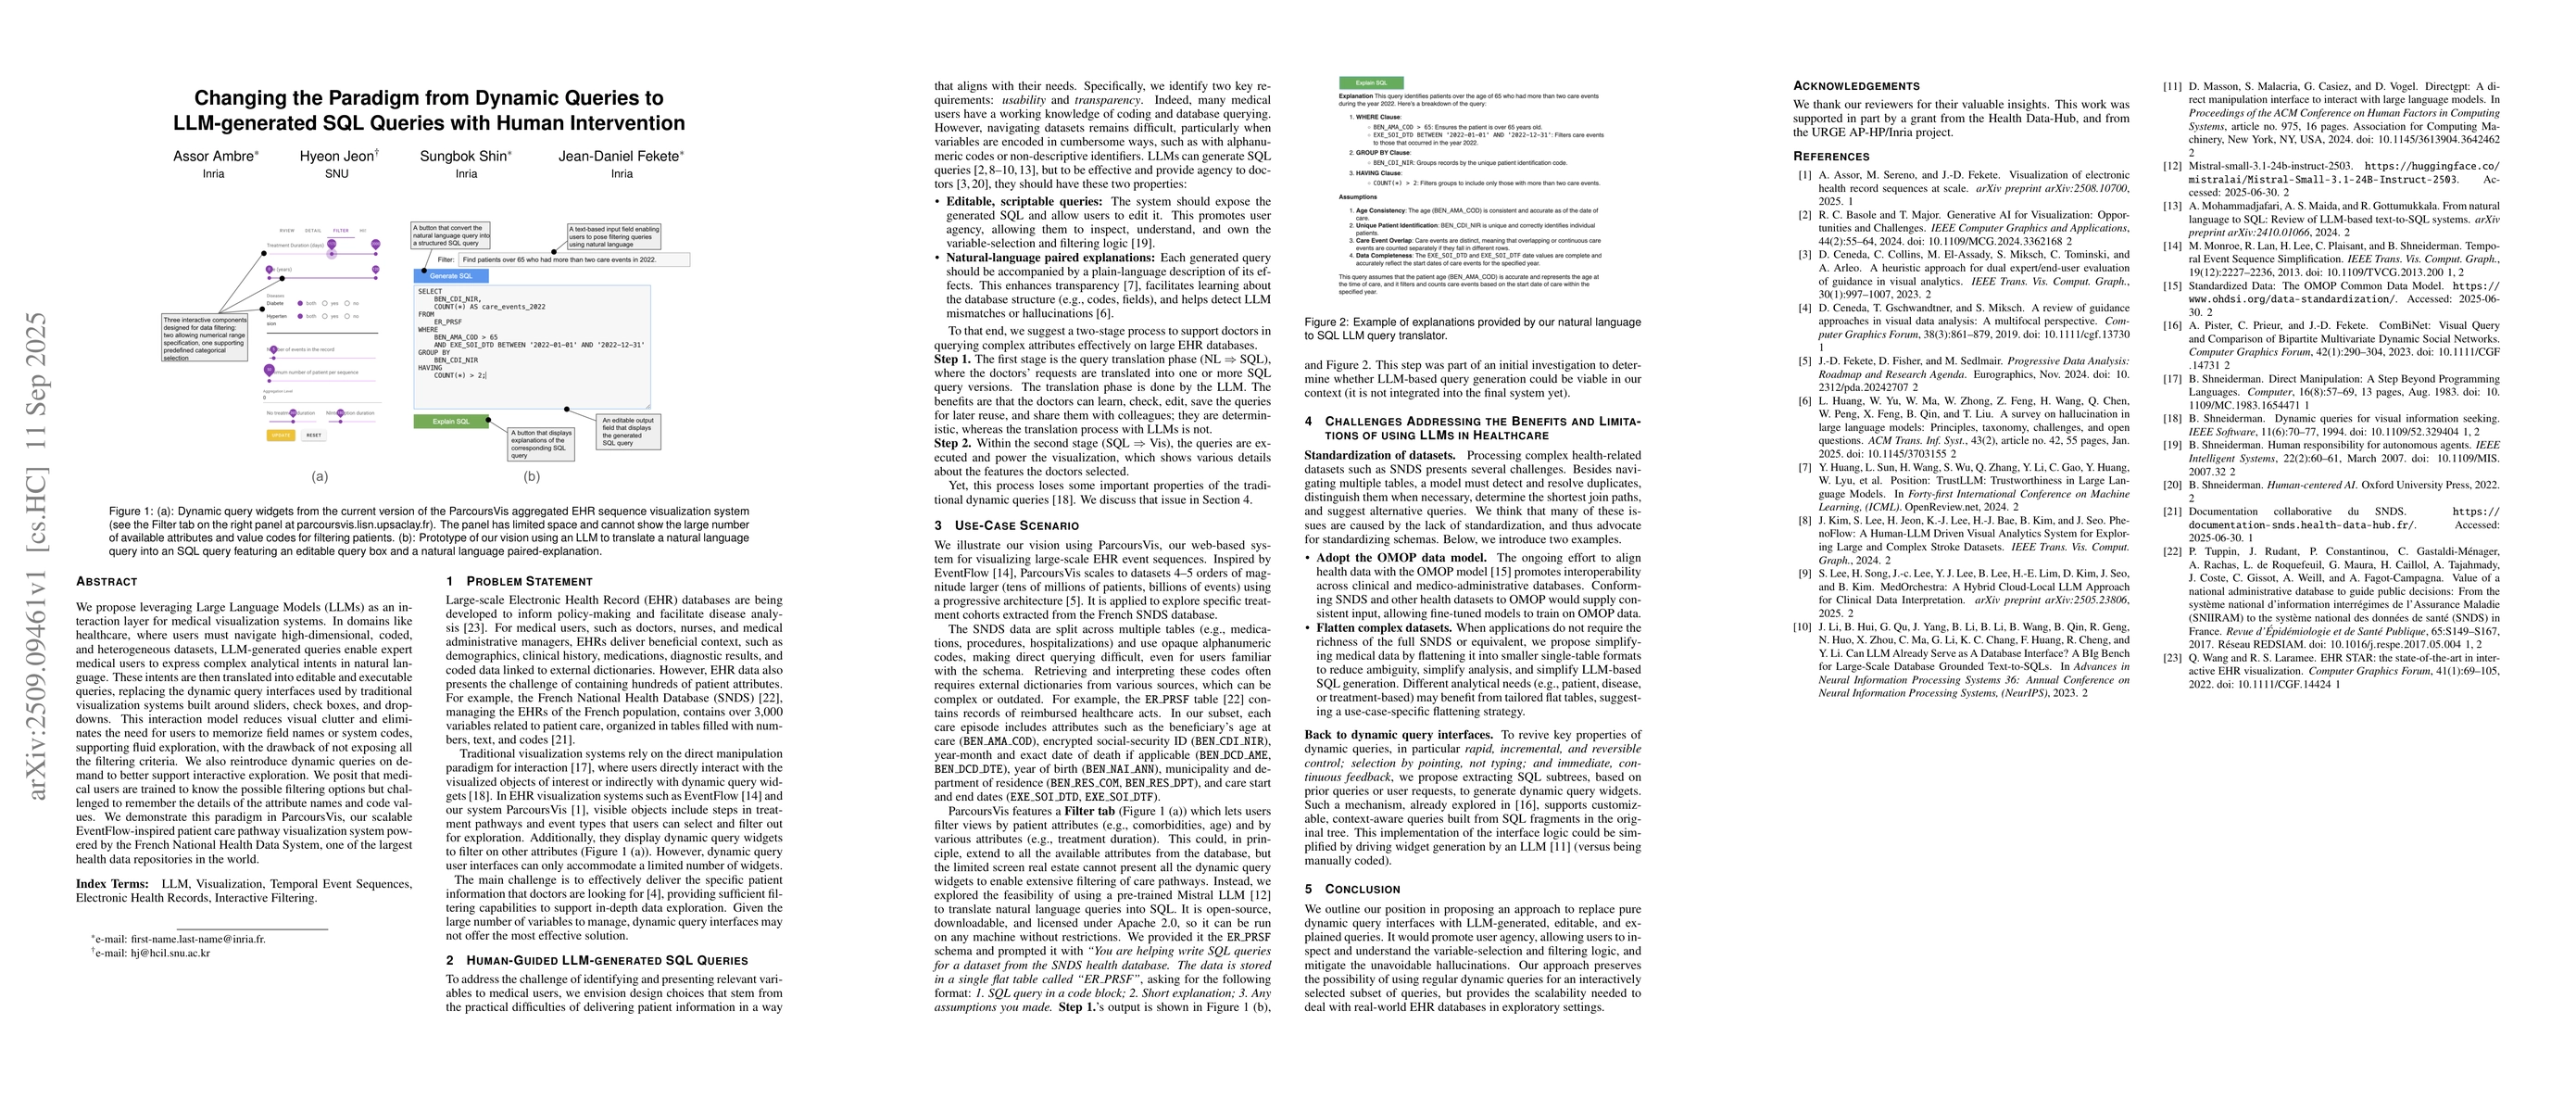
We propose leveraging Large Language Models (LLMs) as an interaction layer for medical visualization systems. In domains like healthcare, where users must navigate high-dimensional, coded, and heterog...
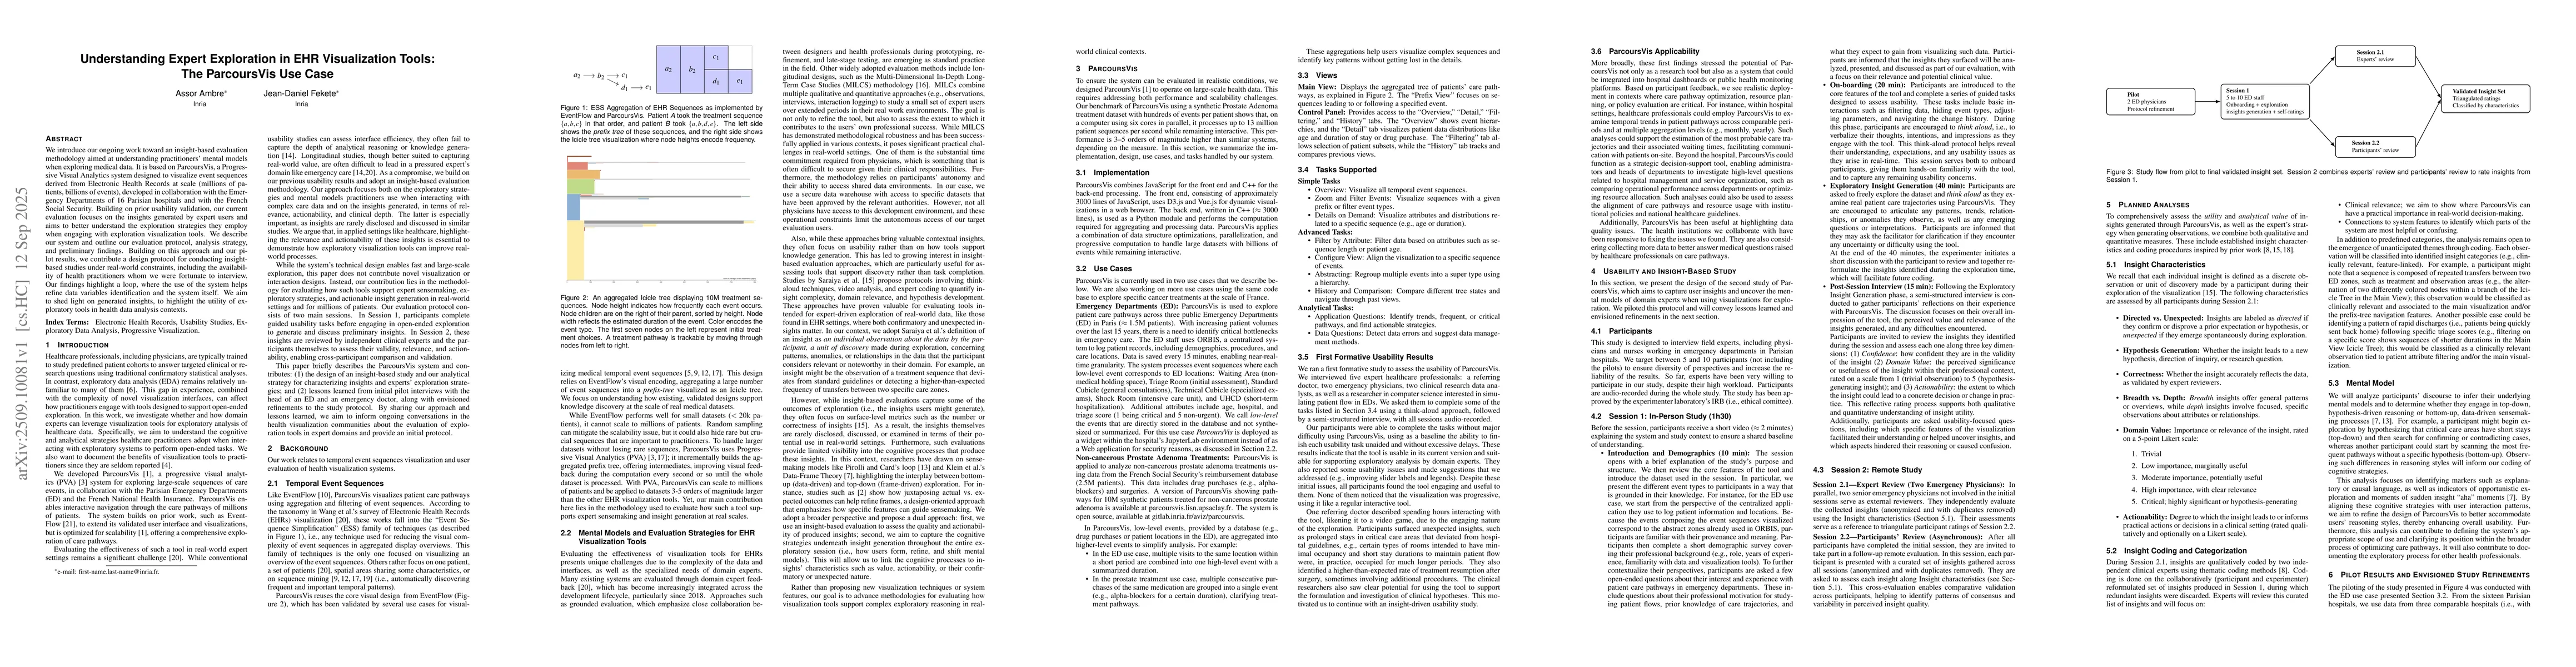
We introduce our ongoing work toward an insight-based evaluation methodology aimed at understanding practitioners' mental models when exploring medical data. It is based on ParcoursVis, a Progressive ...
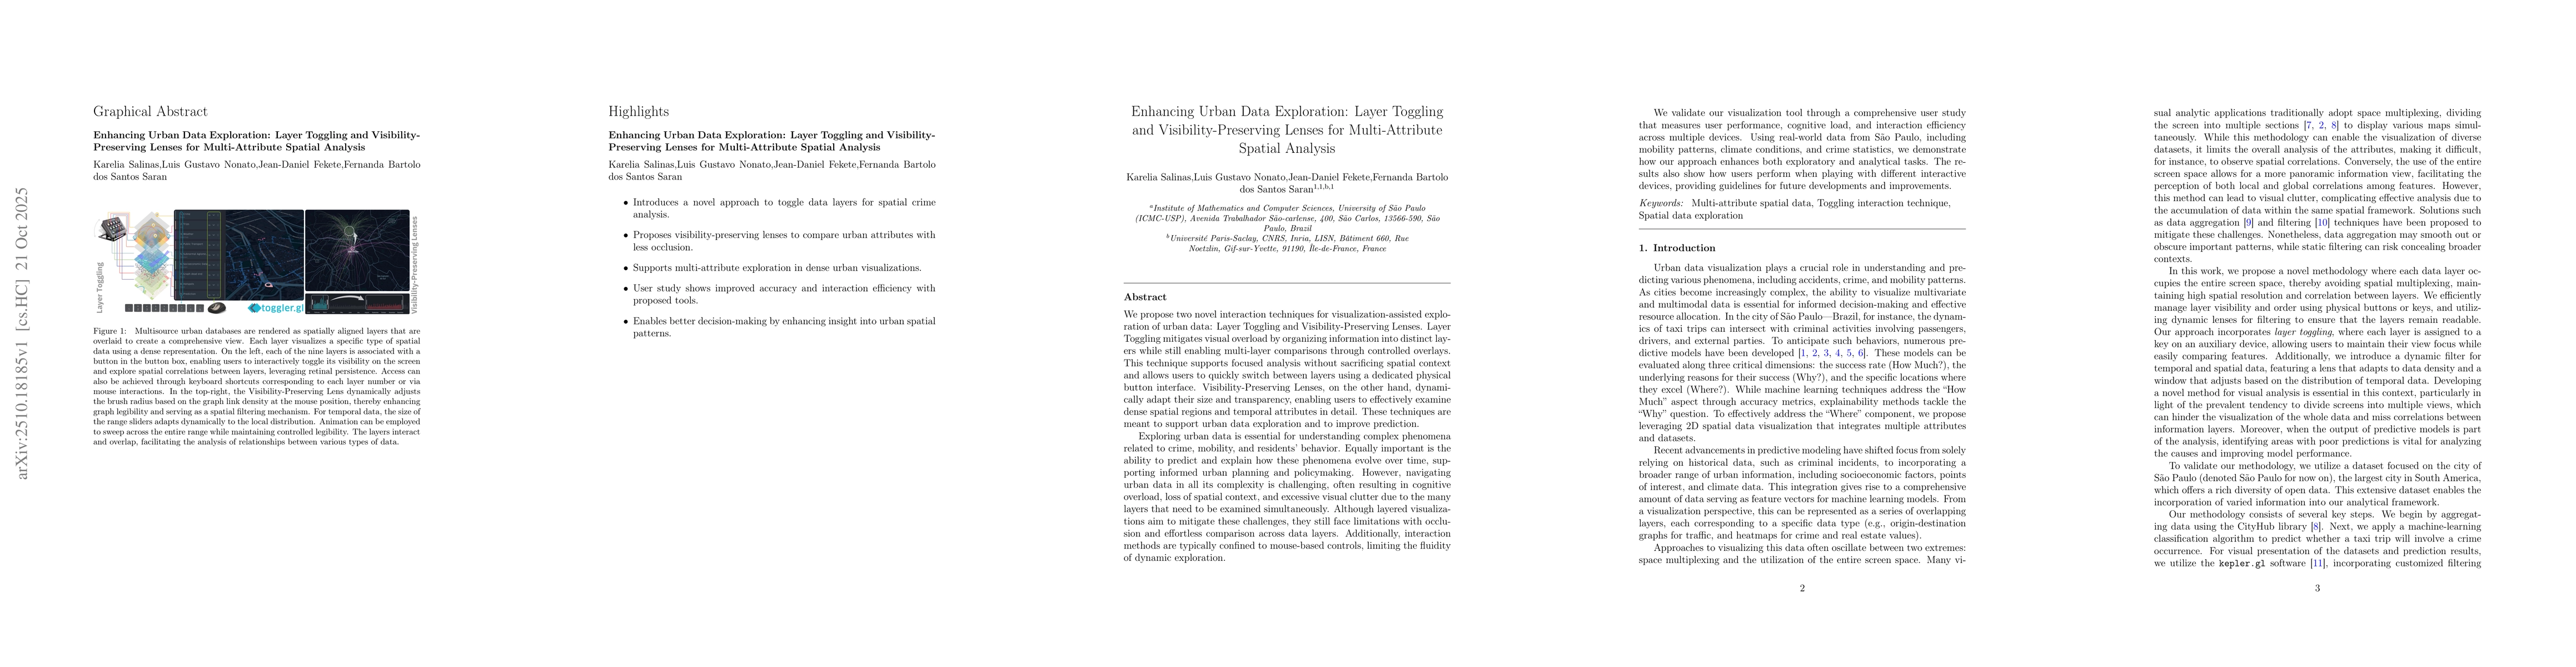
We propose two novel interaction techniques for visualization-assisted exploration of urban data: Layer Toggling and Visibility-Preserving Lenses. Layer Toggling mitigates visual overload by organizin...
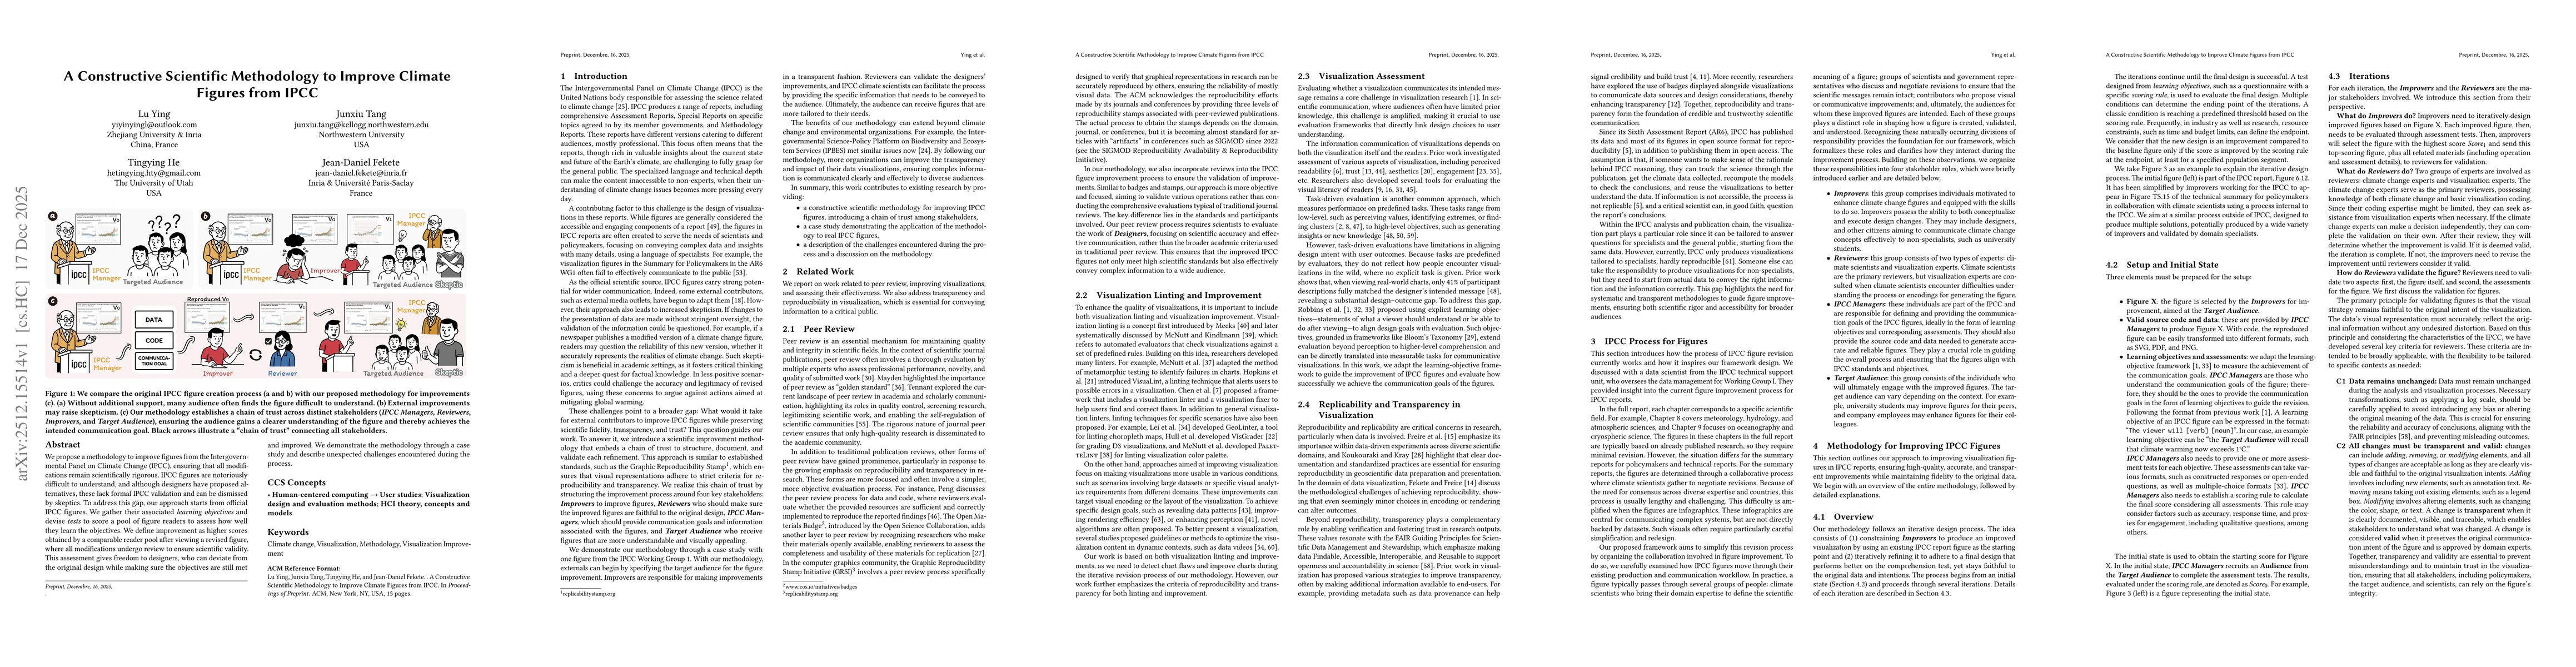
We propose a methodology to improve figures from the Intergovernmental Panel on Climate Change (IPCC), ensuring that all modifications remain scientifically rigorous. IPCC figures are notoriously diff...
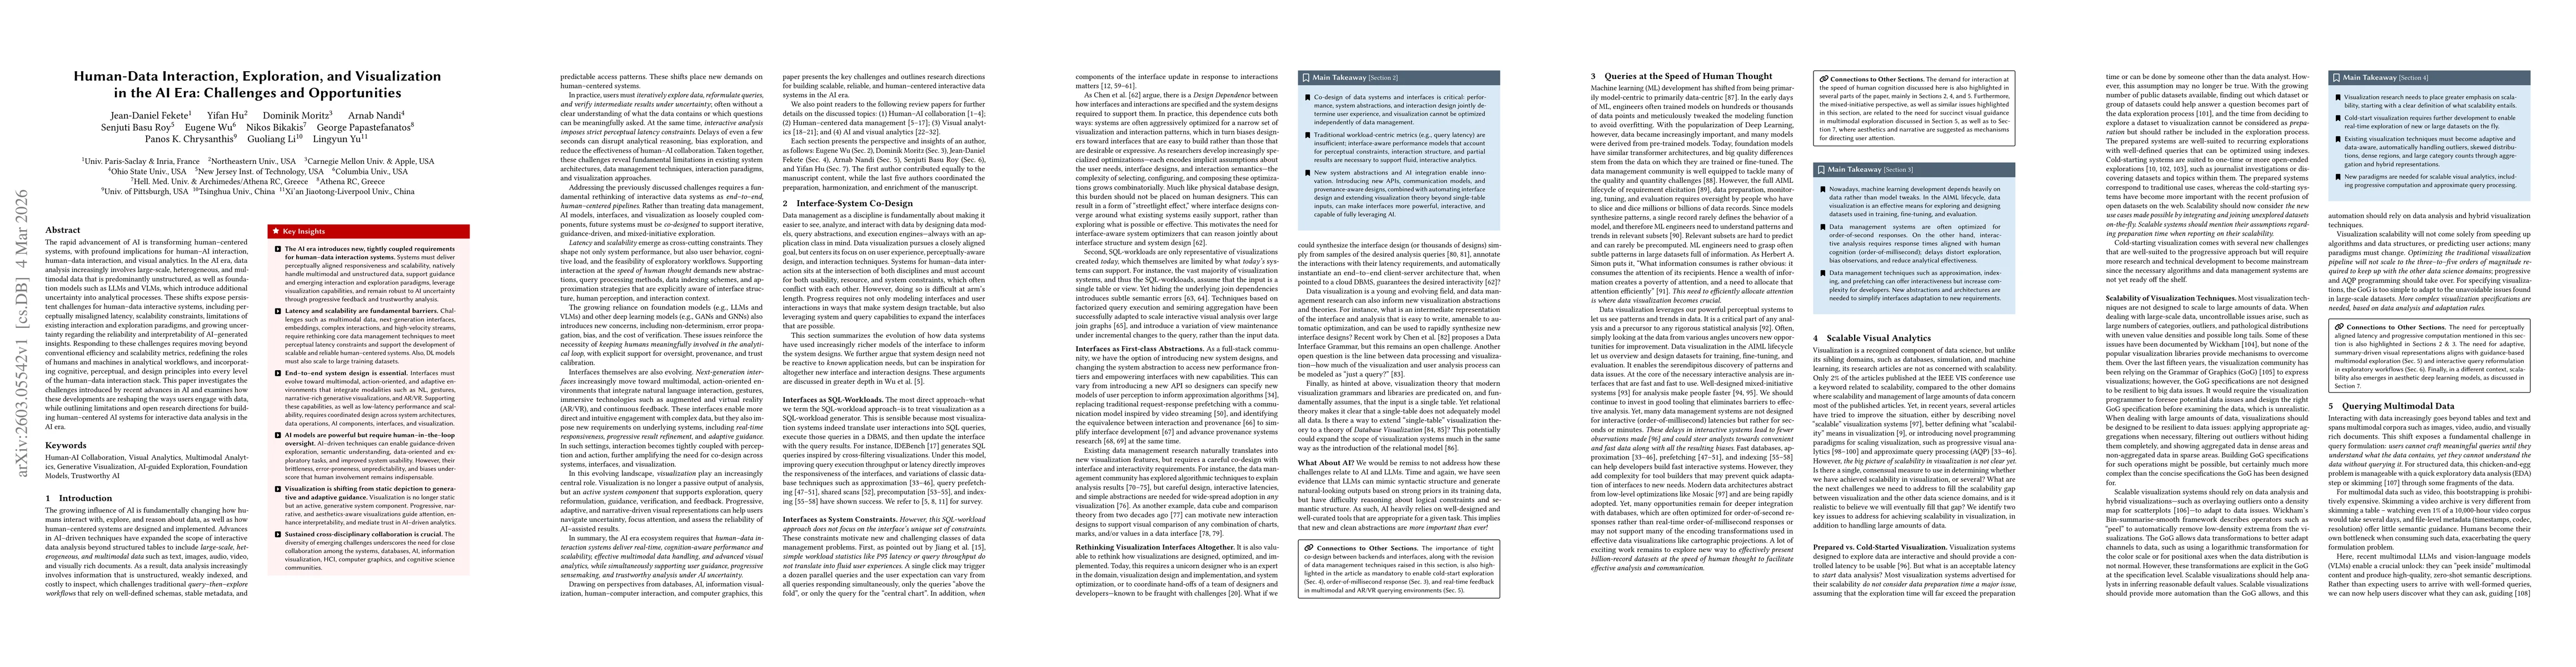
The rapid advancement of AI is transforming human-centered systems, with profound implications for human-AI interaction, human-data interaction, and visual analytics. In the AI era, data analysis incr...