Lost in Magnitudes: Exploring the Design Space for Visualizing Data with Large Value Ranges
Publication
Metrics
AI Quick Summary
This paper explores the design space for visualizing datasets with Orders of Magnitude Values (OMVs) and proposes a method to separate OMVs into mantissa and exponent for better comprehension. It presents guidelines and recommendations for effective visual encodings, aiming to improve visualization systems for large value ranges.
Paper Preview
Abstract
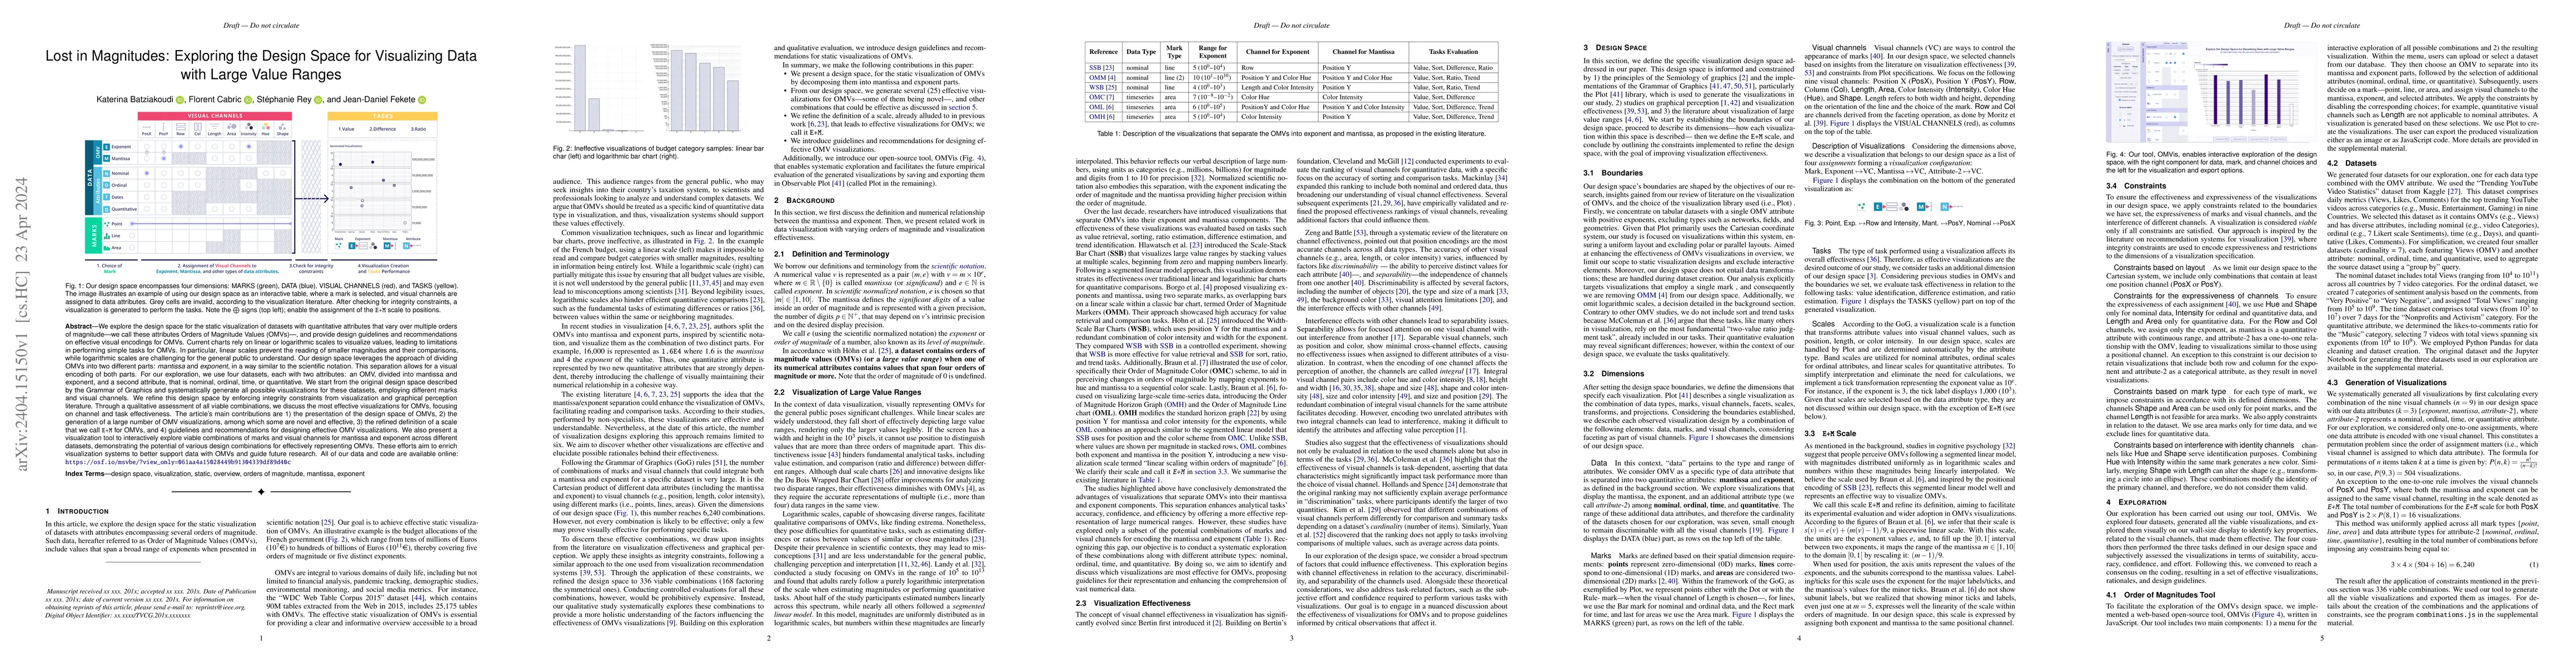
We explore the design space for the static visualization of datasets with quantitative attributes that vary over multiple orders of magnitude-we call these attributes Orders of Magnitude Values (OMVs)-and provide design guidelines and recommendations on effective visual encodings for OMVs. Current charts rely on linear or logarithmic scales to visualize values, leading to limitations in performing simple tasks for OMVs. In particular, linear scales prevent the reading of smaller magnitudes and their comparisons, while logarithmic scales are challenging for the general public to understand. Our design space leverages the approach of dividing OMVs into two different parts: mantissa and exponent, in a way similar to scientific notation. This separation allows for a visual encoding of both parts. For our exploration, we use four datasets, each with two attributes: an OMV, divided into mantissa and exponent, and a second attribute that is nominal, ordinal, time, or quantitative. We start from the original design space described by the Grammar of Graphics and systematically generate all possible visualizations for these datasets, employing different marks and visual channels. We refine this design space by enforcing integrity constraints from visualization and graphical perception literature. Through a qualitative assessment of all viable combinations, we discuss the most effective visualizations for OMVs, focusing on channel and task effectiveness. The article's main contributions are 1) the presentation of the design space of OMVs, 2) the generation of a large number of OMV visualizations, among which some are novel and effective, 3) the refined definition of a scale that we call E+M for OMVs, and 4) guidelines and recommendations for designing effective OMV visualizations. These efforts aim to enrich visualization systems to better support data with OMVs and guide future research.
AI Key Findings
Get AI-generated insights about this paper's methodology, results, significance, and more — seven facets brought into focus.
Impact
Paper Details
Authors
PDF Preview
Key Terms
Citation Network
Current paper (gray), citations (green), references (blue)
Display is limited for performance on very large graphs.
Discussion 0