Color Coding of Large Value Ranges Applied to Meteorological Data
Publication
Metrics
AI Quick Summary
This paper introduces a novel color coding scheme for visualizing meteorological data with large value ranges, employing a "nested" color scheme based on numerical representation. The new design outperforms existing color scales in interpretation tasks, though it shows comparable results in discrimination tasks.
Paper Preview
Abstract
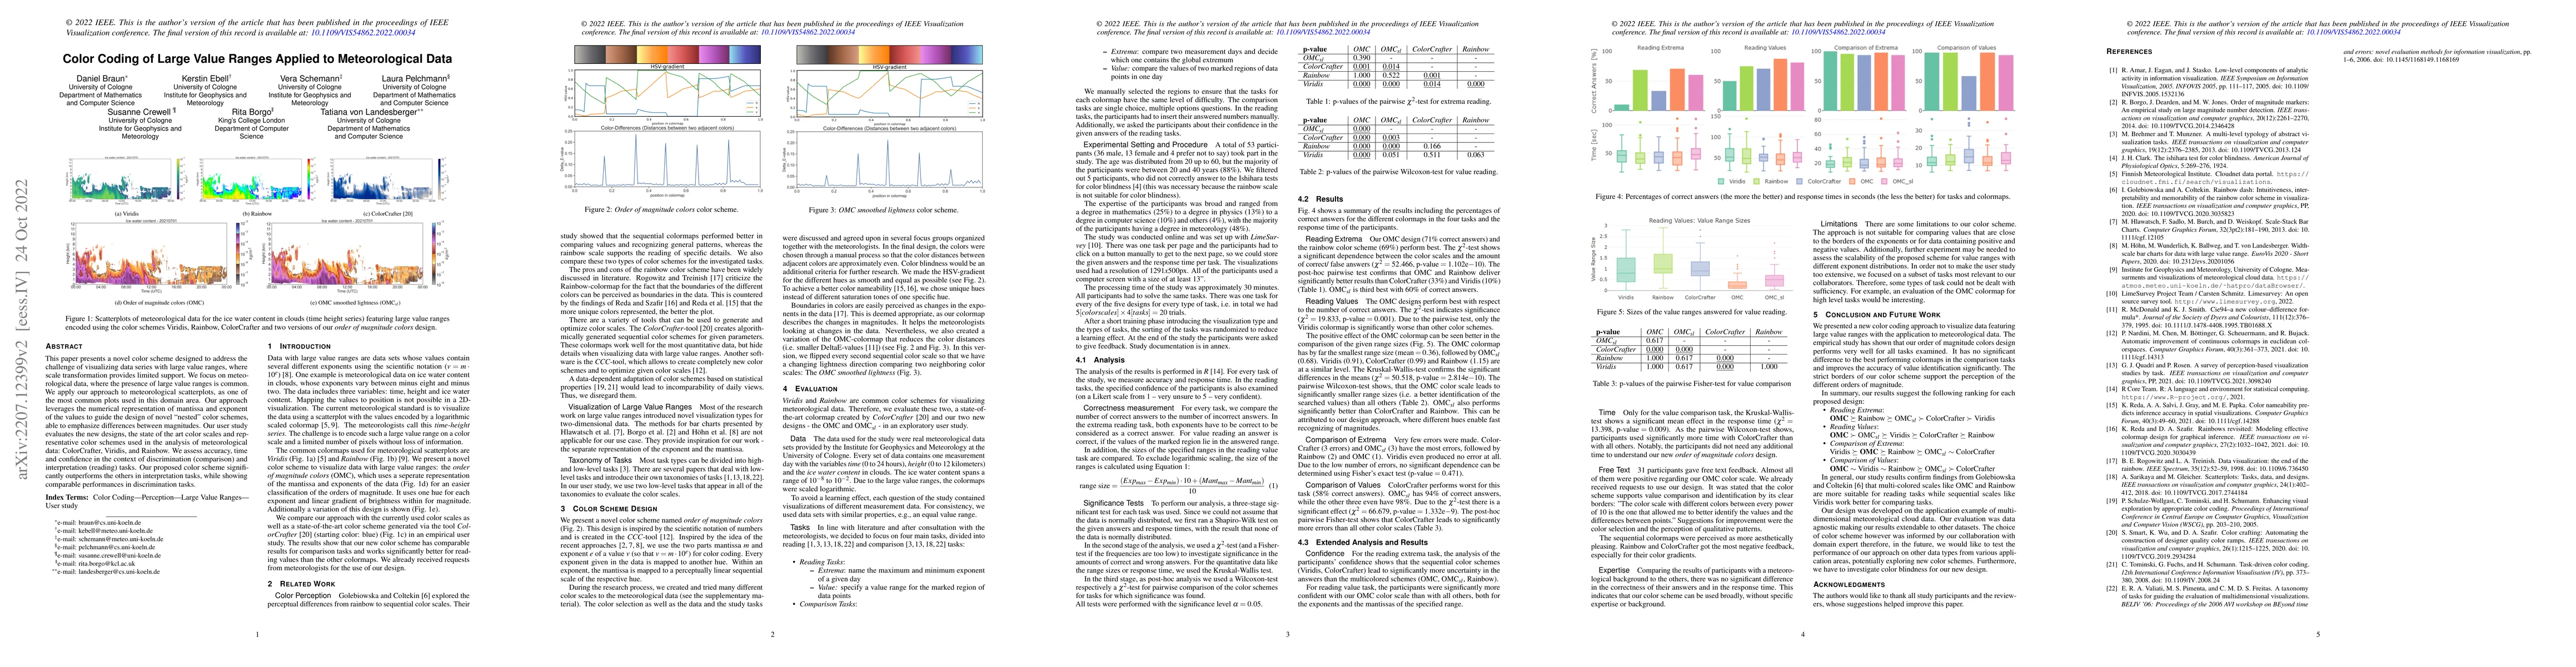
This paper presents a novel color scheme designed to address the challenge of visualizing data series with large value ranges, where scale transformation provides limited support. We focus on meteorological data, where the presence of large value ranges is common. We apply our approach to meteorological scatterplots, as one of the most common plots used in this domain area. Our approach leverages the numerical representation of mantissa and exponent of the values to guide the design of novel "nested" color schemes, able to emphasize differences between magnitudes. Our user study evaluates the new designs, the state of the art color scales and representative color schemes used in the analysis of meteorological data: ColorCrafter, Viridis, and Rainbow. We assess accuracy, time and confidence in the context of discrimination (comparison) and interpretation (reading) tasks. Our proposed color scheme significantly outperforms the others in interpretation tasks, while showing comparable performances in discrimination tasks.
AI Key Findings
Get AI-generated insights about this paper's methodology, results, significance, and more — seven facets brought into focus.
Impact
Paper Details
Authors
PDF Preview
Key Terms
Citation Network
Current paper (gray), citations (green), references (blue)
Display is limited for performance on very large graphs.
Discussion 0