Academic Profile
Statistics
Similar Authors
Papers on arXiv
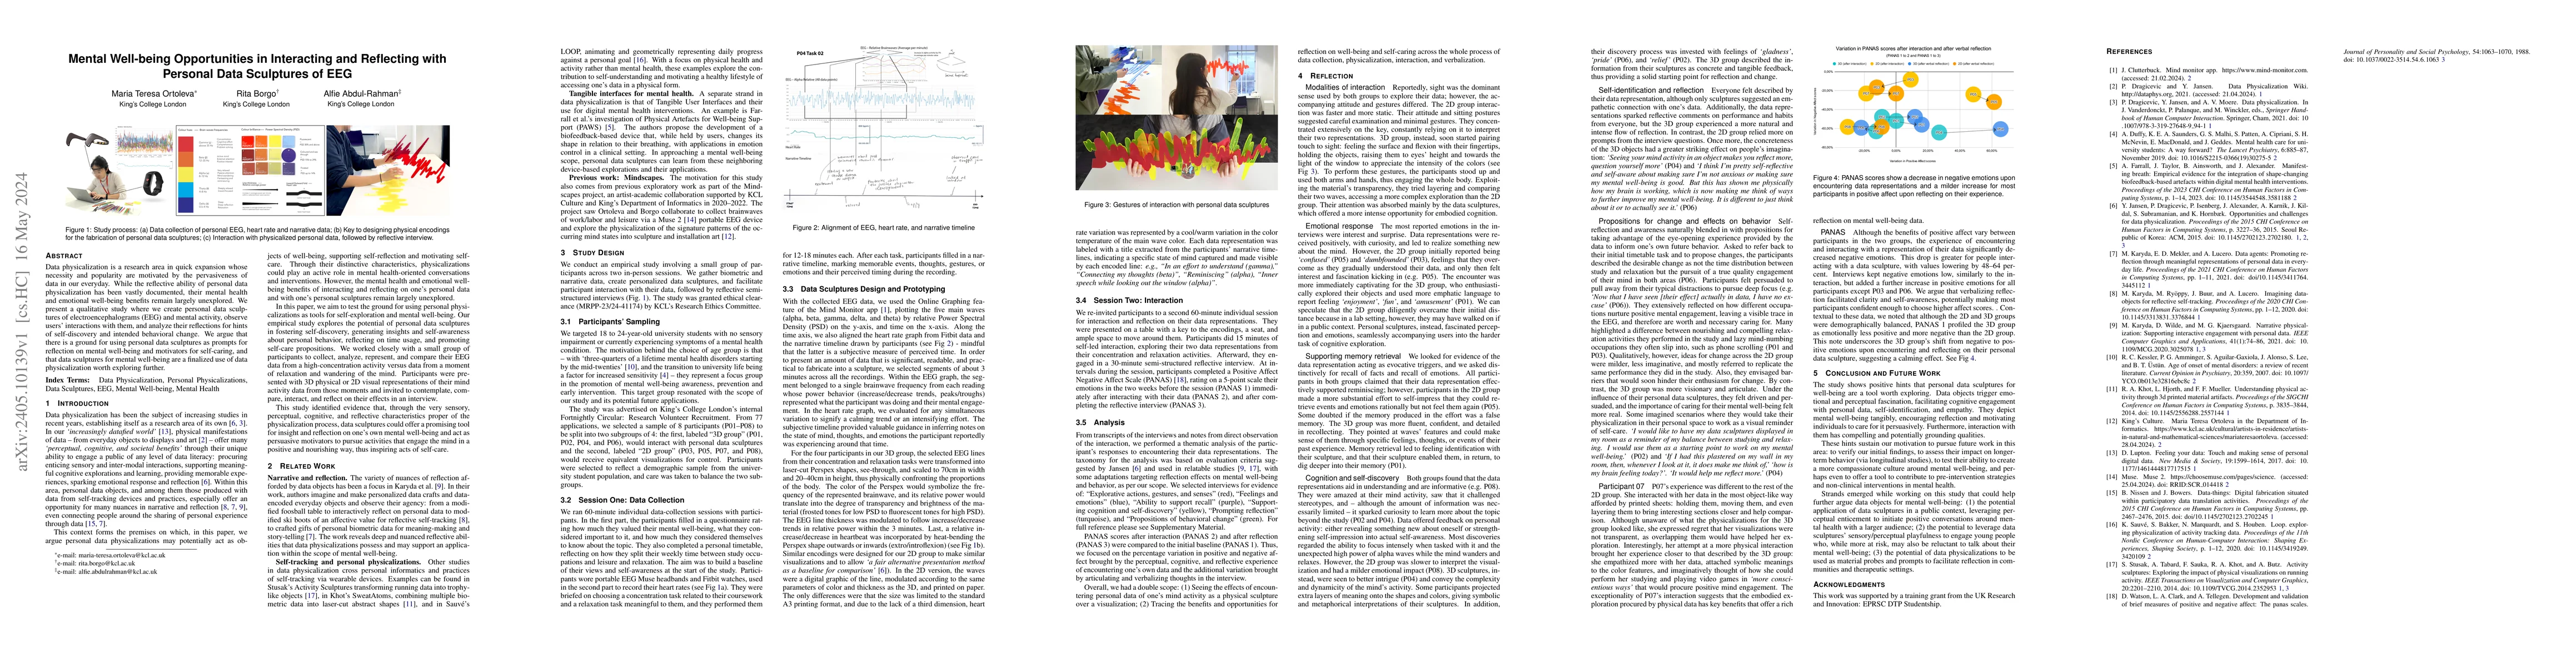
Data physicalization is a research area in quick expansion whose necessity and popularity are motivated by the pervasiveness of data in our everyday. While the reflective ability of personal data ph...
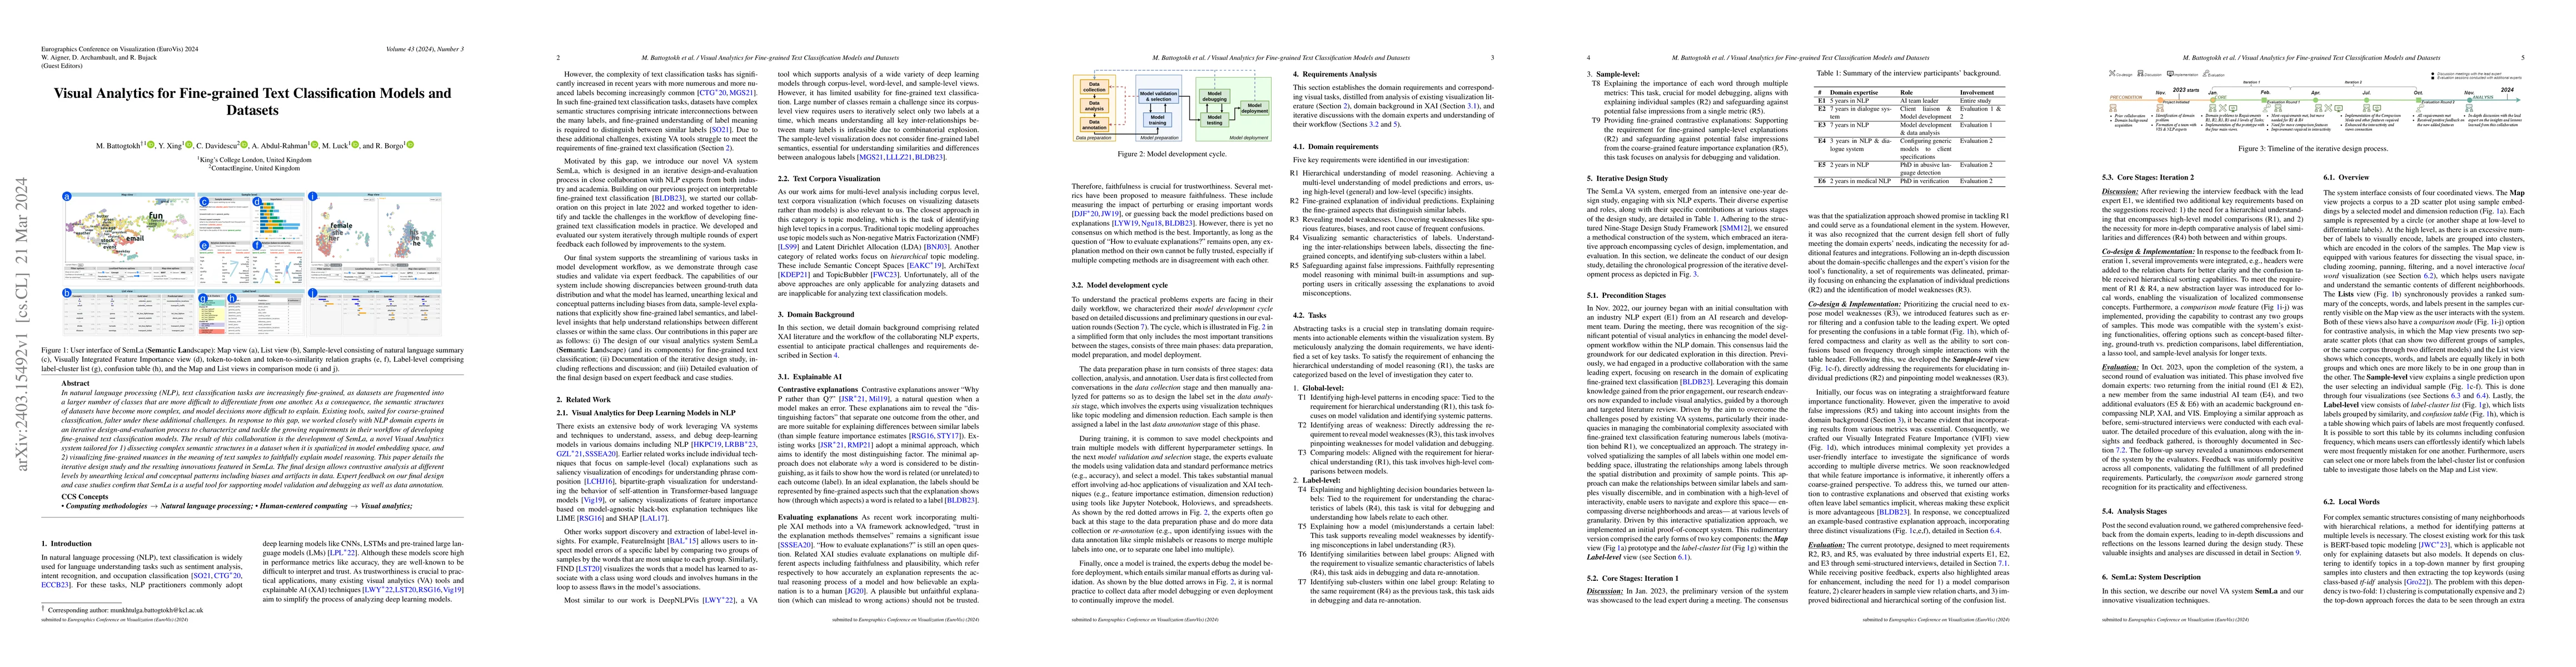
In natural language processing (NLP), text classification tasks are increasingly fine-grained, as datasets are fragmented into a larger number of classes that are more difficult to differentiate fro...
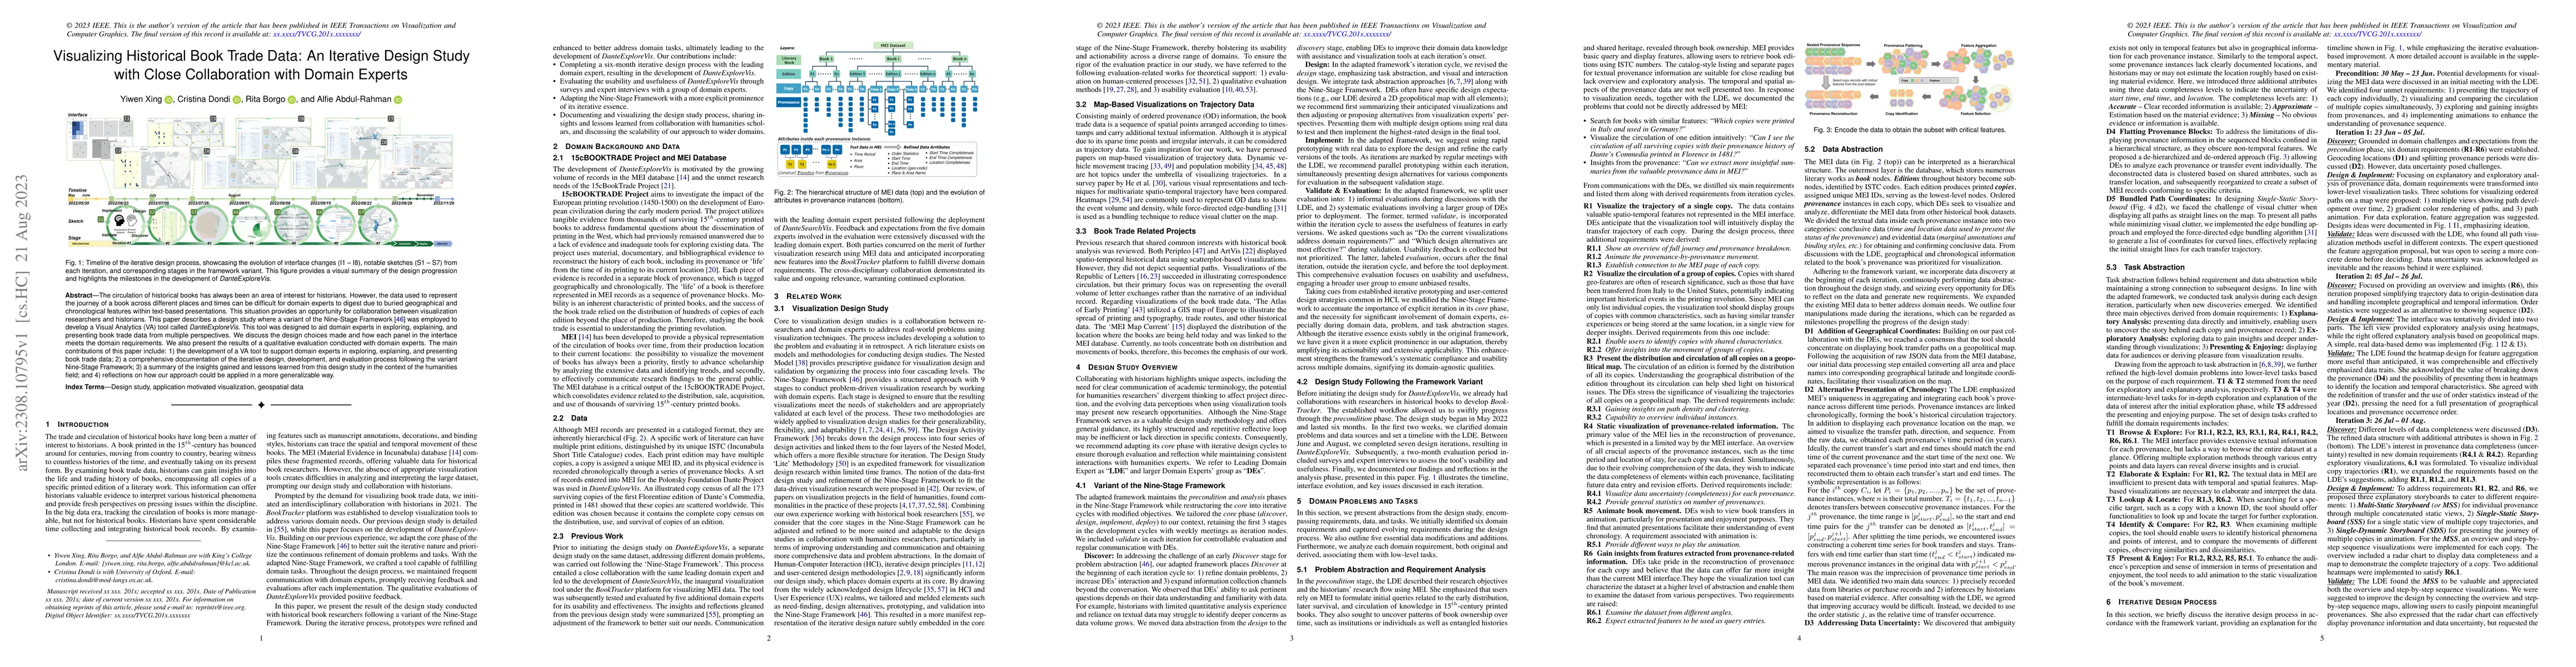
The circulation of historical books has always been an area of interest for historians. However, the data used to represent the journey of a book across different places and times can be difficult f...
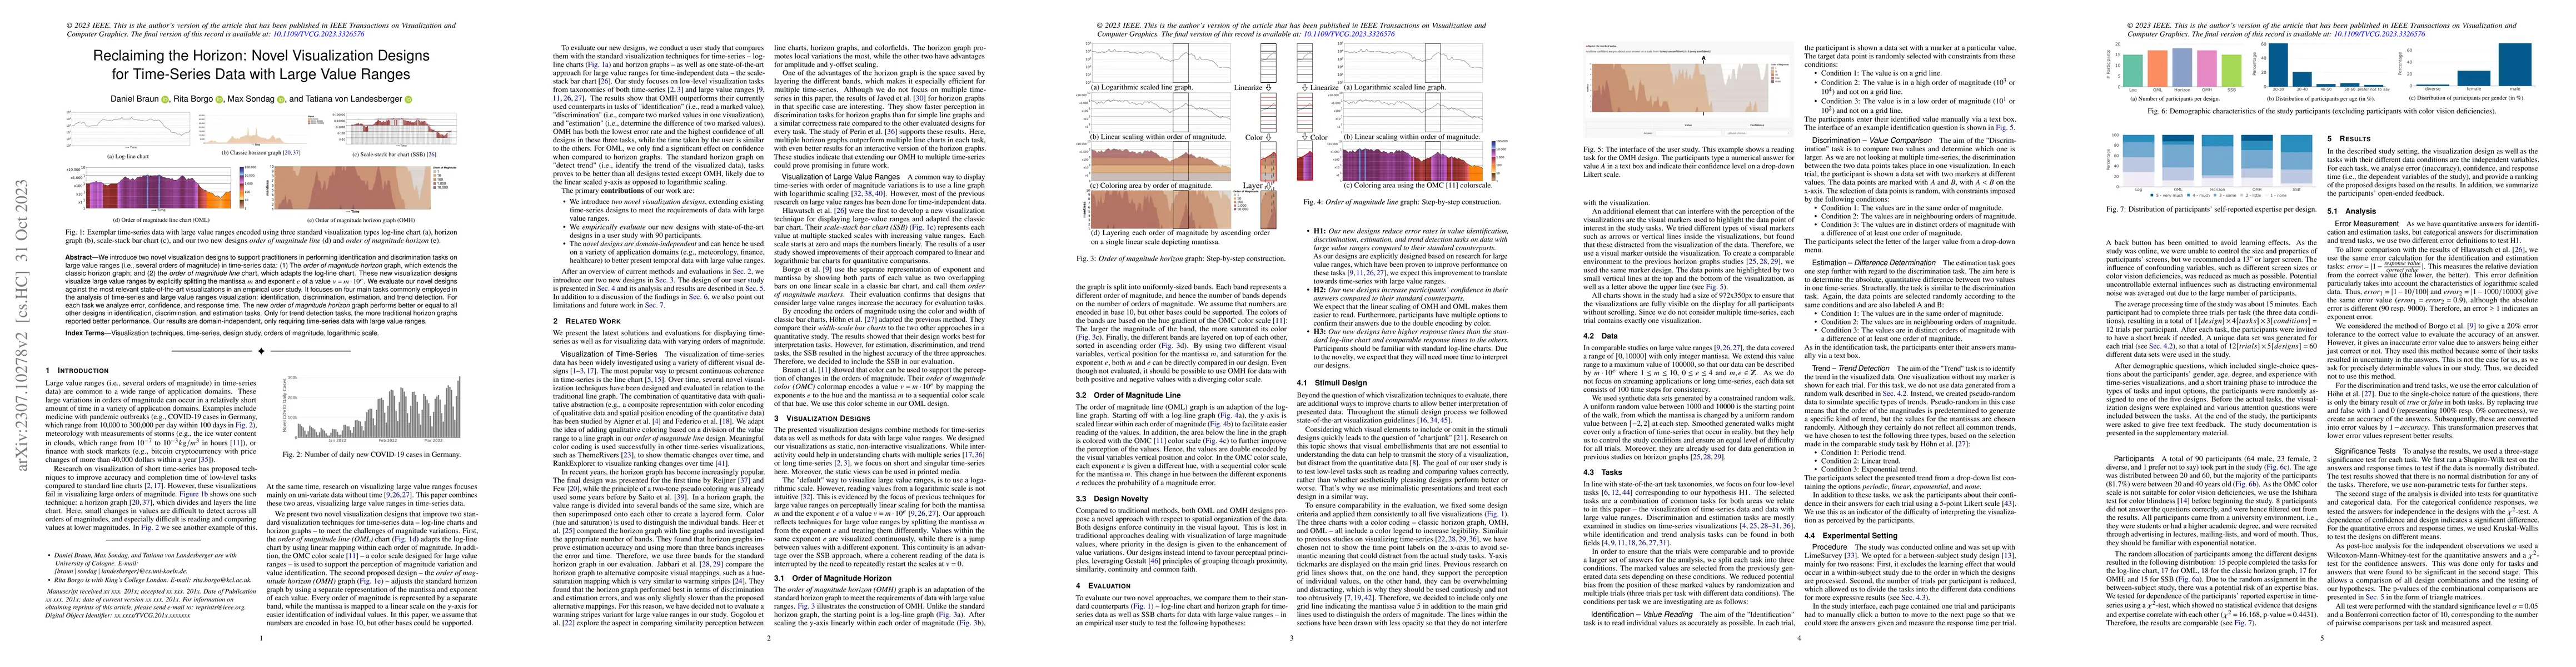
We introduce two novel visualization designs to support practitioners in performing identification and discrimination tasks on large value ranges (i.e., several orders of magnitude) in time-series d...
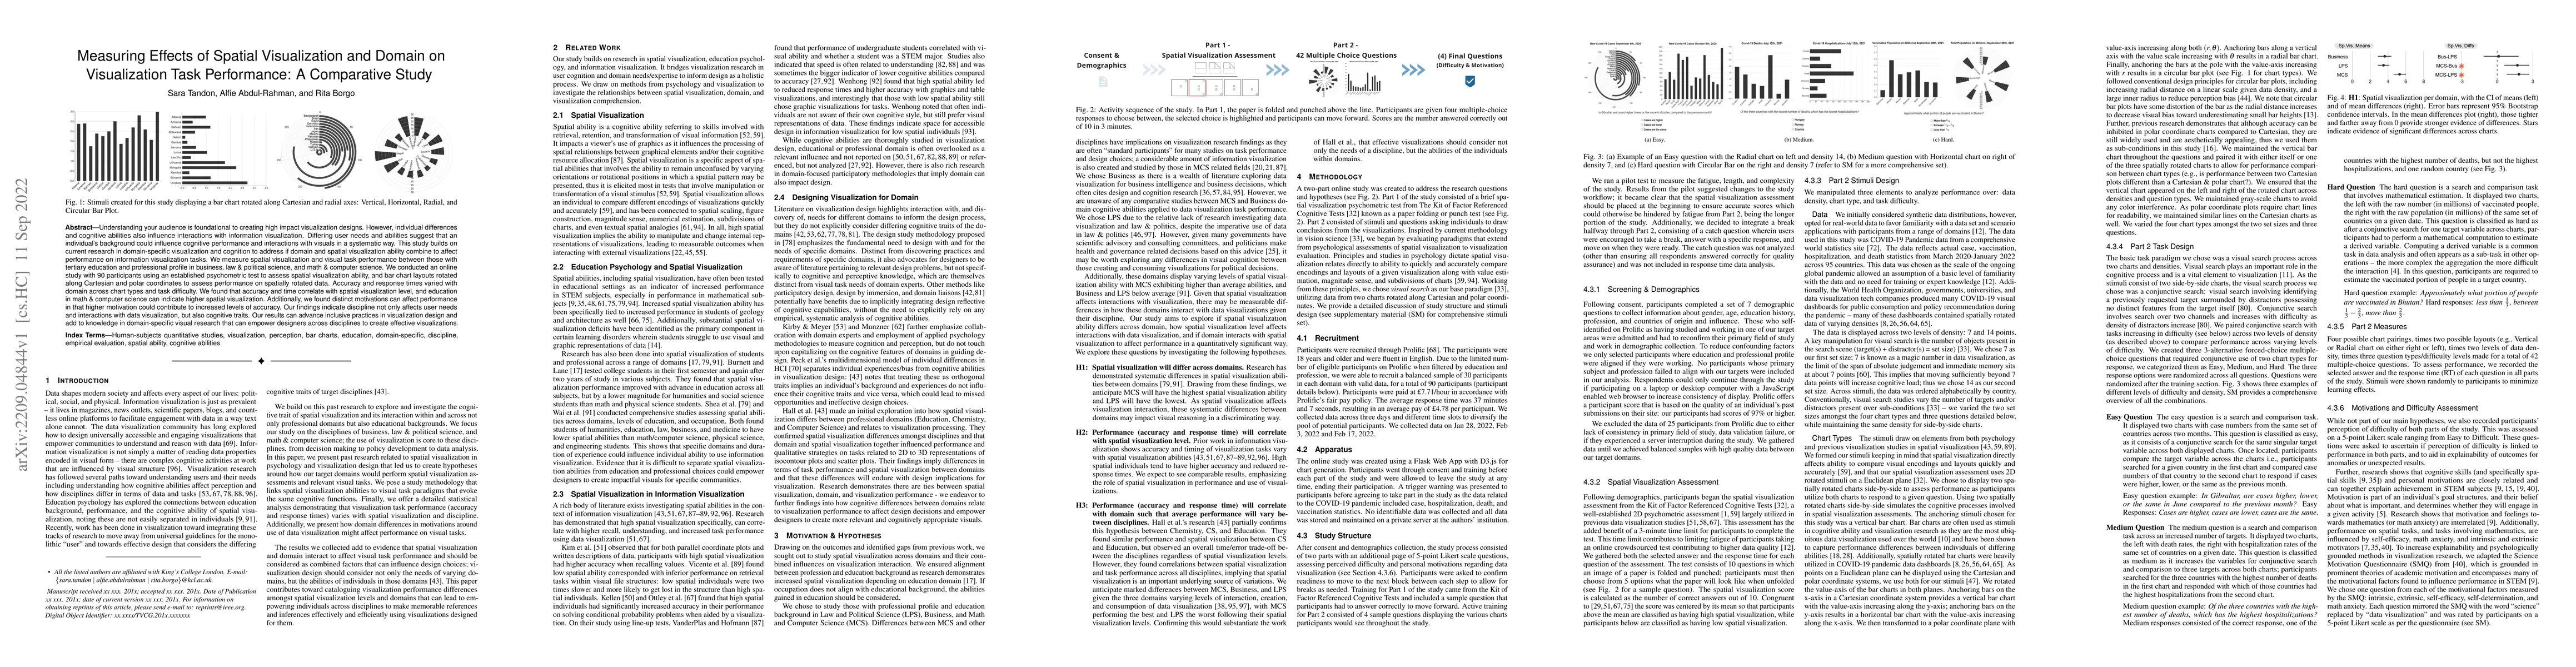
Understanding your audience is foundational to creating high impact visualization designs. However, individual differences and cognitive abilities also influence interactions with information visual...
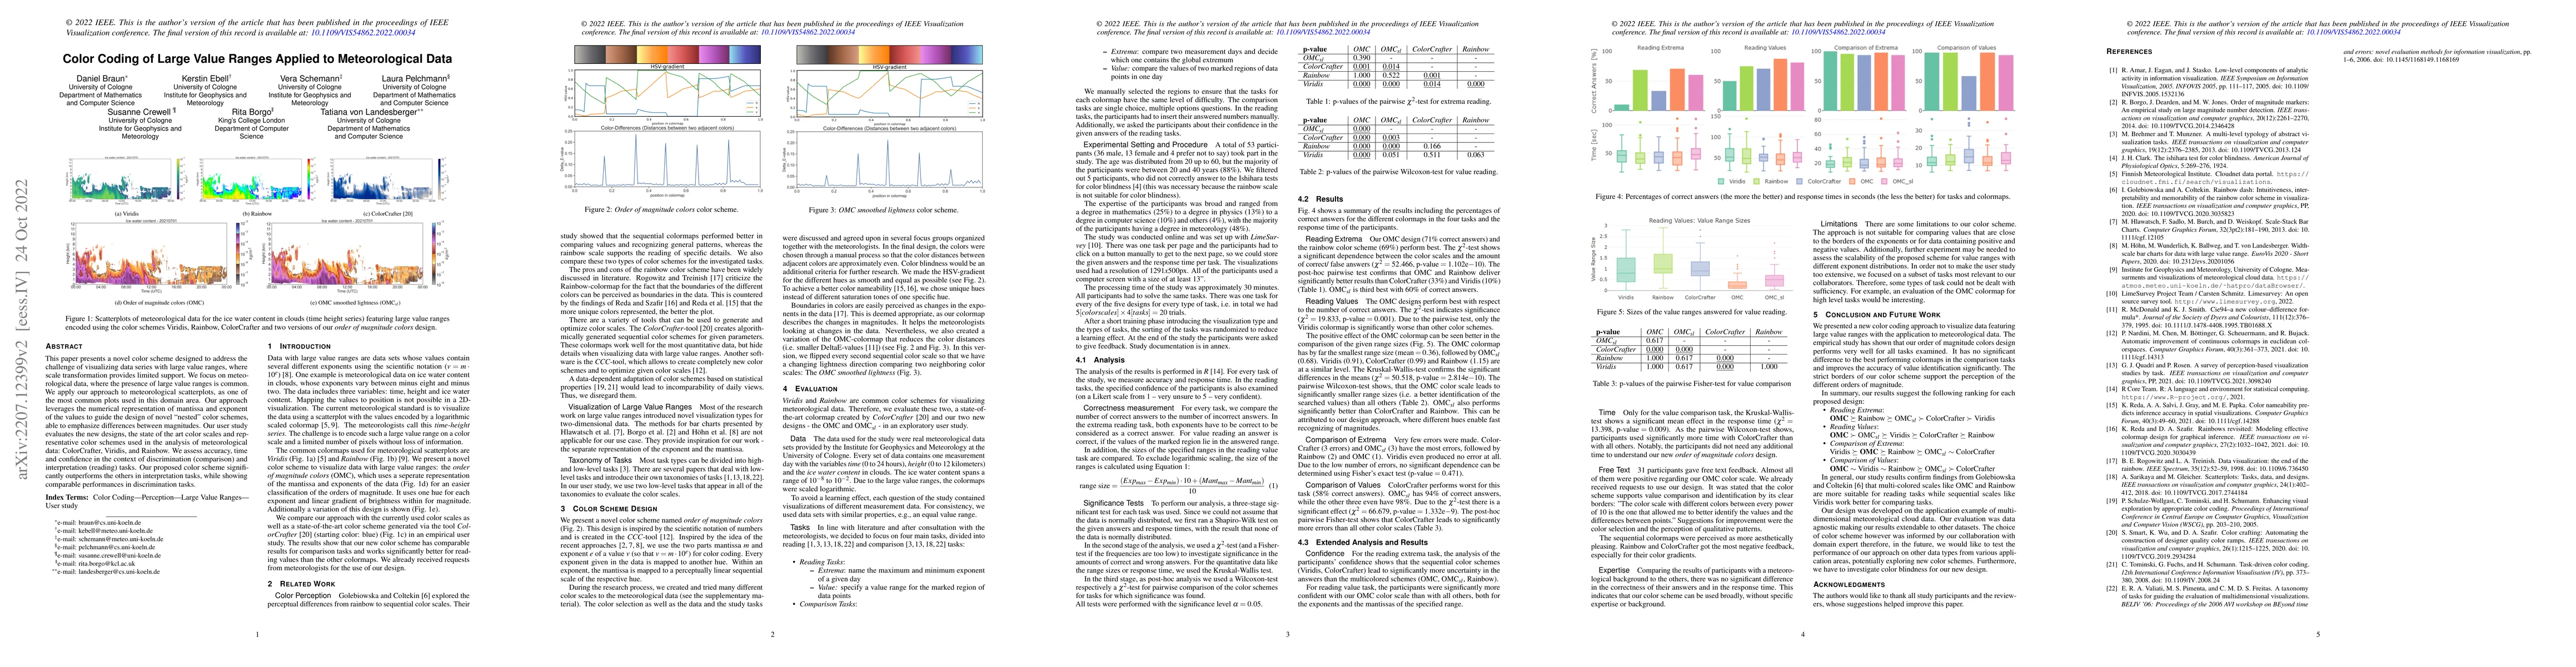
This paper presents a novel color scheme designed to address the challenge of visualizing data series with large value ranges, where scale transformation provides limited support. We focus on meteor...
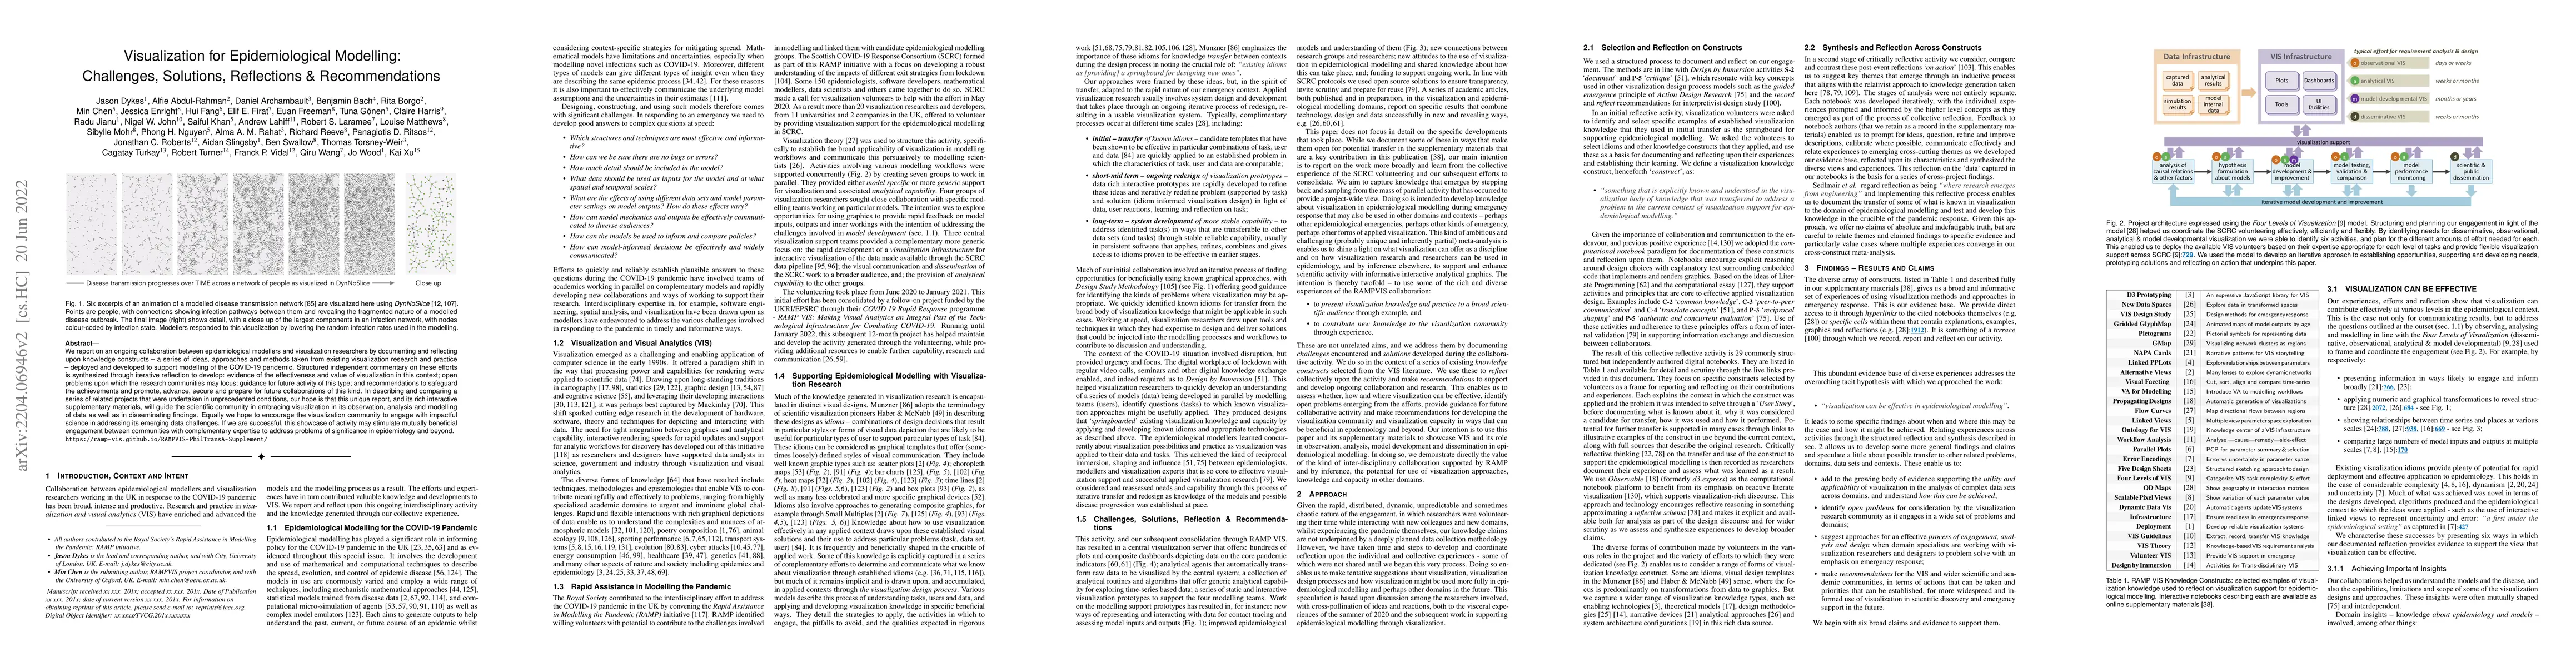
We report on an ongoing collaboration between epidemiological modellers and visualization researchers by documenting and reflecting upon knowledge constructs -- a series of ideas, approaches and met...
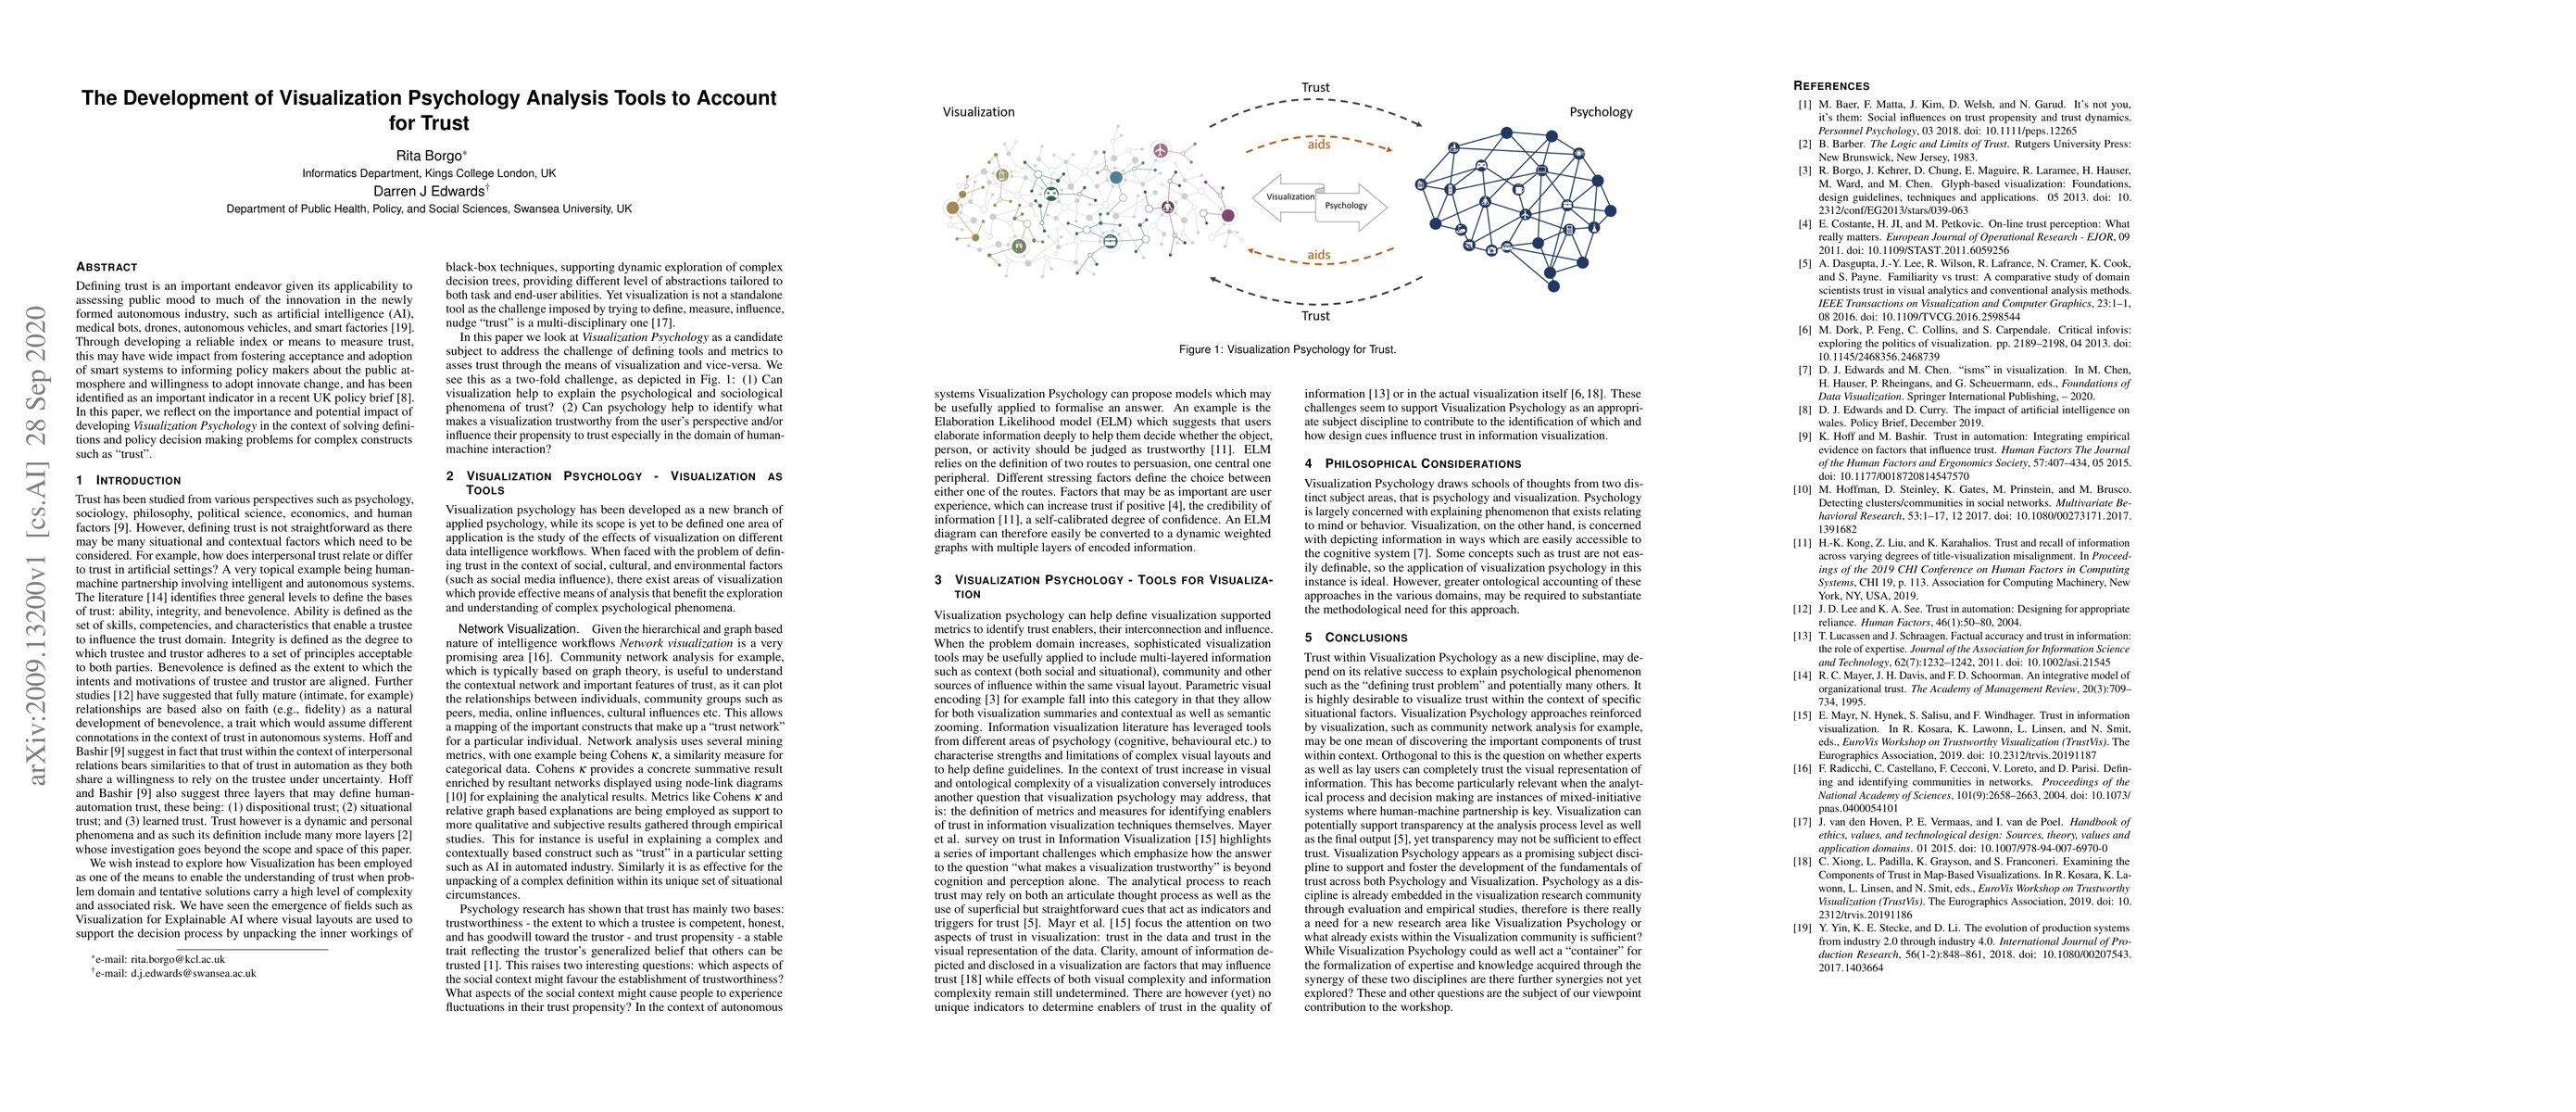
Defining trust is an important endeavor given its applicability to assessing public mood to much of the innovation in the newly formed autonomous industry, such as artificial intelligence (AI),medic...
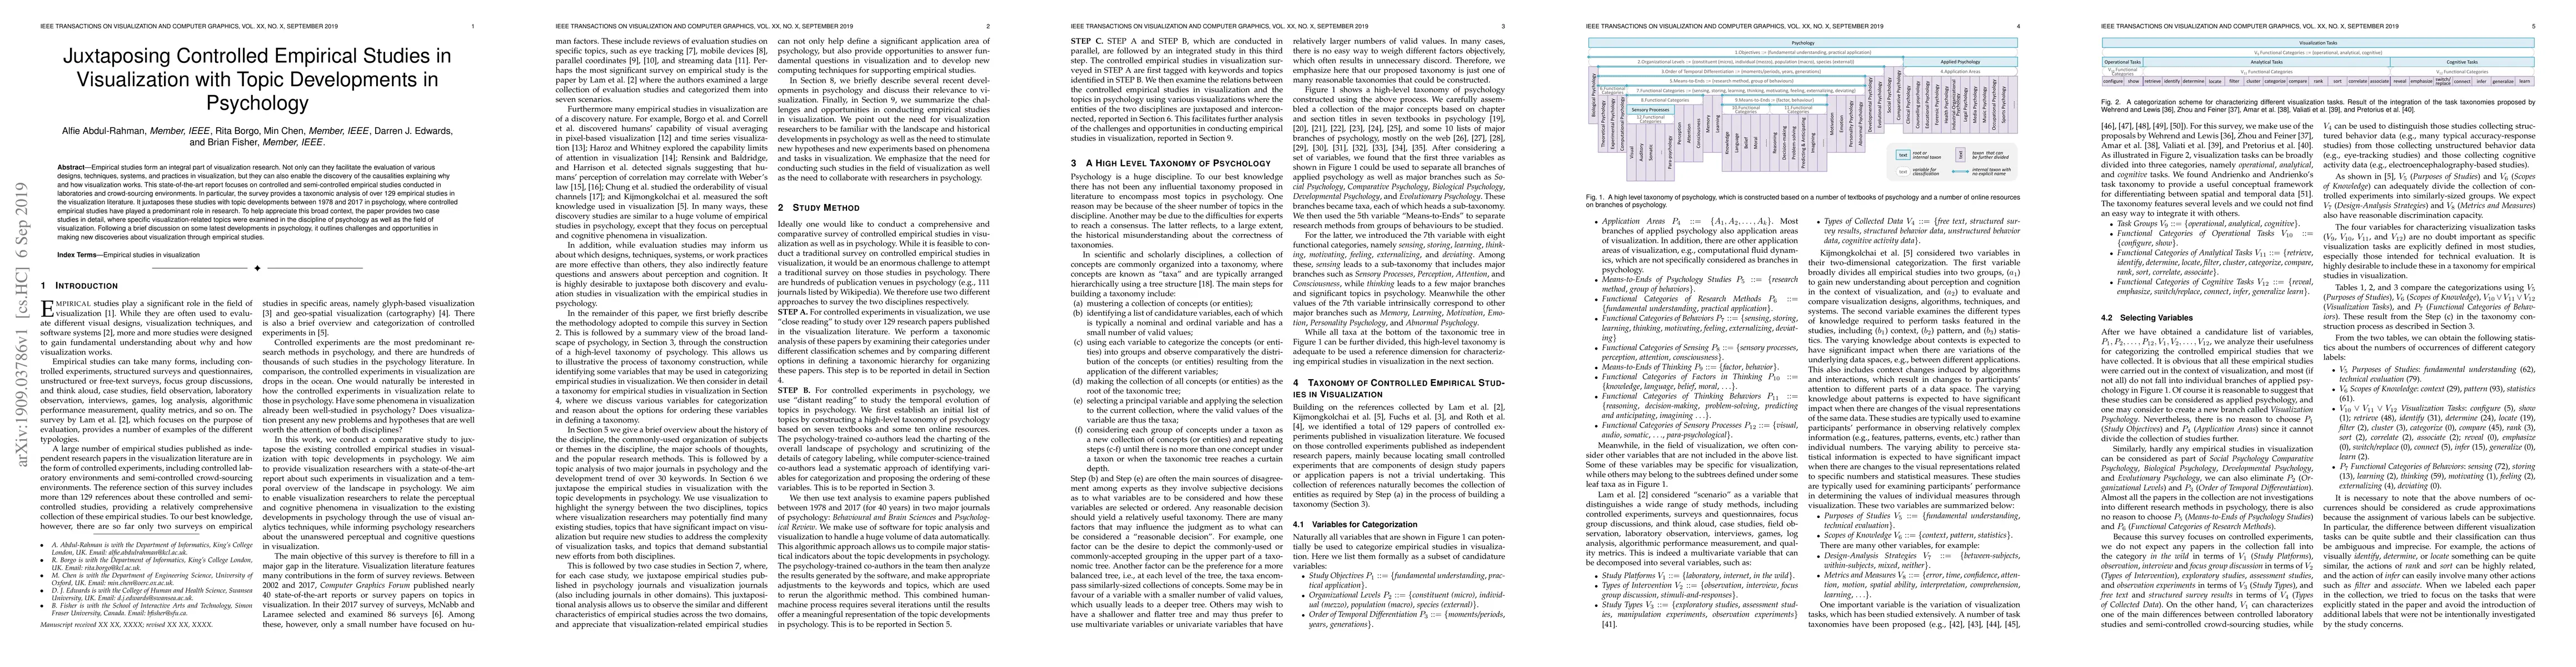
Empirical studies form an integral part of visualization research. Not only can they facilitate the evaluation of various designs, techniques, systems, and practices in visualization, but they can a...
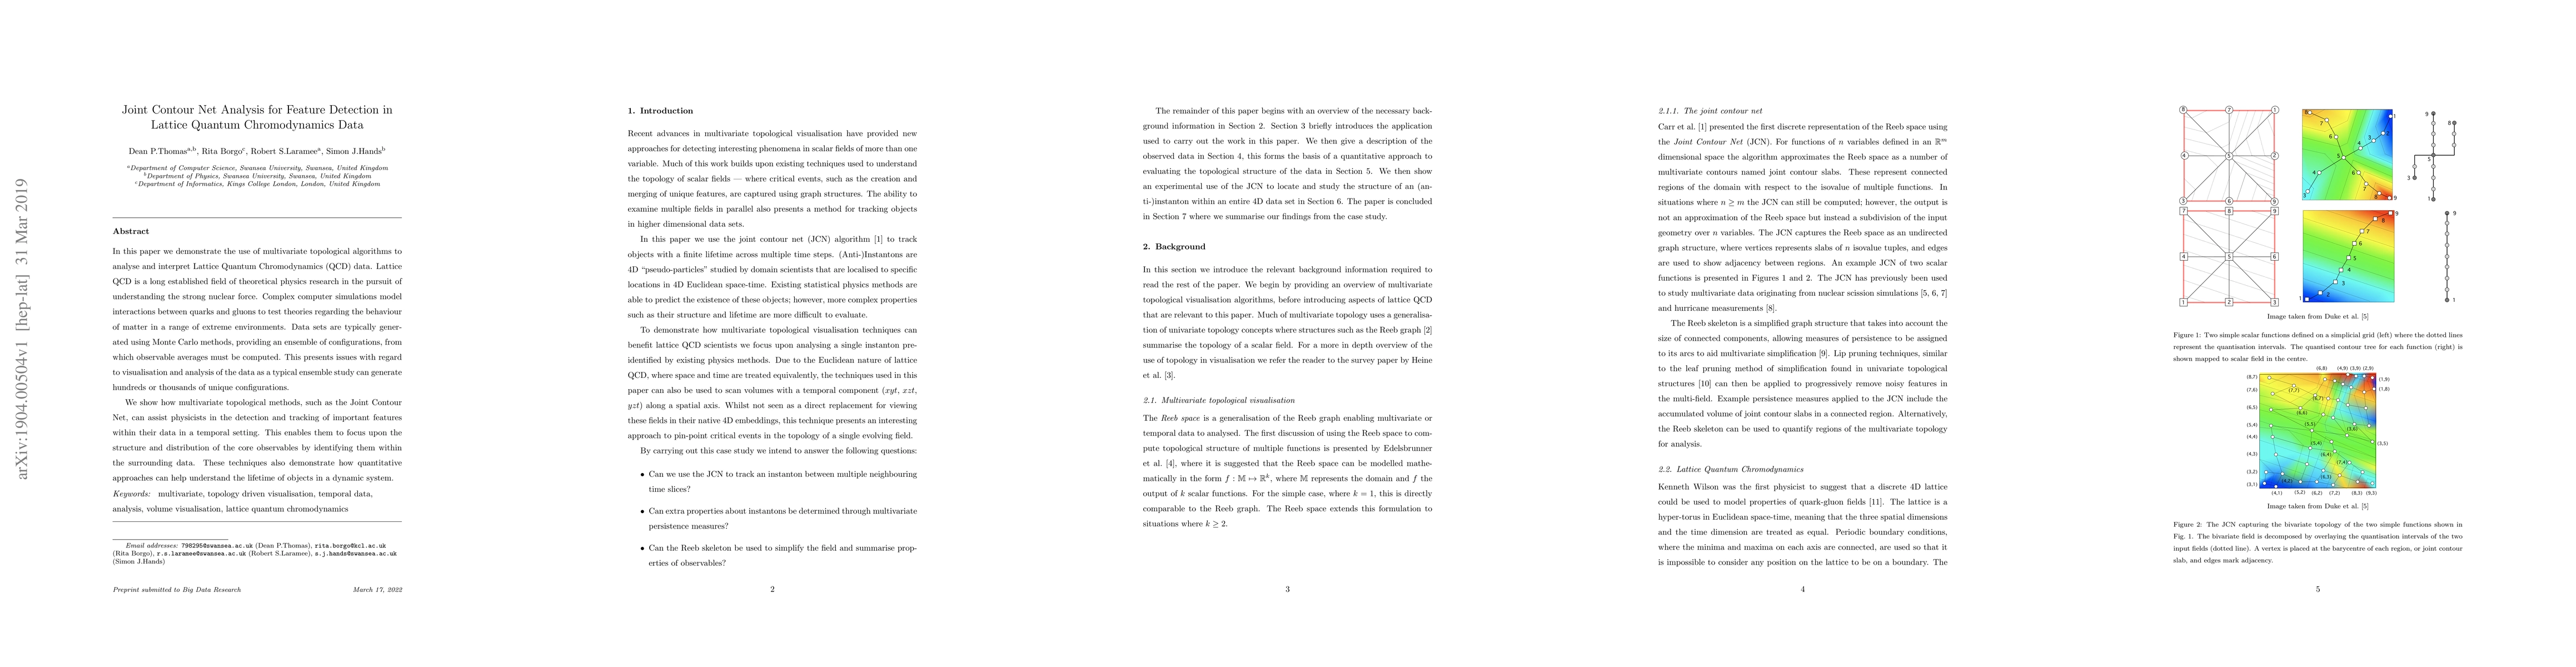
In this paper we demonstrate the use of multivariate topological algorithms to analyse and interpret Lattice Quantum Chromodynamics (QCD) data. Lattice QCD is a long established field of theoretical...
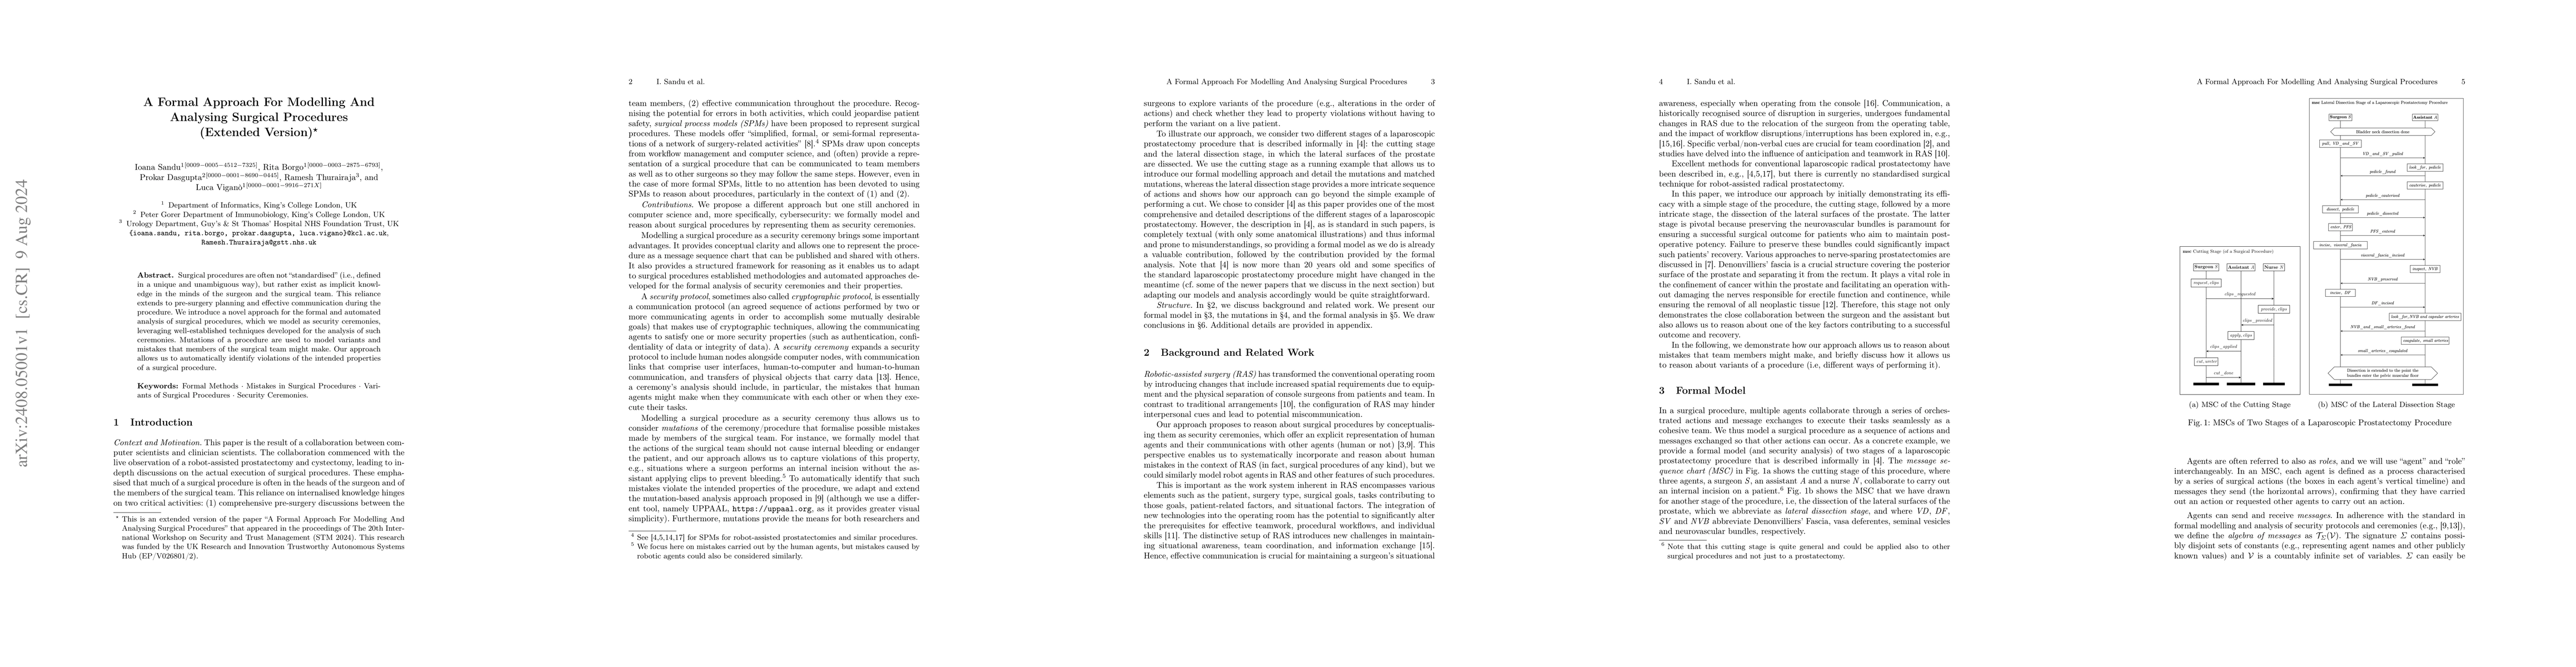
Surgical procedures are often not "standardised" (i.e., defined in a unique and unambiguous way), but rather exist as implicit knowledge in the minds of the surgeon and the surgical team. This relianc...
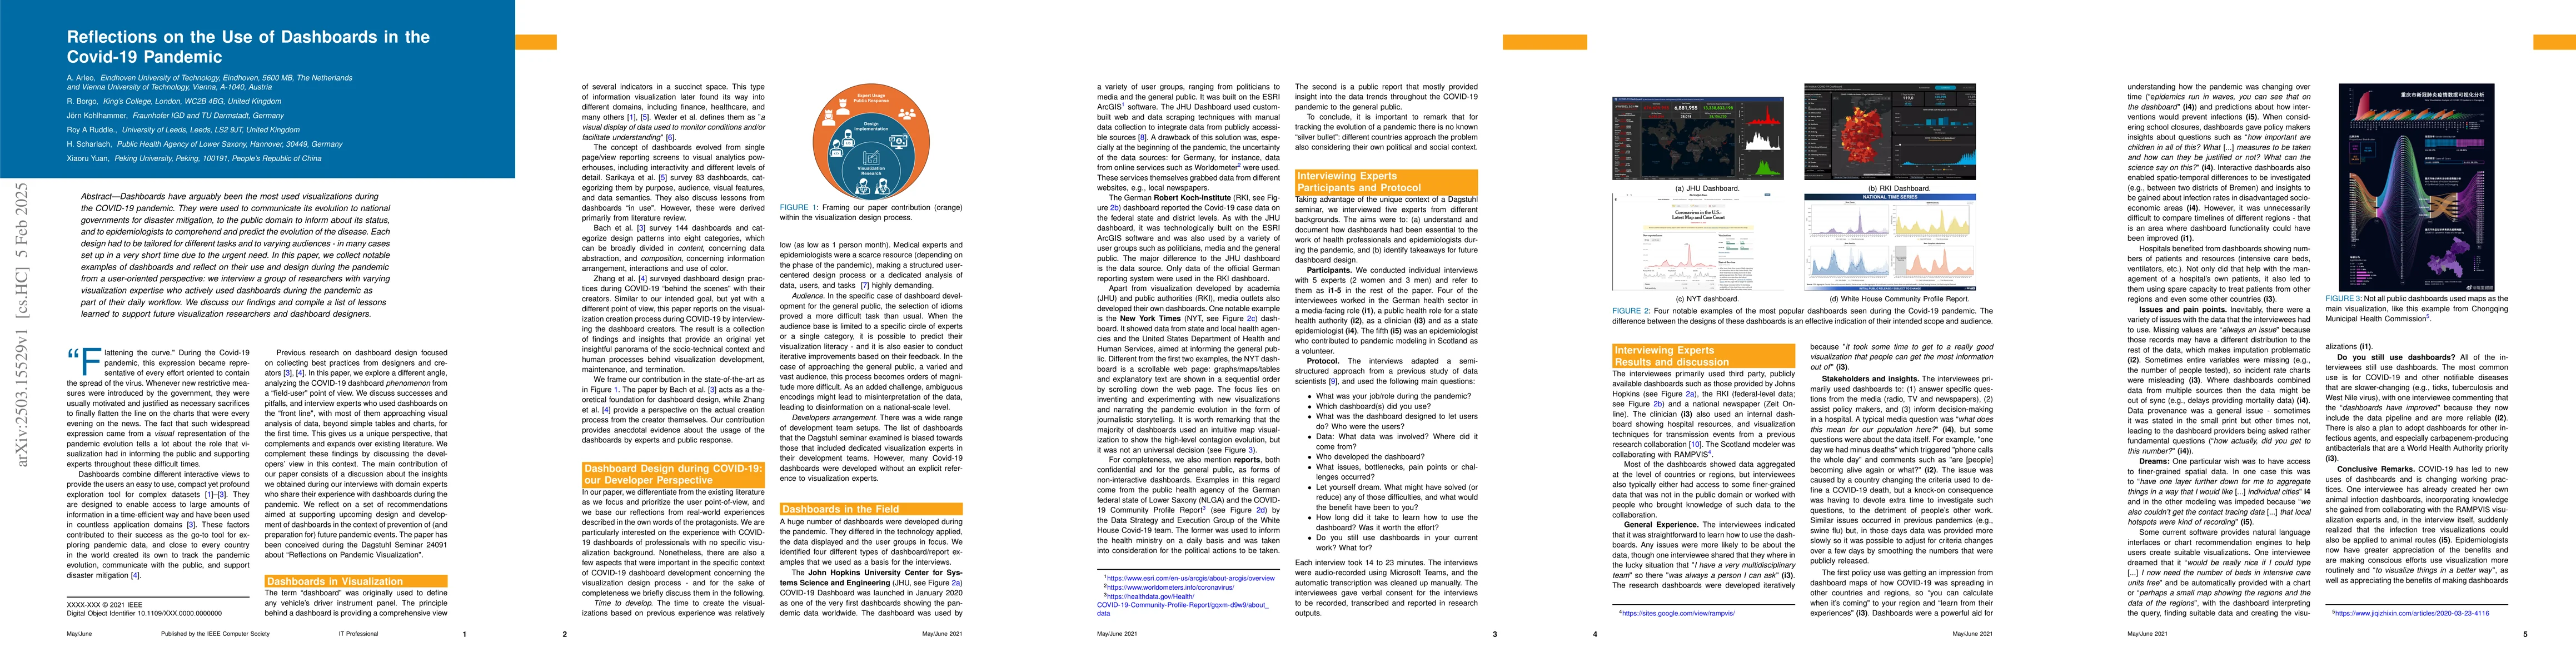
Dashboards have arguably been the most used visualizations during the COVID-19 pandemic. They were used to communicate its evolution to national governments for disaster mitigation, to the public doma...
Innovative HealthTech teams develop Artificial Intelligence (AI) systems in contexts where ethical expectations and organizational priorities must be balanced under severe resource constraints. While ...
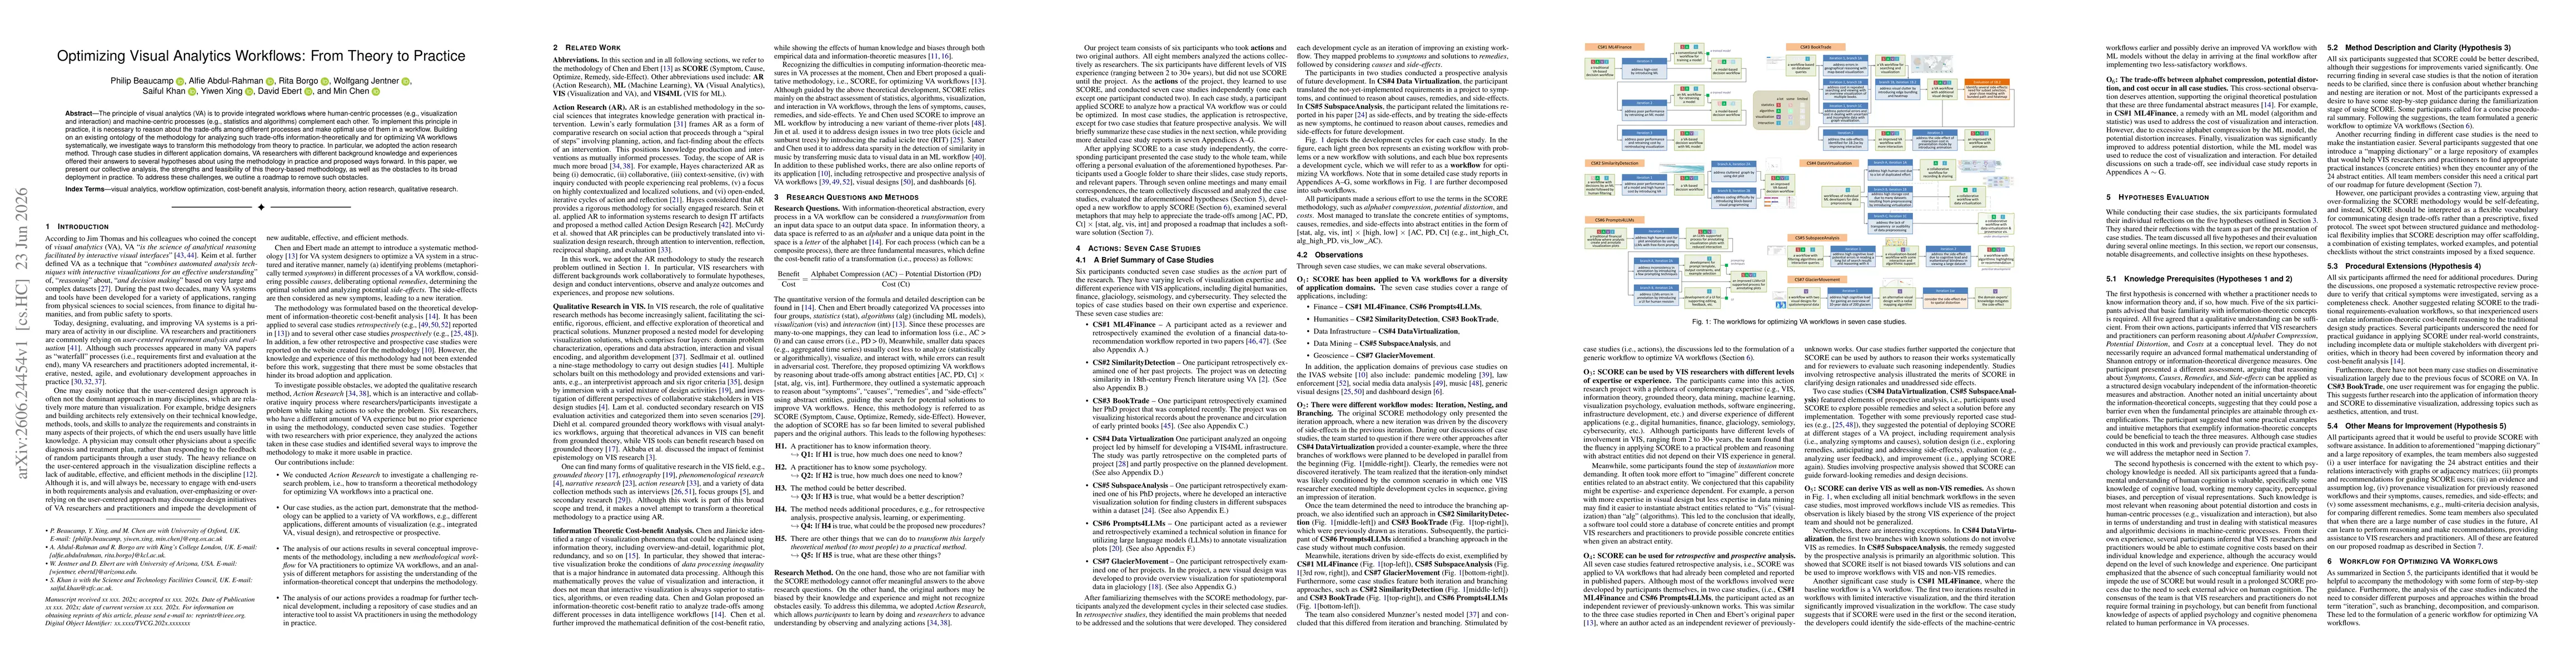
The principle of visual analytics (VA) is to provide integrated workflows where human-centric processes (e.g., visualization and interaction) and machine-centric processes (e.g., statistics and algori...