This paper details the iterative design and development of a Visual Analytics tool, DanteExploreVis, to assist historians in exploring historical book trade data, and documents the collaborative process with domain experts, providing insights and lessons for future humanities research.
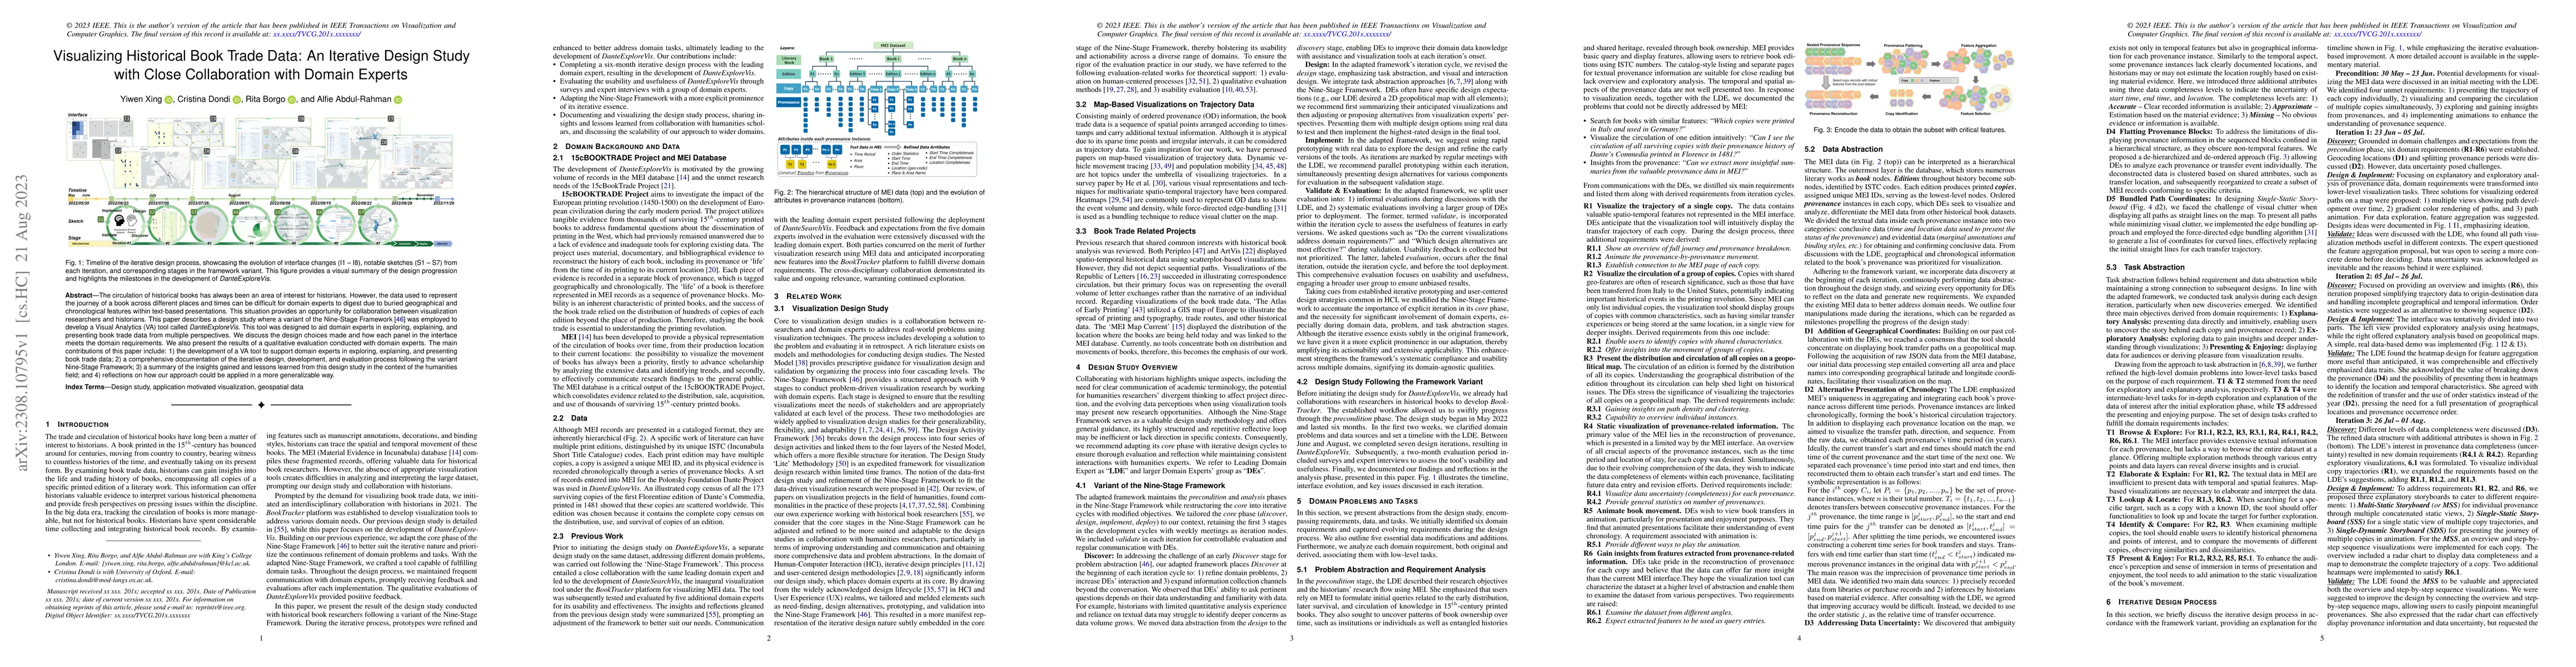
The circulation of historical books has always been an area of interest for historians. However, the data used to represent the journey of a book across different places and times can be difficult for domain experts to digest due to buried geographical and chronological features within text-based presentations. This situation provides an opportunity for collaboration between visualization researchers and historians. This paper describes a design study where a variant of the Nine-Stage Framework was employed to develop a Visual Analytics (VA) tool called DanteExploreVis. This tool was designed to aid domain experts in exploring, explaining, and presenting book trade data from multiple perspectives. We discuss the design choices made and how each panel in the interface meets the domain requirements. We also present the results of a qualitative evaluation conducted with domain experts. The main contributions of this paper include: 1) the development of a VA tool to support domain experts in exploring, explaining, and presenting book trade data; 2) a comprehensive documentation of the iterative design, development, and evaluation process following the variant Nine-Stage Framework; 3) a summary of the insights gained and lessons learned from this design study in the context of the humanities field; and 4) reflections on how our approach could be applied in a more generalizable way.
Get AI-generated insights about this paper's methodology, results, and significance.
Current paper (gray), citations (green), references (blue)
No similar papers found for this research.
No citations found for this paper.
Title | Authors | Year | Actions |
---|---|---|---|
CohortVA: A Visual Analytic System for Interactive Exploration of Cohorts based on Historical Data
|
Wei Zhang, Jason K. Wong, Xumeng Wang, Youcheng Gong, Rongchen Zhu, Kai Liu, Zihan Yan, Siwei Tan, Huamin Qu, Siming Chen, Wei Chen
|
2022
|
View Paper |
Exploring the Usability of the German COVID-19 Contact Tracing App in a Combined Eye Tracking and Retrospective Think Aloud Study
|
Michael Winter, H. Baumeister, Ulrich Frick, Miles Tallon, M. Reichert, R. Pryss
|
2021
|
View Paper |
Interview and Think Aloud Accessibility for Deaf and Hard of Hearing Participants in Design Research
|
Becca Dingman, Garreth W. Tigwell, Kristen Shinohara
|
2021
|
View Paper |
Small Data and Process in Data Visualization: The Radical Translations Case Study
|
Arianna Ciula, Miguel Vieira, Ginestra Ferraro, Tiffany Ong, S. Perovic, Rosa Mucignat, Niccolò Valmori, Brecht Deseure, E. Mannucci
|
2021
|
View Paper |
Uncertainty-aware Topic Modeling Visualization
|
Valerie Müller, Christian Sieg, L. Linsen
|
2021
|
View Paper |
IRVINE: A Design Study on Analyzing Correlation Patterns of Electrical Engines
|
Joscha Eirich, Jakob Bonart, Dominik Jackle, M. Sedlmair, Ute Schmid, K. Fischbach, Tobias Schreck, J. Bernard
|
2021
|
View Paper |
Visualizing a Large Spatiotemporal Collection of Historic Photography with a Generous Interface
|
T. Arnold, Nathaniel Ayers, J. Madron, Robert K. Nelson, L. Tilton
|
2020
|
View Paper |
Externalizing Transformations of Historical Documents: Opportunities for Provenance-Driven Visualization
|
T. Vancisin, M. Orr, Uta Hinrichs
|
2020
|
View Paper |
Data-First Visualization Design Studies
|
Michael Oppermann, T. Munzner
|
2020
|
View Paper |
Design Study "Lite" Methodology: Expediting Design Studies and Enabling the Synergy of Visualization Pedagogy and Social Good
|
Uzma Haque Syeda, Prasanth Murali, L. Roe, B. Berkey, M. Borkin
|
2020
|
View Paper |
A User-Centered Design Study in Scientific Visualization Targeting Domain Experts
|
Yucong Ye, F. Sauer, K. Ma, Aditya Konduri, Jacqueline H. Chen
|
2019
|
View Paper |
IDMVis: Temporal Event Sequence Visualization for Type 1 Diabetes Treatment Decision Support
|
Yixuan Zhang, Kartik Chanana, Cody Dunne
|
2019
|
View Paper |
Visualization of Urban Mobility Data from Intelligent Transportation Systems
|
Thiago Sobral, Teresa Galvão, J. Borges
|
2019
|
View Paper |
ViTFlow: A platform to visualize tourists flows in a rich interactive map-based interface
|
D. Redin, Diogo Vilela, N. Nunes, M. Ribeiro, Catia Prandi
|
2017
|
View Paper |
Sampling and Sampling Methods
|
I. Etikan, K. Bala
|
2017
|
View Paper |
Lineage: Visualizing Multivariate Clinical Data in Genealogy Graphs
|
C. Nobre, Nils Gehlenborg, H. Coon, A. Lex
|
2017
|
View Paper |
Historical Research in a Digital Age: Reflections from the Mapping the Republic of Letters ProjectHistorical Research in a Digital Age
|
D. Edelstein, P. Findlen, Giovanna Ceserani, C. Winterer, Nicole Coleman
|
2017
|
View Paper |
Classifying multidimensional trajectories of neighbourhood change: a self-organizing map and k-means approach
|
Chenjun Ling, E. Delmelle
|
2016
|
View Paper |
TrajGraph: A Graph-Based Visual Analytics Approach to Studying Urban Network Centralities Using Taxi Trajectory Data
|
Xiaoke Huang, Ye Zhao, Chao Ma, J. Yang, X. Ye, Chong Zhang
|
2016
|
View Paper |
Peripleo: a tool for exploring heterogenous data through the dimensions of space and time
|
Rainer Simon, L. Isaksen, Elton T. E. Barker, Pau de Soto Cañamares
|
2016
|
View Paper |
Exploring principles of user-centered agile software development: A literature review
|
Manuel Brhel, Hendrik Meth, A. Maedche, K. Werder
|
2015
|
View Paper |
Visualization Analysis and Design
|
T. Munzner
|
2014
|
View Paper |
Overview: The Design, Adoption, and Analysis of a Visual Document Mining Tool for Investigative Journalists
|
M. Brehmer, S. Ingram, J. Stray, T. Munzner
|
2014
|
View Paper |
Design Activity Framework for Visualization Design
|
2014
|
||
User Centered Design
|
Nara L. Newcomer, David Lindahl, Kelley Martin
|
2014
|
View Paper |
ArtVis: combining advanced visualisation and tangible interaction for the exploration, analysis and browsing of digital artwork collections
|
Bruno Dumas, Bram Moerman, Sandra Trullemans, B. Signer
|
2014
|
View Paper |
A Multi-Level Typology of Abstract Visualization Tasks
|
M. Brehmer, T. Munzner
|
2013
|
View Paper |
Handbook of Human Centric Visualization
|
Weidong Huang
|
2013
|
View Paper |
Design Study Methodology: Reflections from the Trenches and the Stacks
|
M. Sedlmair, Miriah D. Meyer, T. Munzner
|
2012
|
View Paper |
A guide to reporting scientific evaluation in visualization
|
C. Forsell, M. Cooper
|
2012
|
View Paper |
User-Centered Design and Agile Methods: A Systematic Review
|
T. Silva, Angela Martin, F. Maurer, M. Silveira
|
2011
|
View Paper |
A Nested Model for Visualization Design and Validation
|
T. Munzner
|
2009
|
View Paper |
Force‐Directed Edge Bundling for Graph Visualization
|
Danny Holten, J. V. Wijk
|
2009
|
View Paper |
Sketching User Experiences: Getting the Design Right and the Right Design
|
B. Buxton
|
2007
|
View Paper |
Evaluating Visualizations: Do Expert Reviews Work?
|
Melanie Tory, Torsten Möller
|
2005
|
View Paper |
Visualizing Demographic Trajectories with Self-Organizing Maps
|
A. Skupin, R. Hagelman
|
2005
|
View Paper |
Usability for the Web: Designing Web Sites that Work
|
Tom Brinck, Darren Gergle, S. Wood
|
2001
|
View Paper |
The usability engineering lifecycle
|
Deborah J. Mayhew
|
1998
|
View Paper |
A Description of Think Aloud Method and Protocol Analysis
|
M. Fonteyn, B. Kuipers, S. Grobe
|
1993
|
View Paper |
A Design Study of Visualizing Historical Book Movement
|
Y. Xing, C. Dondi, R. Borgo, Alfie Abdul-Rahman
|
2022
|
View Paper |
MEI map
|
2021
|
||
Leaflet: A JavaScript library for interactive maps
|
2021
|
||
React-leaflet-ant-path
|
2021
|
||
From the 15cBOOKTRADE Project website
|
2021
|
||
The Atlas of Early Printing
|
2021
|
||
Variable-Based Spatiotemporal Trajectory Data Visualization Illustrated
|
Jing He, Haonan Chen, Yijin Chen, Xinming Tang, Yebin Zou
|
2019
|
View Paper |
Integrating Human-Computer Interaction Development into the Systems Development Life Cycle : A Methodology
|
Ping Zhang
|
2018
|
View Paper |
Vitflow: a 10 © 2023 IEEE
|
2017
|
||
Design prototyping methods: state of the art in strategies, techniques, and guidelines. Design Science, 3:e13
|
2017
|
||
Why visualization? : task abstraction for analysis and design
|
M. Brehmer
|
2016
|
View Paper |
Comparison of Convenience Sampling and Purposive Sampling
|
I. Etikan, Sulaiman Abubakar Musa, R. Alkassim
|
2016
|
View Paper |
Usability Engineering
|
John Millar Carroll, M. Rosson
|
2014
|
View Paper |
Comparing Three Designs of Macro-Glyphs for Poetry Visualization
|
Alfie Abdul-Rahman, E. Maguire, Min Chen
|
2014
|
View Paper |
"IScBooktrade''. An evidence-based assessment and visualization of the distribution, sale and reception of printed books in the Renaissance
|
C. Dondi
|
2013
|
View Paper |
Material Evidence in Incunabula
|
A. Ledda, C. Dondi
|
2011
|
View Paper |
D3.js -data-driven documents
|
2011
|
||
Visualizing the Republic of Letters
|
Daniel T. Chang, Yu Ge, Shiwei Song, Nicole Coleman, Jon Christensen, Jeffrey Heer, Stanford
|
2009
|
View Paper |
Qualtrics
|
2005
|
||
Communications of the Association for Information Systems
|
Hugh J. Watson, Rui Dinis Sousa, I. Junglas
|
2000
|
View Paper |
, San Francisco, CA, USA
|
1994
|
||
City Research Online
|
View Paper | ||
International Journal of Geographical Information Science Visual Analytics of Spatial Interaction Patterns for Pandemic Decision Support Visual Analytics of Spatial Interaction Patterns for Pandemic Decision Support
|
D. Guo
|
View Paper |
Showing first page preview. Click "Open Full PDF" to view the complete paper.
Your comment contains inappropriate language and has been rejected.
Are you sure you want to remove this tag? This action cannot be undone.
Someone just favorited a paper!
Comments (0)