ArxivLens
ArXiv cs.HC cs.CV cs.GR

Reclaiming the Horizon: Novel Visualization Designs for Time-Series Data with Large Value Ranges

Daniel Braun, Max Sondag, Rita Borgo, Tatiana von Landesberger

2307.10278 IEEE Transactions on Visualization and Computer Graphics (2023) DOI: 10.1109/TVCG.2023.3326576 Published Nov 1, 2023
View PDF

Publication

Published: Nov 01, 2023
Categories: cs.HC, cs.CV, cs.GR

Metrics

Source: ArXiv

AI Quick Summary

This paper introduces two novel visualization designs—the order of magnitude horizon graph and the order of magnitude line chart—to effectively manage large value ranges in time-series data. The study finds that these designs outperform existing methods in identification, discrimination, and estimation tasks, though traditional horizon graphs are superior for trend detection.

Quick Answers

What is "Reclaiming the Horizon: Novel Visualization Designs for Time-Series Data with Large Value Ranges" about?

This paper introduces two novel visualization designs—the order of magnitude horizon graph and the order of magnitude line chart—to effectively manage large value ranges in time-series data. The study finds that these designs outperform existing methods in identification, discrimination, and estimation tasks, though traditional horizon graphs are superior for trend detection.

What methodology did the authors use?

The research introduces two novel visualization designs for time-series data with large value ranges: the order of magnitude horizon graph (OMH) and the order of magnitude line chart (OML). These designs split the mantissa and exponent of a value, visualizing large value ranges effectively. More in Methodology →

What are the key results?

OMH and OML either significantly outperform or perform comparably to existing designs in identification, estimation, and discrimination tasks in terms of error, confidence, and response time. — The separation of mantissa and exponent, as demonstrated by OMH, is beneficial for the perception of values from large ranges, confirming previous works. More in Key Results →

Why is this work significant?

This research contributes to the field of data visualization by providing novel designs that effectively handle large value ranges in time-series data, improving accuracy, confidence, and response times for various analytical tasks. More in Significance →

What are the main limitations?

The designs are not well-suited for trend detection tasks. — There is room for improvement in the choice of colors for different orders of magnitude in OML. More in Limitations →

Paper Preview

Abstract

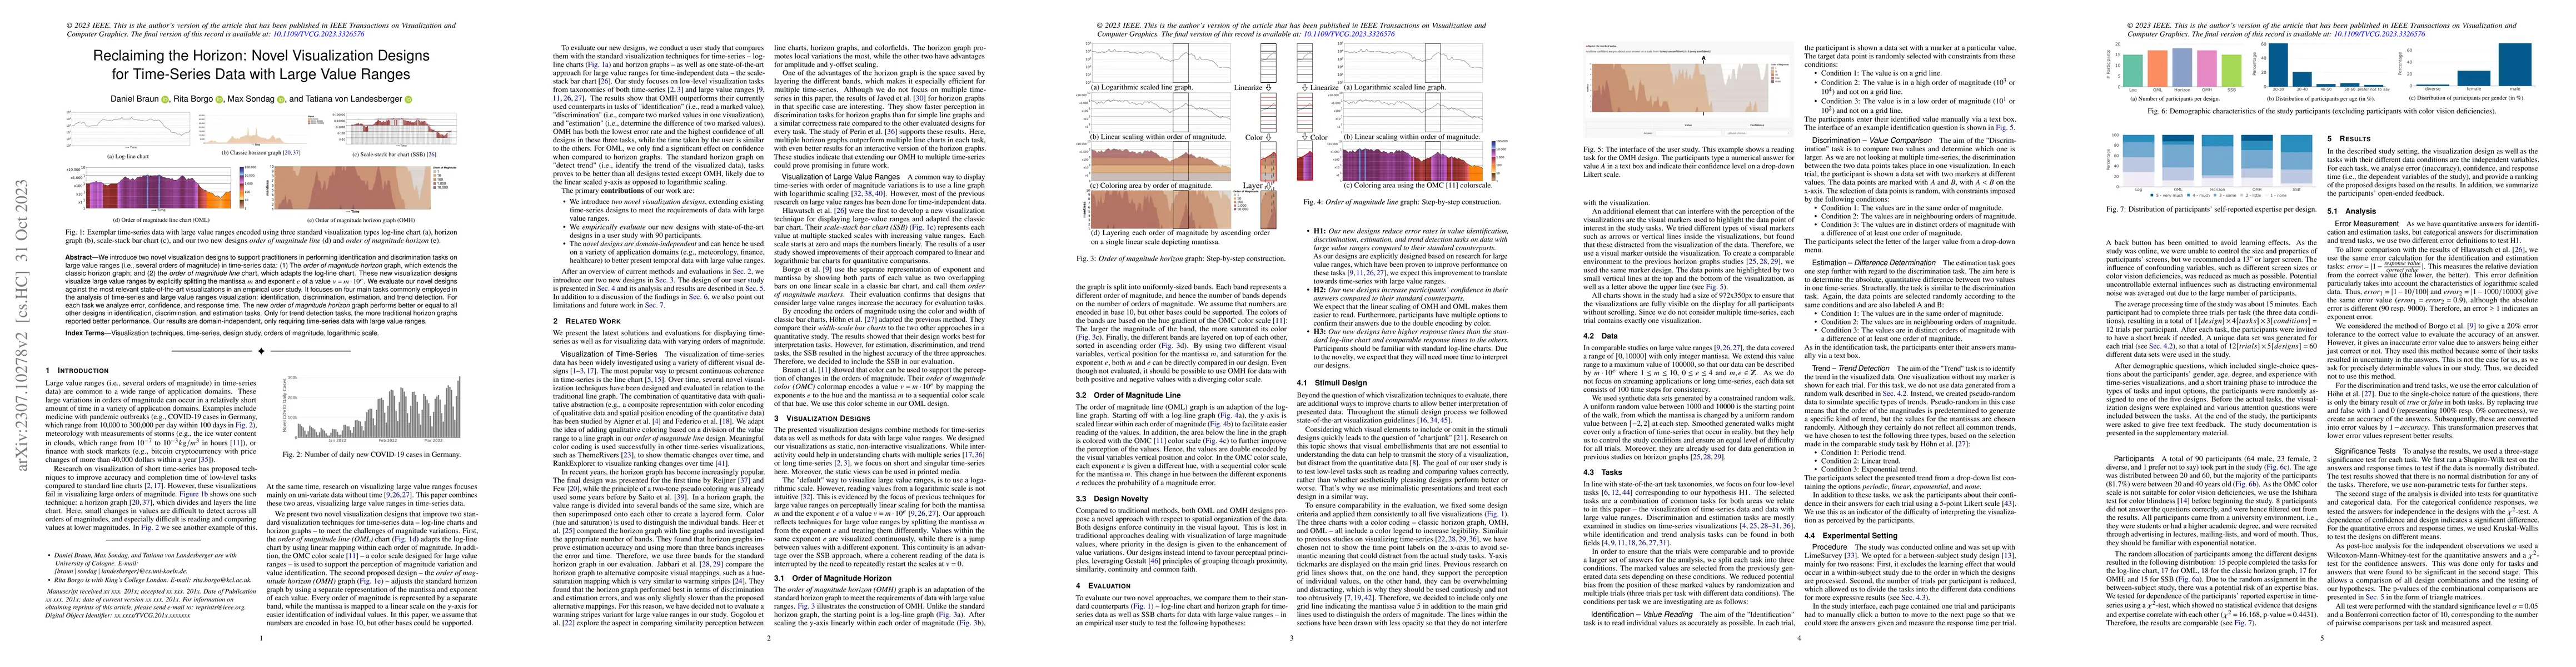
We introduce two novel visualization designs to support practitioners in performing identification and discrimination tasks on large value ranges (i.e., several orders of magnitude) in time-series data: (1) The order of magnitude horizon graph, which extends the classic horizon graph; and (2) the order of magnitude line chart, which adapts the log-line chart. These new visualization designs visualize large value ranges by explicitly splitting the mantissa m and exponent e of a value v = m * 10e . We evaluate our novel designs against the most relevant state-of-the-art visualizations in an empirical user study. It focuses on four main tasks commonly employed in the analysis of time-series and large value ranges visualization: identification, discrimination, estimation, and trend detection. For each task we analyse error, confidence, and response time. The new order of magnitude horizon graph performs better or equal to all other designs in identification, discrimination, and estimation tasks. Only for trend detection tasks, the more traditional horizon graphs reported better performance. Our results are domain-independent, only requiring time-series data with large value ranges.

Key Findings, in focus

Seven facets of this paper, analysed and brought into focus by AI.

AI-generated · verify against source Generated Sep 02, 2025
In focus · one-line synthesis

This research contributes to the field of data visualization by providing novel designs that effectively handle large value ranges in time-series data, improving accuracy, confidence, and response times for various analytical tasks.

01
MethodologyHow they did it

The research introduces two novel visualization designs for time-series data with large value ranges: the order of magnitude horizon graph (OMH) and the order of magnitude line chart (OML). These designs split the mantissa and exponent of a value, visualizing large value ranges effectively.

02
ResultsWhat they found
  • OMH and OML either significantly outperform or perform comparably to existing designs in identification, estimation, and discrimination tasks in terms of error, confidence, and response time.
  • The separation of mantissa and exponent, as demonstrated by OMH, is beneficial for the perception of values from large ranges, confirming previous works.
  • The classical horizon graph outperforms OMH and OML in trend detection tasks due to its linear axis scaling.
03
SignificanceWhy it matters

This research contributes to the field of data visualization by providing novel designs that effectively handle large value ranges in time-series data, improving accuracy, confidence, and response times for various analytical tasks.

04
Technical ContributionsWhat's new technically

The paper presents two novel visualization designs, OMH and OML, which effectively separate mantissa and exponent for handling large value ranges in time-series data.

05
NoveltyWhat sets it apart

The work builds upon previous research on visualizing large value ranges, confirming the benefits of separating mantissa and exponent, and introduces novel designs (OMH and OML) that outperform existing techniques in various analytical tasks.

06
LimitationsWhat to be cautious about
  • The designs are not well-suited for trend detection tasks.
  • There is room for improvement in the choice of colors for different orders of magnitude in OML.
  • OML charts show slower response times compared to log-line charts, which could be due to novelty or increased cognitive load.
07
Future WorkWhere it goes next
  • Develop an approach that works well for trend tasks and one or more of the other tasks.
  • Investigate the impact of color choices on performance in OML.
  • Explore the possibility of integrating interaction techniques to further enhance the effectiveness of visual encoding, especially for long time-series.

Impact

54
References
3
Influential

Paper Details

Paper ID: 2307.10278
Journal: IEEE Transactions on Visualization and Computer Graphics (2023)
License: http://arxiv.org/licenses/nonexclusive-distrib/1.0/
Comments: Preprint and Author Version of a Full Paper, accepted to the 2023 IEEE Visualization Conference (VIS)
Categories:
cs.HC cs.CV cs.GR

How to Cite This Paper

Reference manager: RIS EndNote

Key Terms

ranges (0.252)
designs (0.251)
discrimination (0.251)
horizon (0.236)
order magnitude (0.214)
time series (0.211)
magnitude (0.195)
identification (0.190)

Citation Network

Current paper (gray), citations (green), references (blue)

Display is limited for performance on very large graphs.

Current Paper
Citations
References
Click to view


Discussion 0

This website uses cookies to ensure you get the best experience. Learn more