Looking beyond the horizon: Evaluation of four compact visualization techniques for time series in a spatial context
Publication
Metrics
AI Quick Summary
Four visualization techniques for time series data in a spatial context are evaluated, with compact boxplots consistently performing well, while horizon graphs excel in maximum tasks but struggle with trend detection.
Paper Preview
Abstract
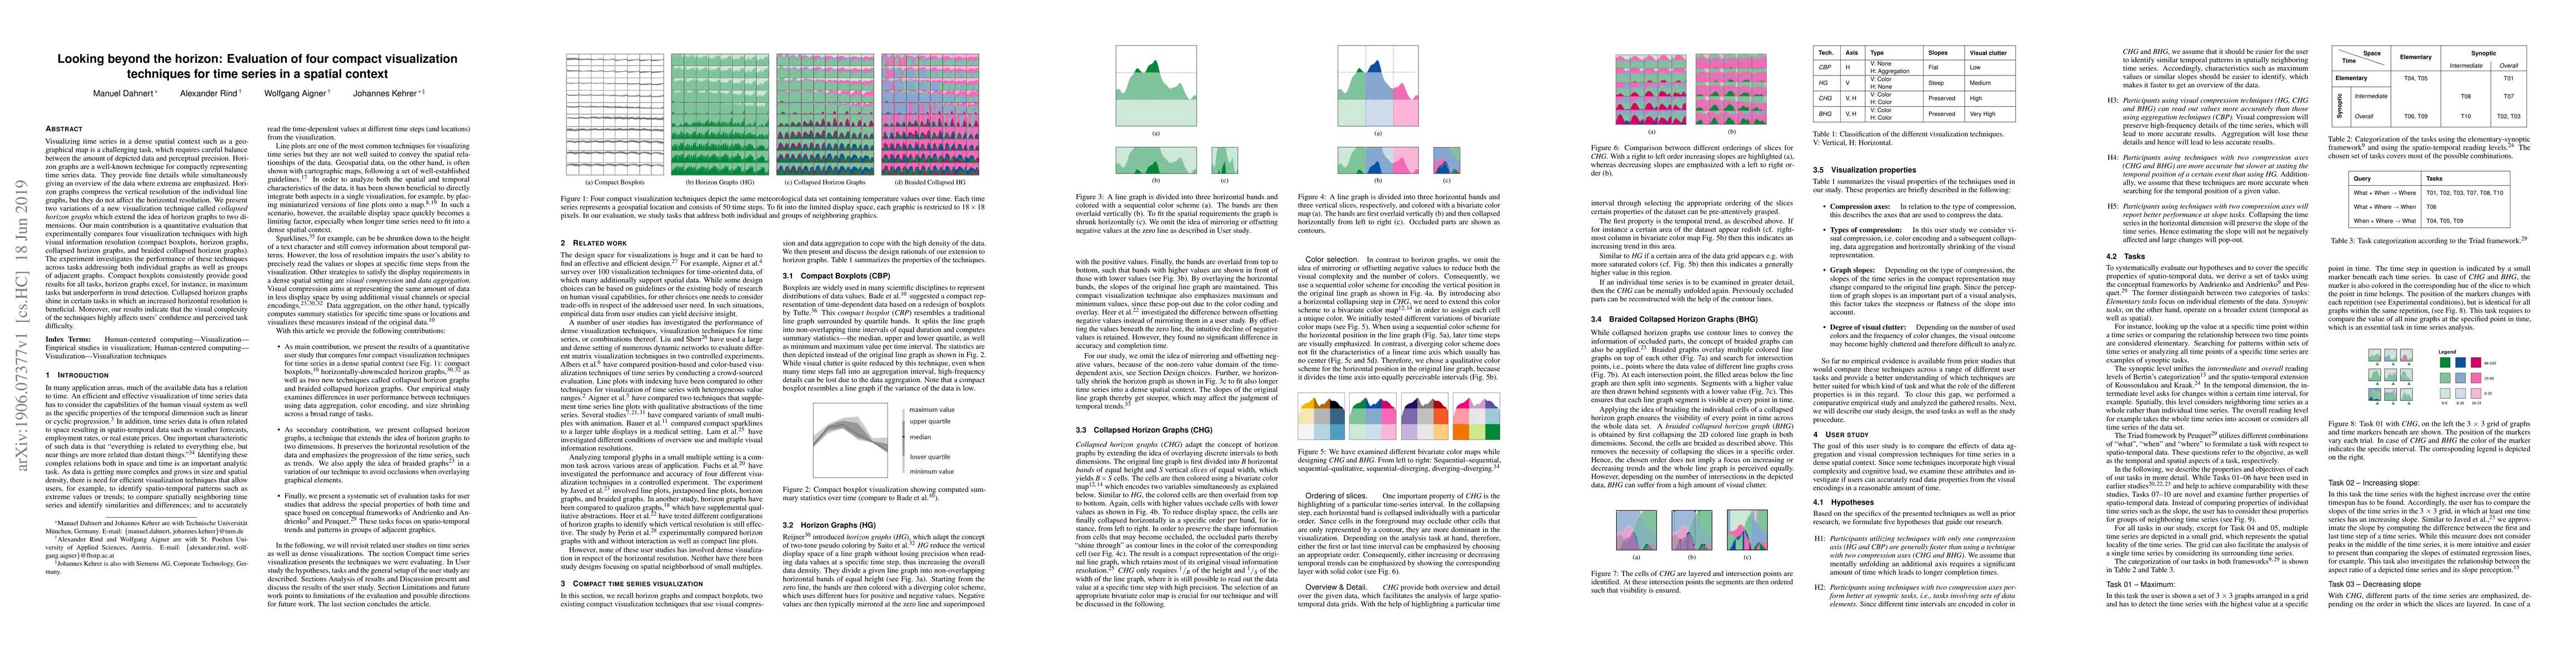
Visualizing time series in a dense spatial context such as a geographical map is a challenging task, which requires careful balance between the amount of depicted data and perceptual precision. Horizon graphs are a well-known technique for compactly representing time series data. They provide fine details while simultaneously giving an overview of the data where extrema are emphasized. Horizon graphs compress the vertical resolution of the individual line graphs, but they do not affect the horizontal resolution. We present two variations of a new visualization technique called collapsed horizon graphs which extend the idea of horizon graphs to two dimensions. Our main contribution is a quantitative evaluation that experimentally compares four visualization techniques with high visual information resolution (compact boxplots, horizon graphs, collapsed horizon graphs, and braided collapsed horizon graphs). The experiment investigates the performance of these techniques across tasks addressing both individual graphs as well as groups of adjacent graphs. Compact boxplots consistently provide good results for all tasks, horizon graphs excel, for instance, in maximum tasks but underperform in trend detection. Collapsed horizon graphs shine in certain tasks in which an increased horizontal resolution is beneficial. Moreover, our results indicate that the visual complexity of the techniques highly affects users' confidence and perceived task difficulty.
AI Key Findings
Get AI-generated insights about this paper's methodology, results, significance, and more — seven facets brought into focus.
Impact
Paper Details
PDF Preview
Key Terms
Citation Network
Current paper (gray), citations (green), references (blue)
Display is limited for performance on very large graphs.
Discussion 0