Academic Profile
Statistics
Similar Authors
Papers on arXiv

Two-dimensional embeddings obtained from dimensionality reduction techniques, such as MDS, t-SNE, and UMAP, are widely used across various disciplines to visualize high-dimensional data. These visua...
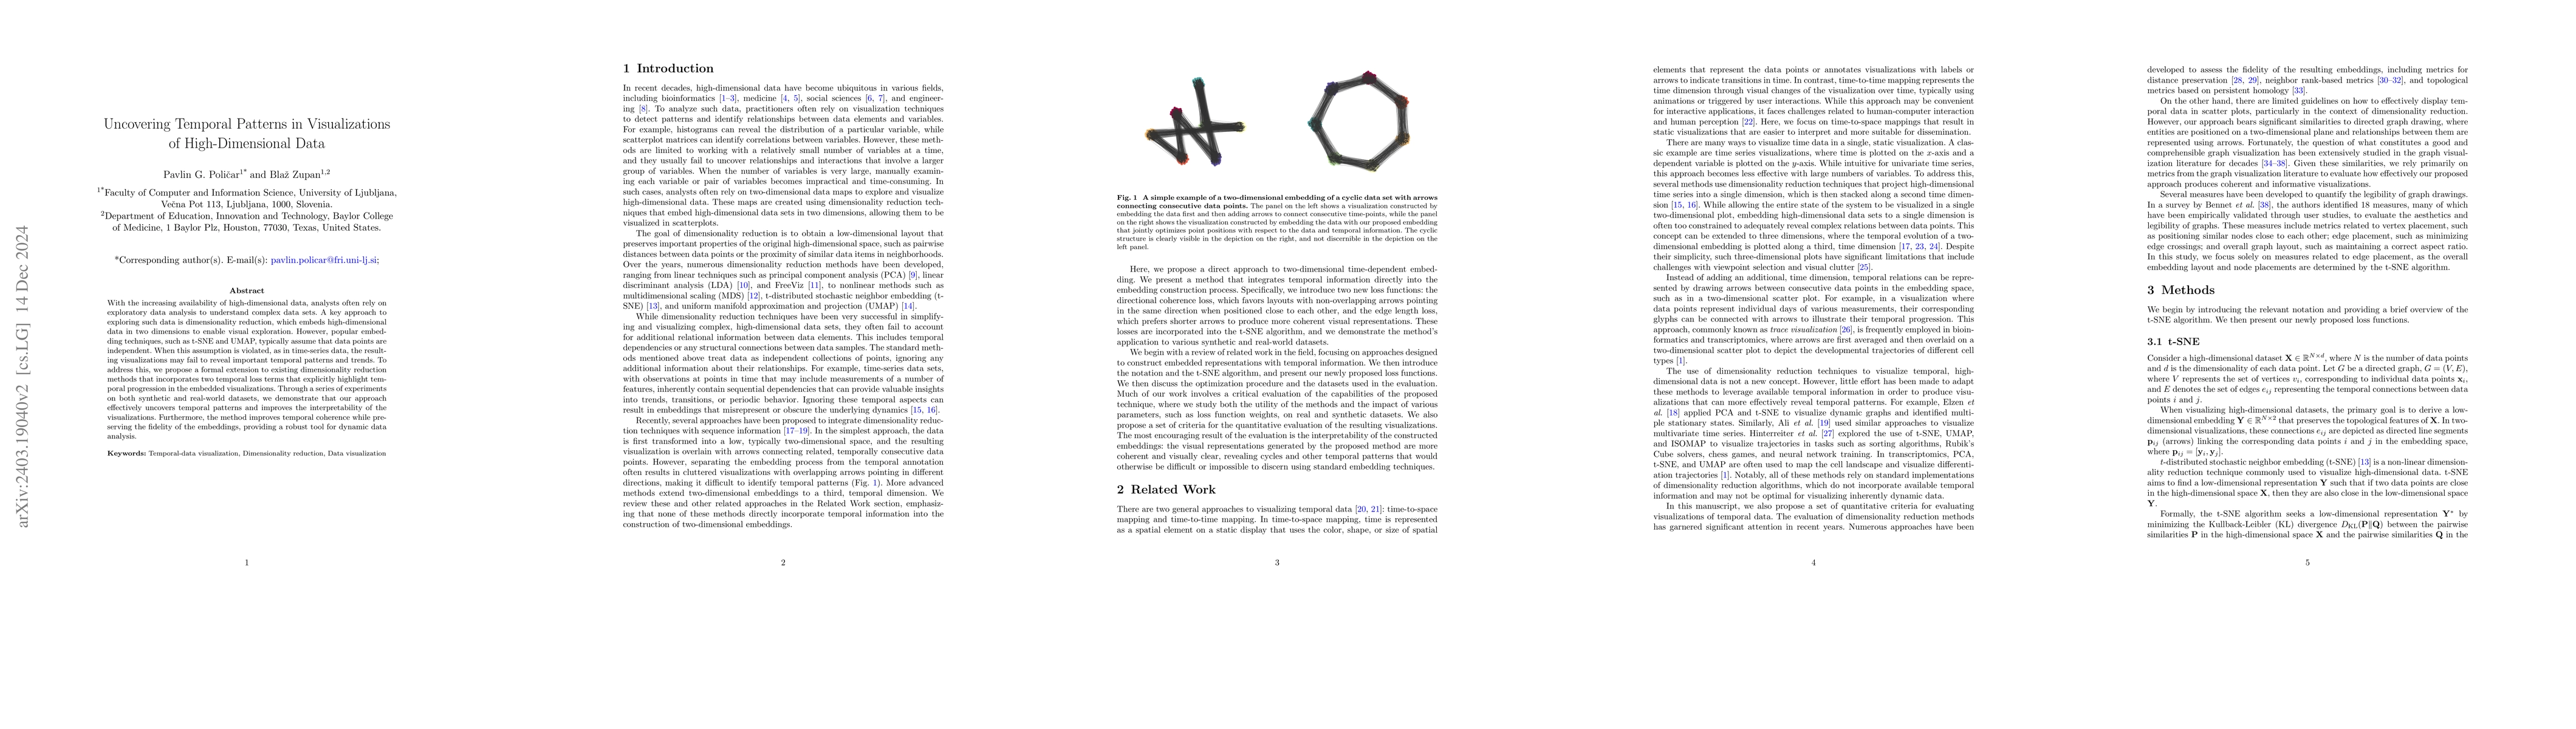
Many real-world data sets contain a temporal component or involve transitions from state to state. For exploratory data analysis, we can represent these high-dimensional data sets in two-dimensional...
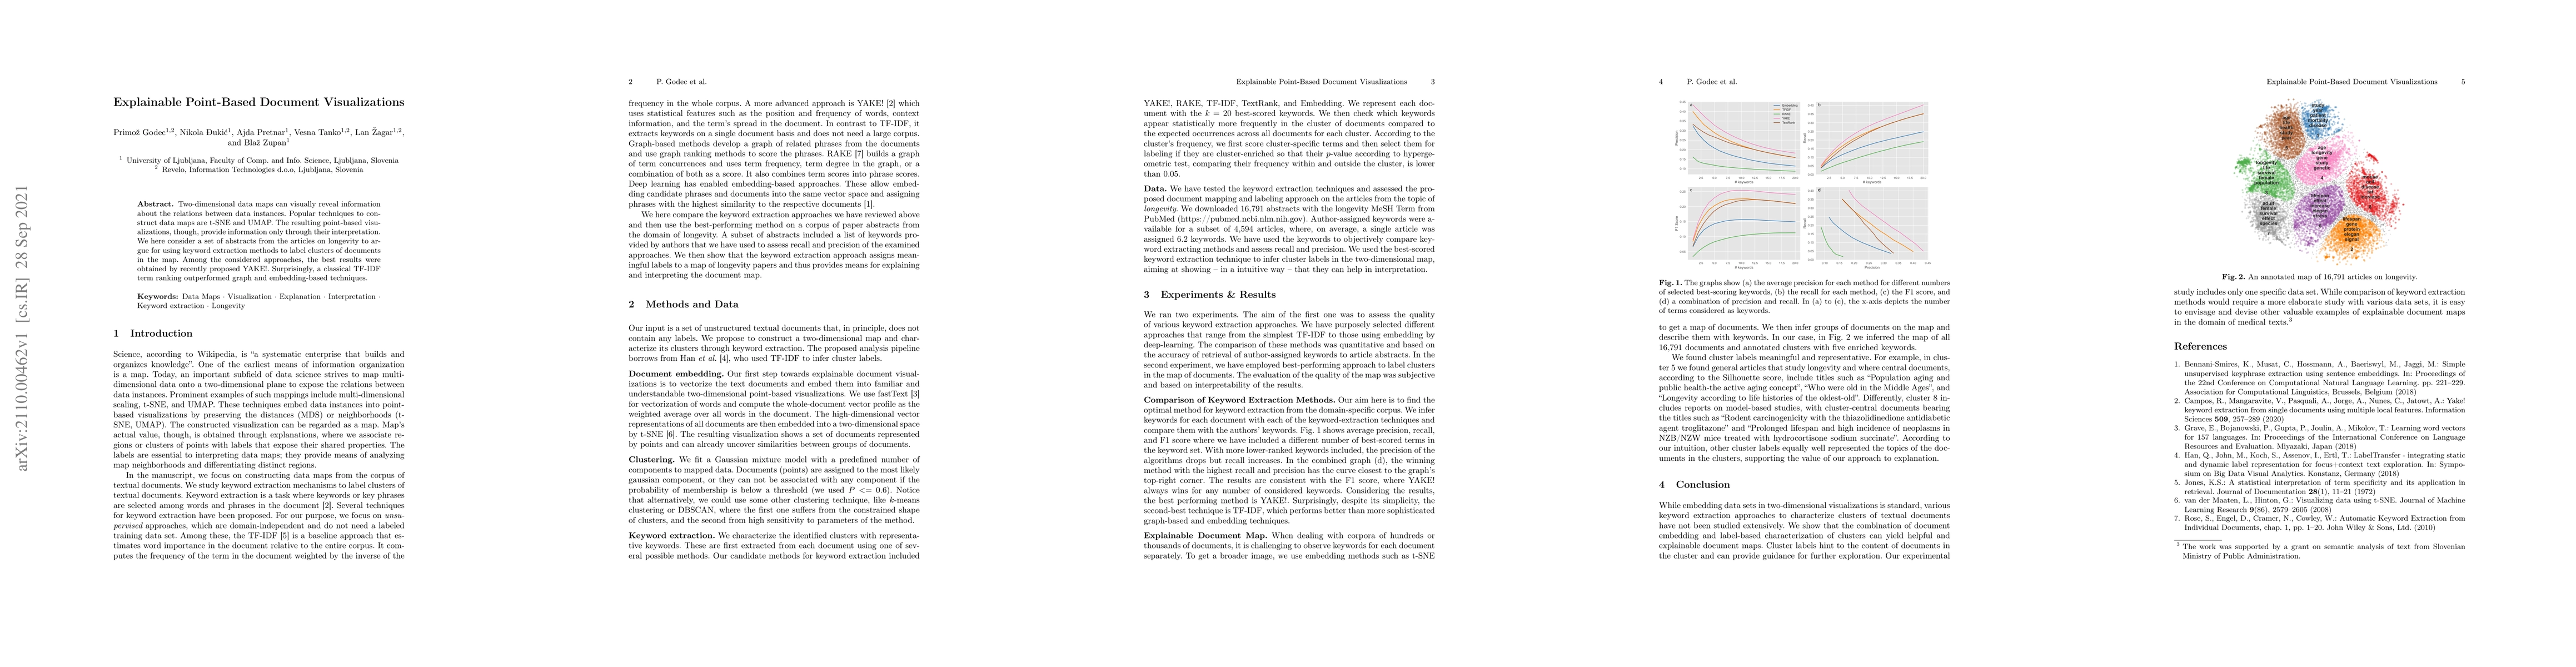
Two-dimensional data maps can visually reveal information about the relations between data instances. Popular techniques to construct data maps are t-SNE and UMAP. The resulting point-based visualiz...
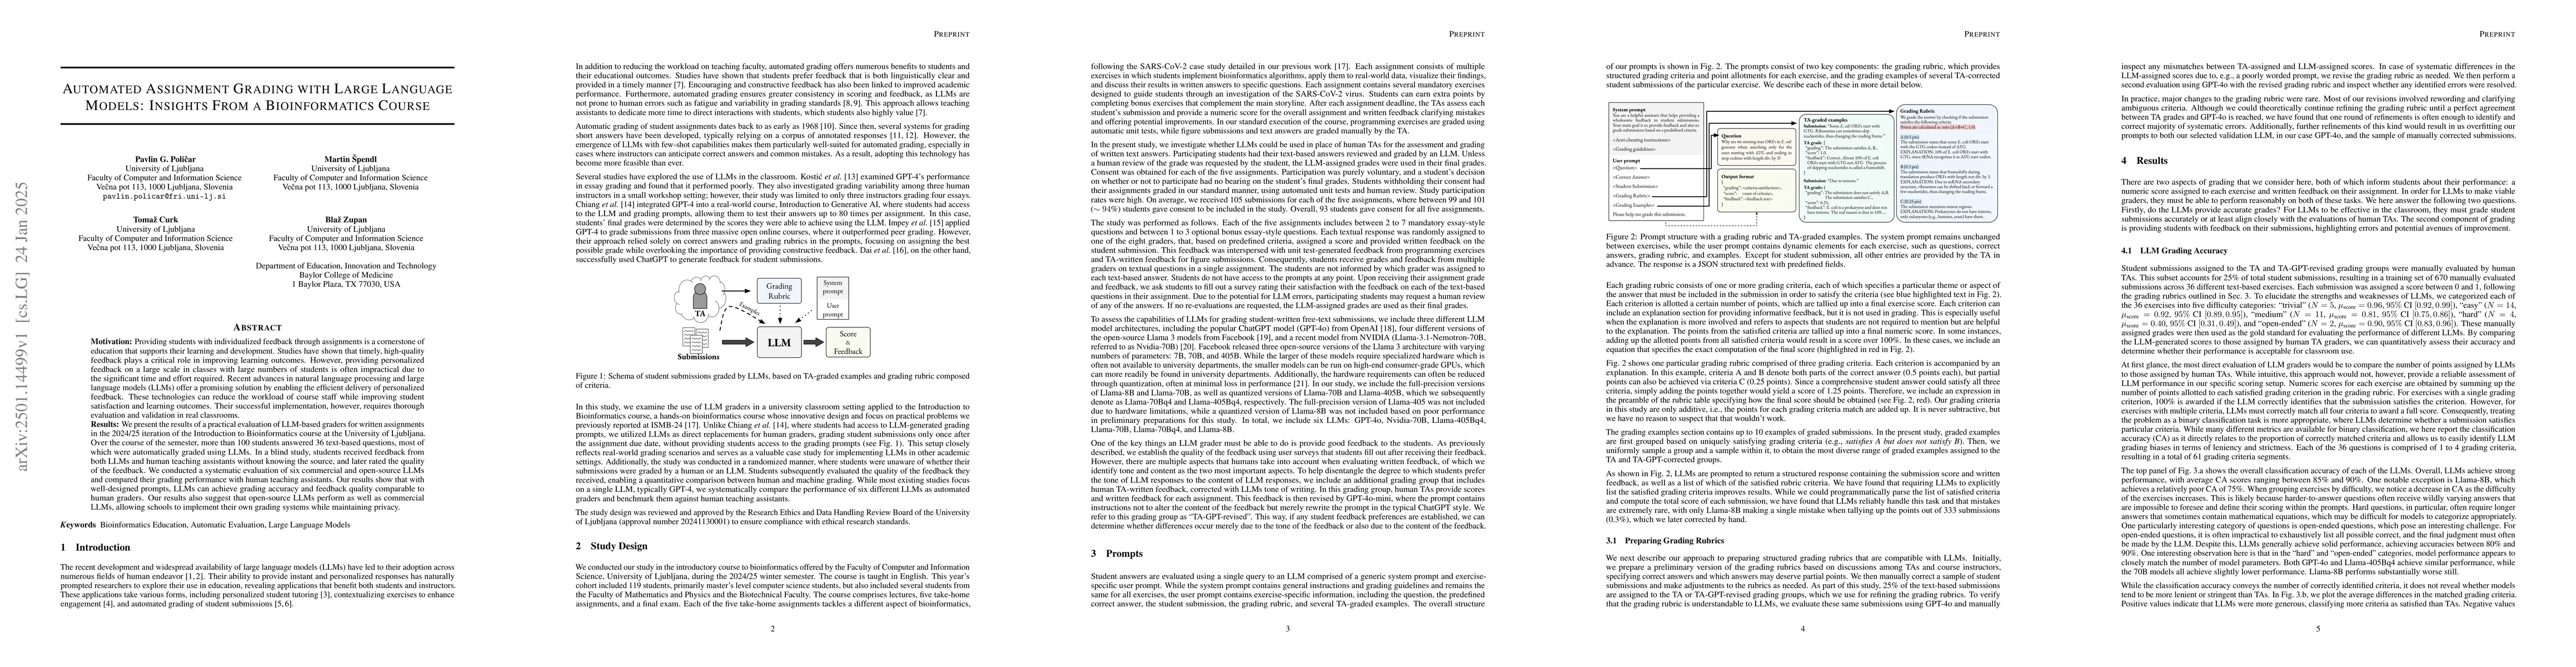
Providing students with individualized feedback through assignments is a cornerstone of education that supports their learning and development. Studies have shown that timely, high-quality feedback pl...
Longitudinal electronic health record (EHR) data are often left-censored, making diagnosis records incomplete and unreliable for determining disease onset. In contrast, outpatient prescriptions form r...
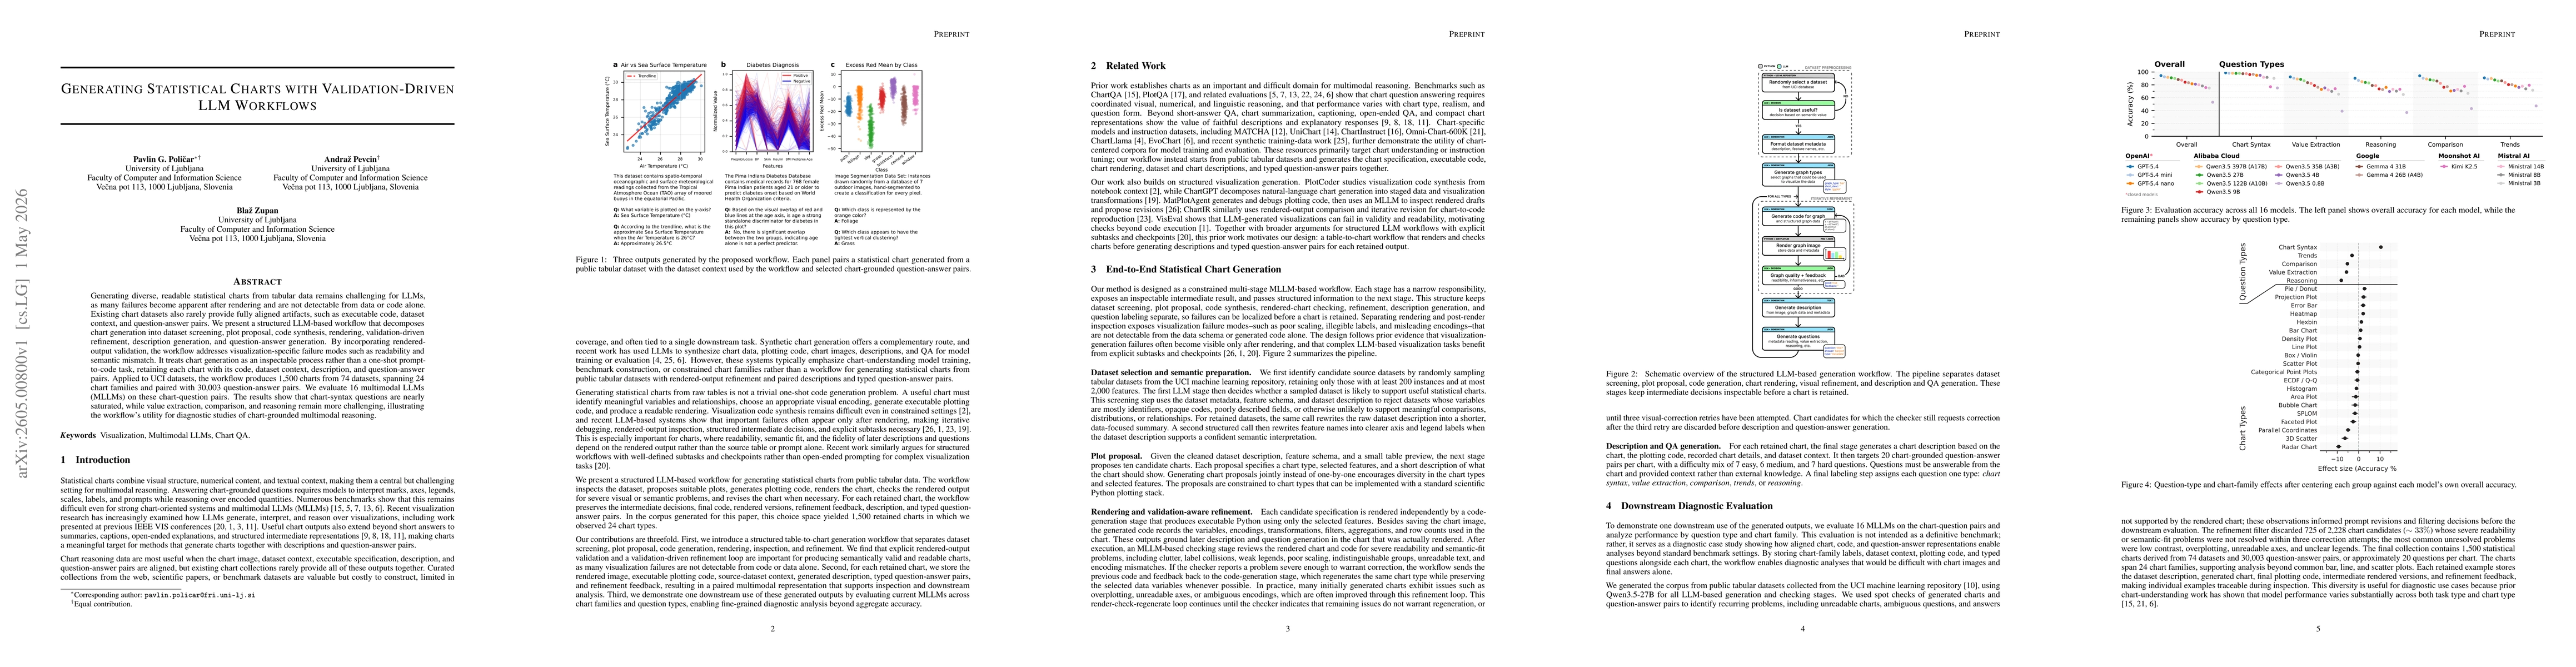
Generating diverse, readable statistical charts from tabular data remains challenging for LLMs, as many failures become apparent after rendering and are not detectable from data or code alone. Existin...
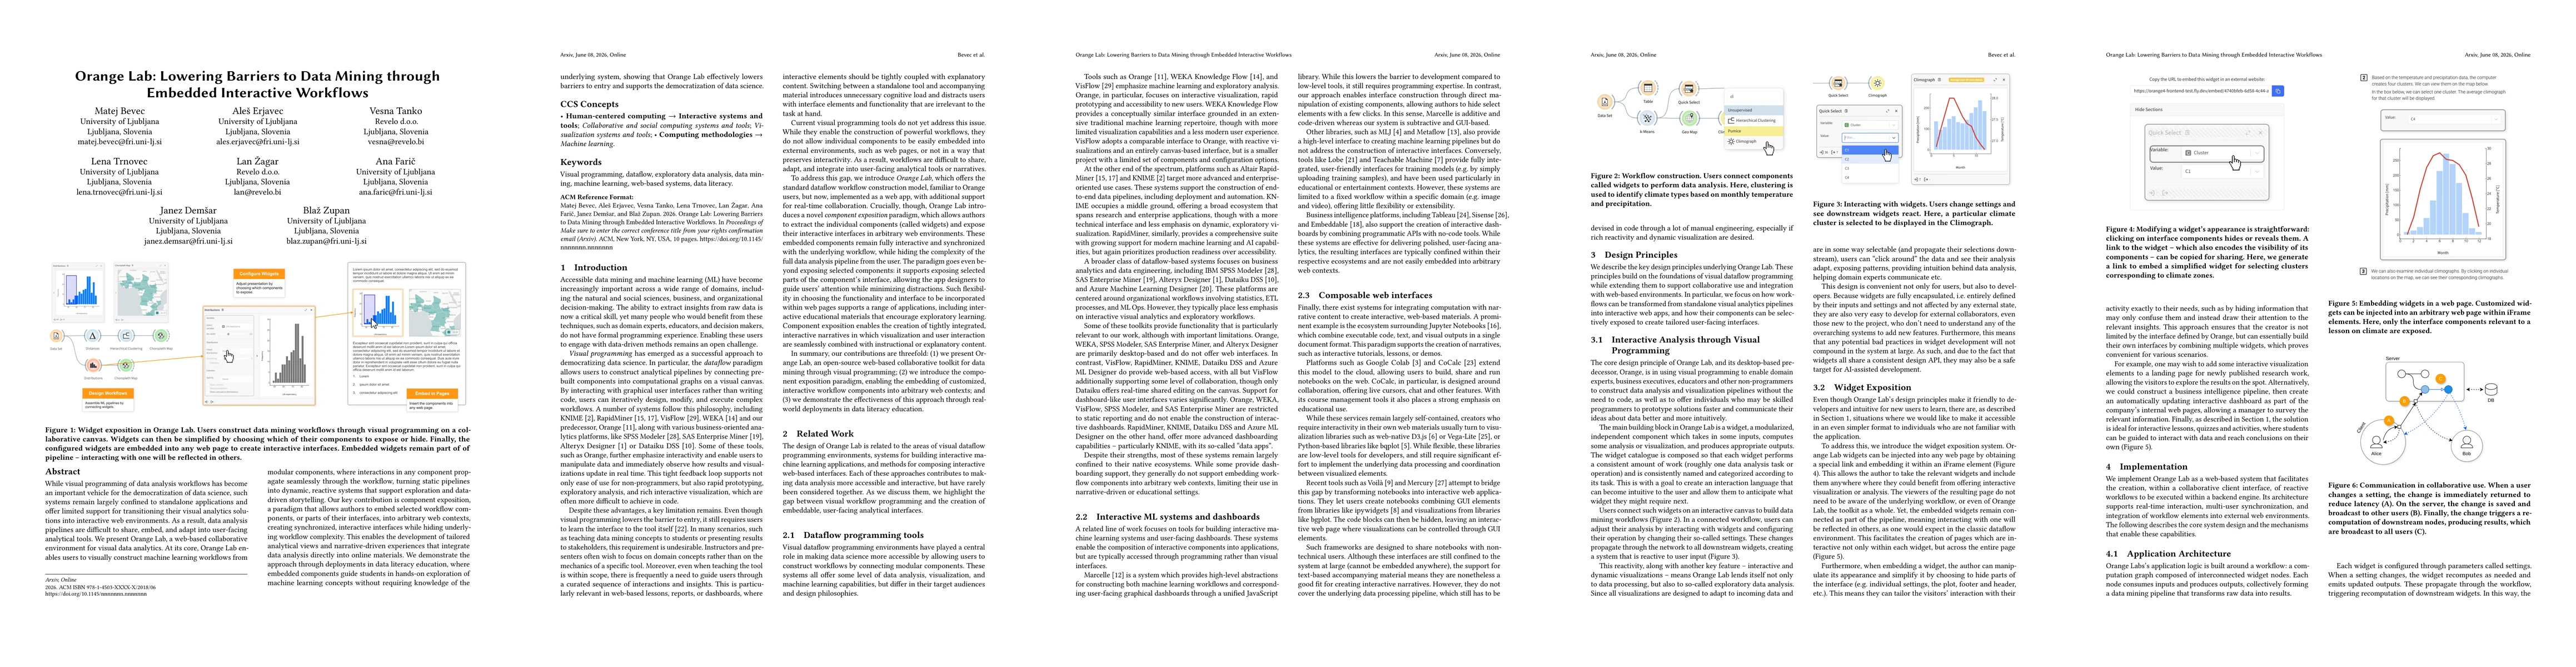
While visual programming of data analysis workflows has become an important vehicle for the democratization of data science, such systems remain largely confined to standalone applications and offer l...
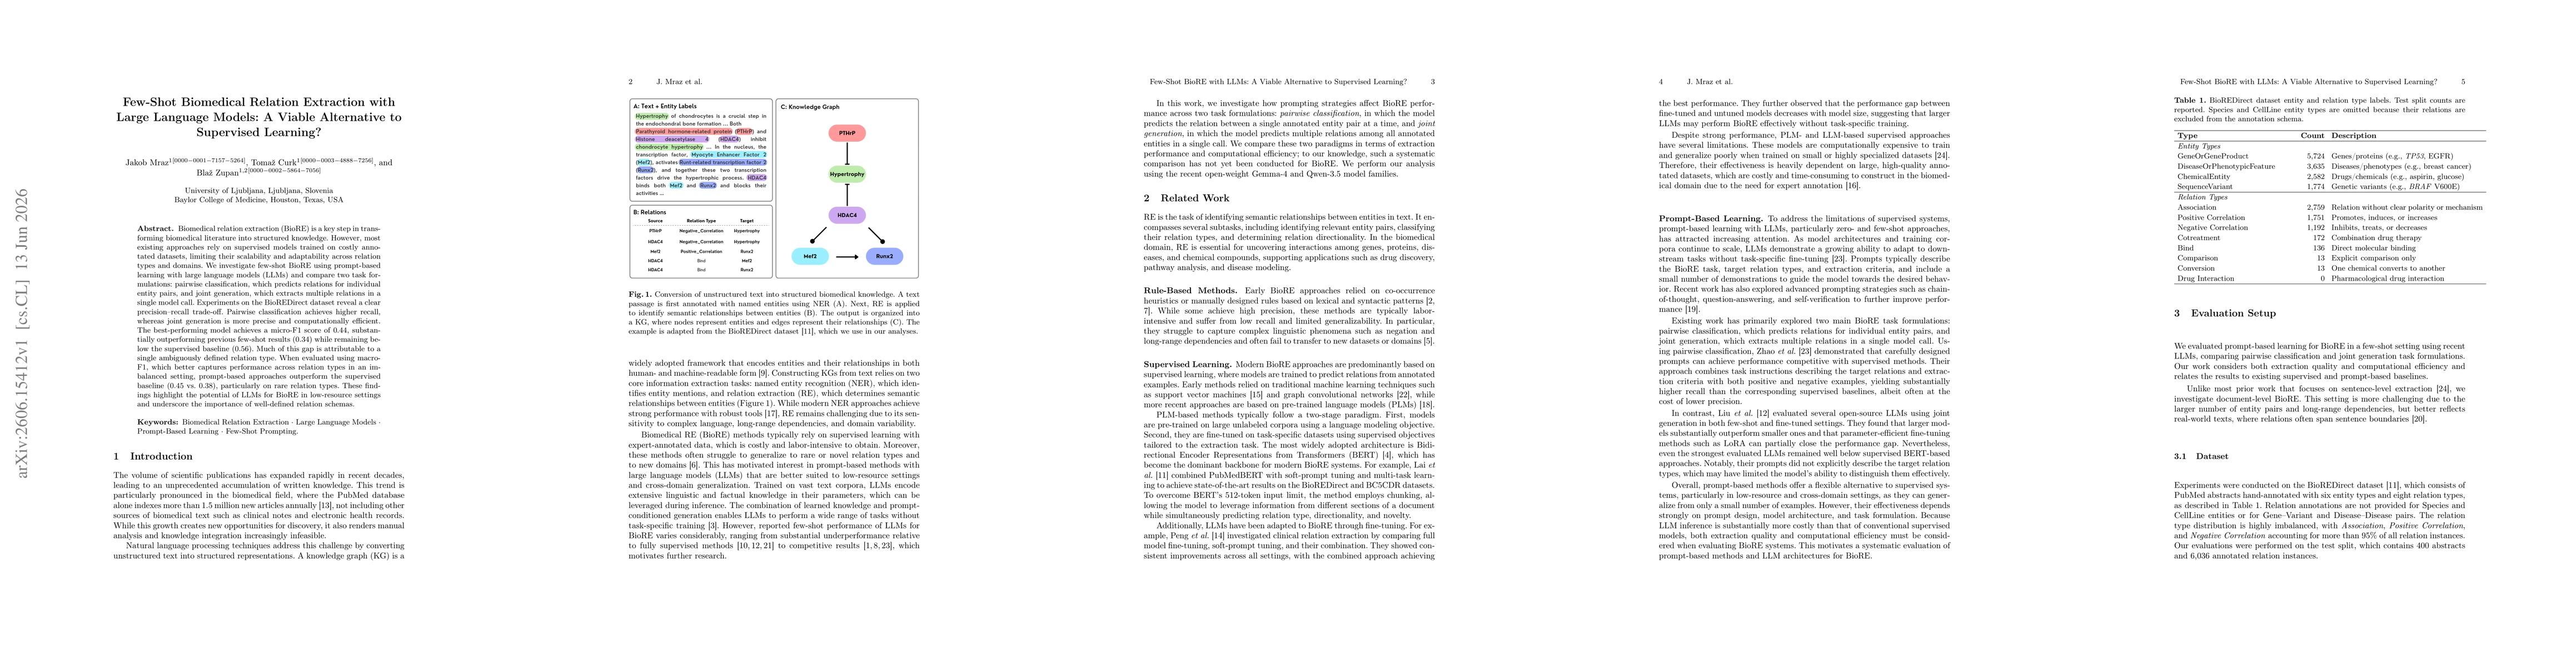
Biomedical relation extraction (BioRE) is a key step in transforming biomedical literature into structured knowledge. However, most existing approaches rely on supervised models trained on costly anno...