Quick Answers
What methodology did the authors use?
The paper presents a structured LLM-driven workflow that decomposes chart generation into dataset screening, plot proposal, code synthesis, rendering, validation-driven refinement, description generation, and question-answer generation, retaining each chart with its code, dataset context, and paired outputs for inspection. More in Methodology →
What are the key results?
Applied to 74 UCI datasets, the workflow produced 1,500 retained charts spanning 24 chart families with 30,003 chart-question-answer pairs. — Evaluation across 16 multimodal LLMs showed chart-syntax questions near saturation while value extraction, comparison, and reasoning remained more challenging, highlighting diagnostic utility for chart-grounded multimodal reasoning. More in Key Results →
Why is this work significant?
Demonstrates that a validated, inspectable, multi-step chart generation process can produce richer, aligned chart artifacts (code, data context, descriptions, QA pairs) and enables fine-grained diagnostic analysis of multimodal chart reasoning beyond one-shot prompting. More in Significance →
What are the main limitations?
Evaluation limited to public tabular datasets (primarily UCI) and may not capture domain-specific charting challenges. — Performance and reliability depend on the capabilities of the underlying multimodal LLMs and their access to rendering and feedback loops. More in Limitations →
Abstract
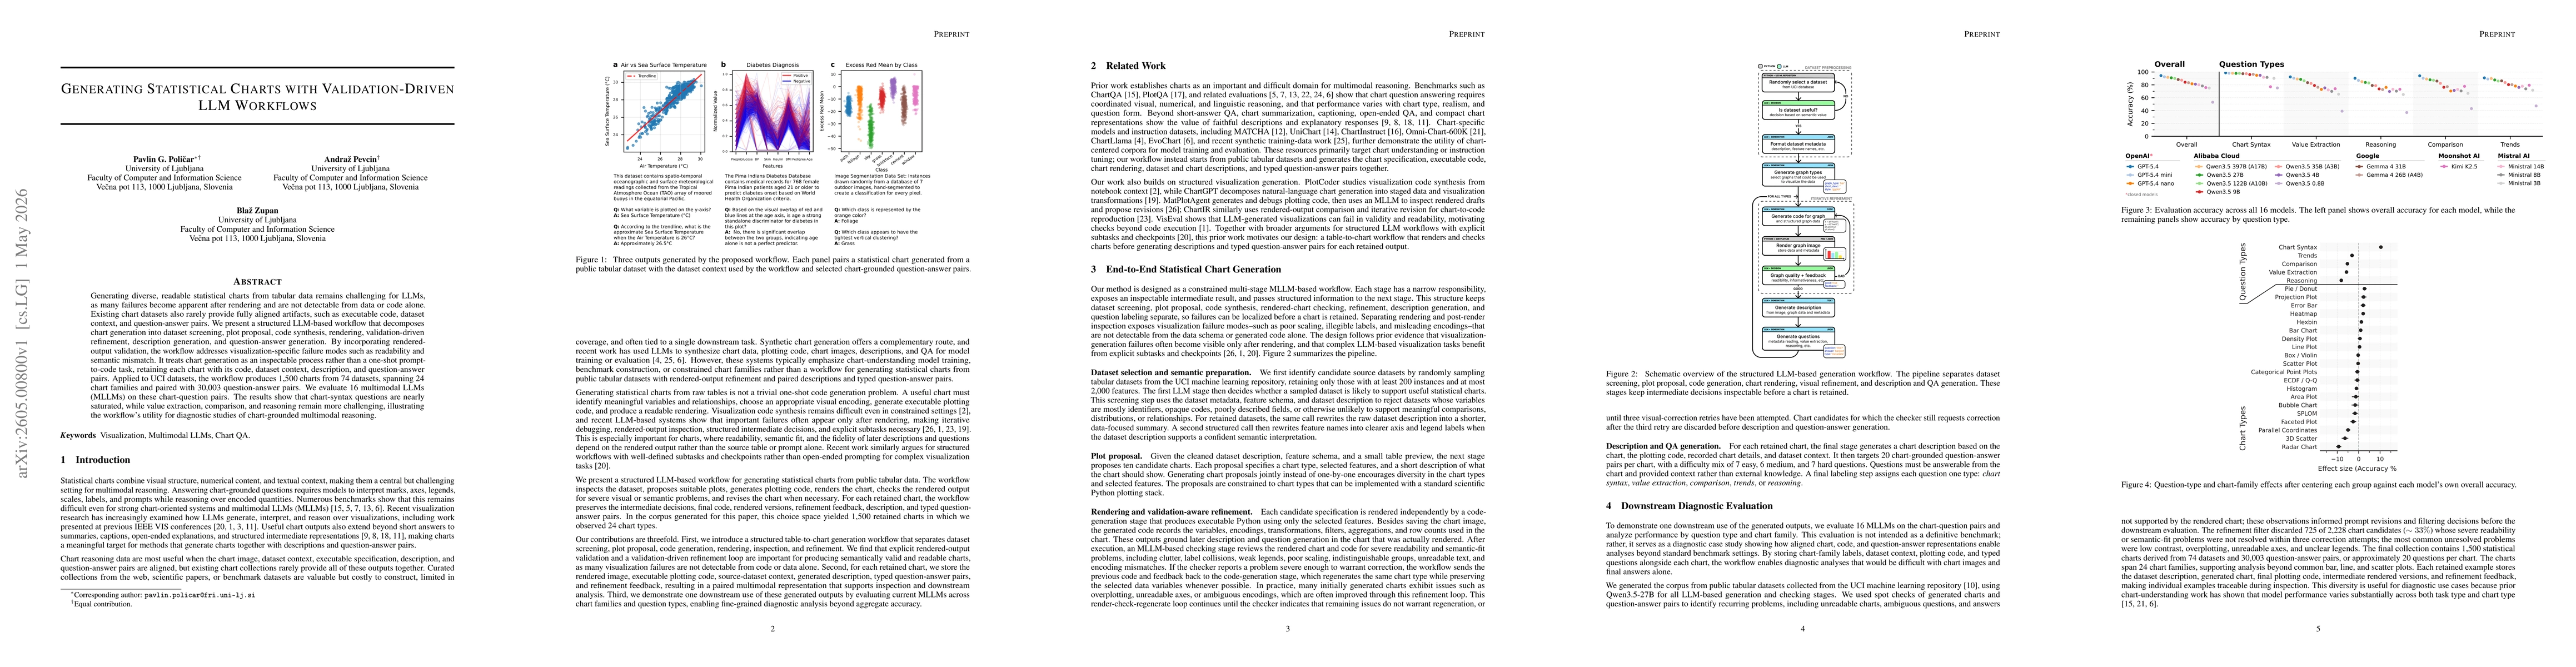
Generating diverse, readable statistical charts from tabular data remains challenging for LLMs, as many failures become apparent after rendering and are not detectable from data or code alone. Existing chart datasets also rarely provide fully aligned artifacts, such as executable code, dataset context, and question-answer pairs. We present a structured LLM-based workflow that decomposes chart generation into dataset screening, plot proposal, code synthesis, rendering, validation-driven refinement, description generation, and question-answer generation. By incorporating rendered-output validation, the workflow addresses visualization-specific failure modes such as readability and semantic mismatch. It treats chart generation as an inspectable process rather than a one-shot prompt-to-code task, retaining each chart with its code, dataset context, description, and question-answer pairs. Applied to UCI datasets, the workflow produces 1,500 charts from 74 datasets, spanning 24 chart families and paired with 30,003 question-answer pairs. We evaluate 16 multimodal LLMs (MLLMs) on these chart-question pairs. The results show that chart-syntax questions are nearly saturated, while value extraction, comparison, and reasoning remain more challenging, illustrating the workflow's utility for diagnostic studies of chart-grounded multimodal reasoning.
AI Key Findings
Generated May 05, 2026
Methodology — What approach did the authors take?
The paper presents a structured LLM-driven workflow that decomposes chart generation into dataset screening, plot proposal, code synthesis, rendering, validation-driven refinement, description generation, and question-answer generation, retaining each chart with its code, dataset context, and paired outputs for inspection.
Key Results — What are the main findings?
- Applied to 74 UCI datasets, the workflow produced 1,500 retained charts spanning 24 chart families with 30,003 chart-question-answer pairs.
- Evaluation across 16 multimodal LLMs showed chart-syntax questions near saturation while value extraction, comparison, and reasoning remained more challenging, highlighting diagnostic utility for chart-grounded multimodal reasoning.
- Rendered-output validation and refinement loops improved semantic alignment and readability of charts beyond what data/code alone could guarantee.
Significance — Why does this research matter?
Demonstrates that a validated, inspectable, multi-step chart generation process can produce richer, aligned chart artifacts (code, data context, descriptions, QA pairs) and enables fine-grained diagnostic analysis of multimodal chart reasoning beyond one-shot prompting.
Technical Contribution — What is the technical contribution?
Proposes a novel, validation-driven, multi-stage chart generation workflow that preserves intermediate decisions and artifacts (dataset context, code, rendered charts, refinement feedback, descriptions, QA pairs) to enable inspection and downstream analysis.
Novelty — What is new about this work?
Introduces rendering-aware, stepwise decomposition of chart generation for public tabular data, introducing explicit rendered-output validation as a core feedback loop and producing paired multimodal representations for each retained chart.
Limitations — What are the limitations of this study?
- Evaluation limited to public tabular datasets (primarily UCI) and may not capture domain-specific charting challenges.
- Performance and reliability depend on the capabilities of the underlying multimodal LLMs and their access to rendering and feedback loops.
- The workflow introduces overhead compared to traditional one-shot chart generation, which may affect scalability in real-time scenarios.
Future Work — What did the authors propose for future work?
- Extend the workflow to additional datasets and chart domains to assess generalizability across visualization types.
- Investigate automatic error localization and remediation strategies within the validation loop to further close semantic gaps.
- Develop benchmarks that balance chart-syntax, value extraction, and reasoning tasks to more comprehensively diagnose MLLM chart-grounded capabilities.
How to Cite This Paper
@article{pevcin2026generating,
title = {Generating Statistical Charts with Validation-Driven LLM Workflows},
author = {Pevcin, Andraž and Zupan, Blaž and Poličar, Pavlin G.},
year = {2026},
eprint = {2605.00800},
archivePrefix = {arXiv},
primaryClass = {cs.LG},
}
Pevcin, A., Zupan, B., & Poličar, P. (2026). Generating Statistical Charts with Validation-Driven LLM Workflows. arXiv. https://arxiv.org/abs/2605.00800
Pevcin, Andraž, et al. "Generating Statistical Charts with Validation-Driven LLM Workflows." arXiv, 2026, arxiv.org/abs/2605.00800.
PDF Preview
Similar Papers
Found 4 papersAniVis: Generating Animated Transitions Between Statistical Charts with a Tree Model
Wenchao Li, Yun Wang, He Huang et al.
Statistical Independence Aware Caching for LLM Workflows
Yihan Dai, Dimitrios Stamatios Bouras, Haoxiang Jia et al.
Agentic LLM Workflows for Generating Patient-Friendly Medical Reports
Malavikha Sudarshan, Sophie Shih, Estella Yee et al.
LLM Output Drift: Cross-Provider Validation & Mitigation for Financial Workflows
Raffi Khatchadourian, Rolando Franco
Comments (0)