Academic Profile
Statistics
Similar Authors
Papers on arXiv
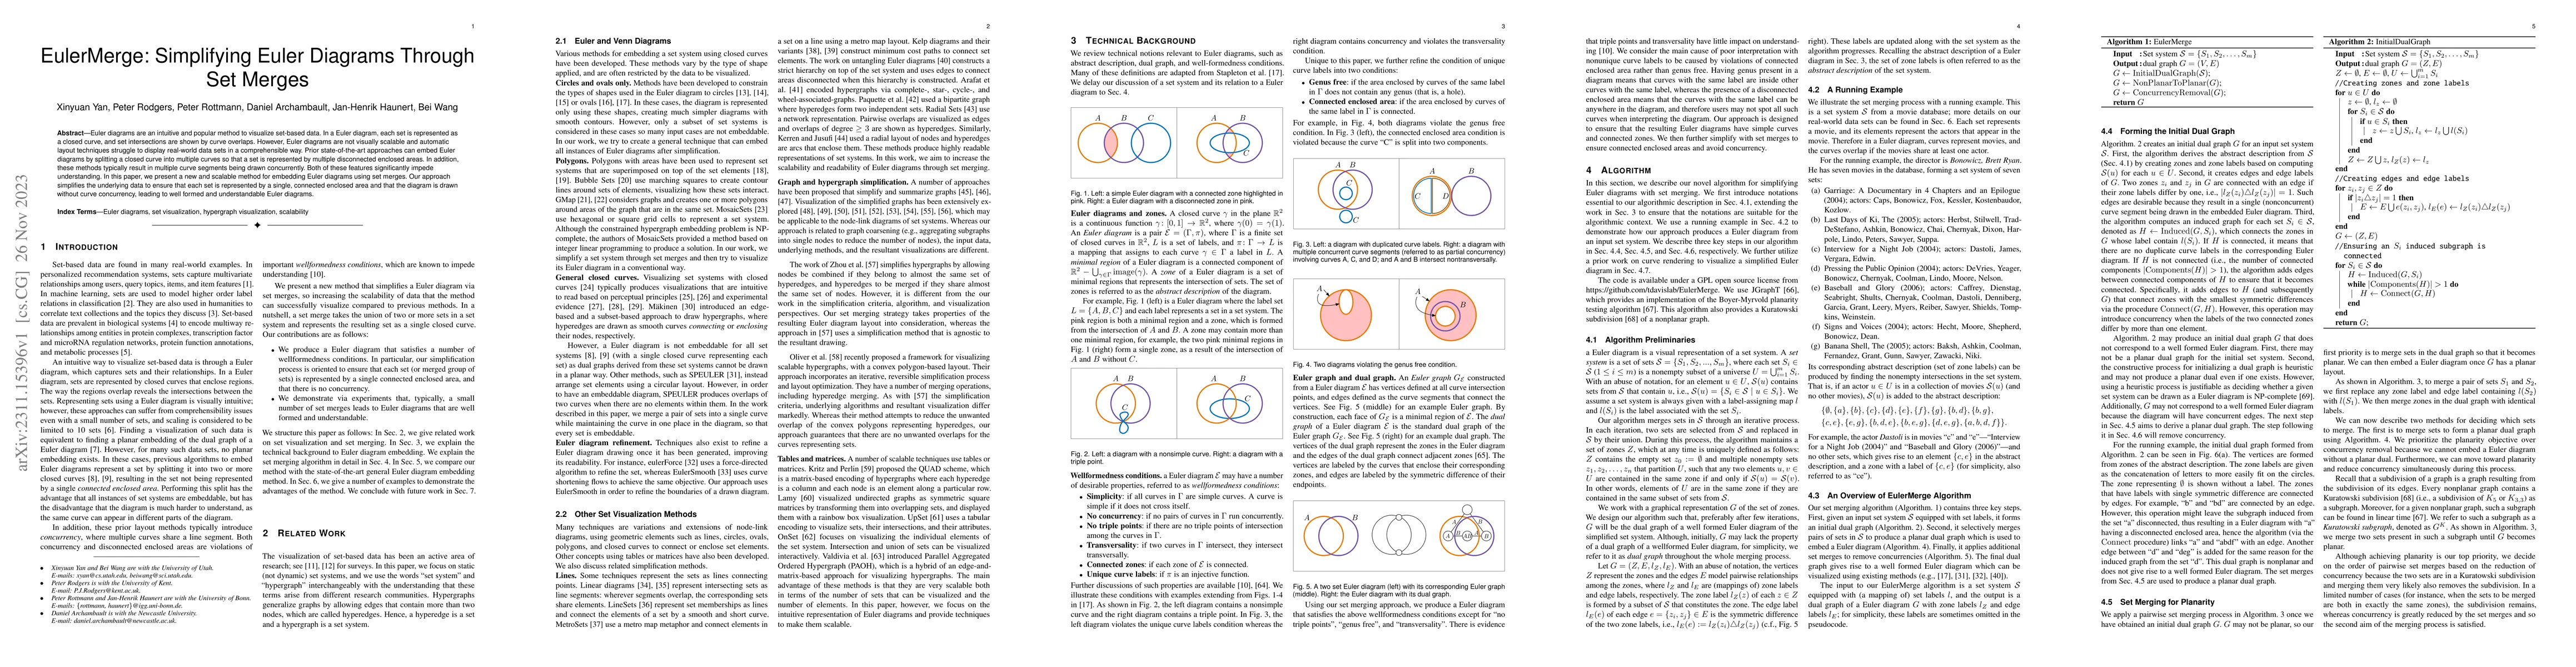
Euler diagrams are an intuitive and popular method to visualize set-based data. In a Euler diagram, each set is represented as a closed curve, and set intersections are shown by curve overlaps. Howe...
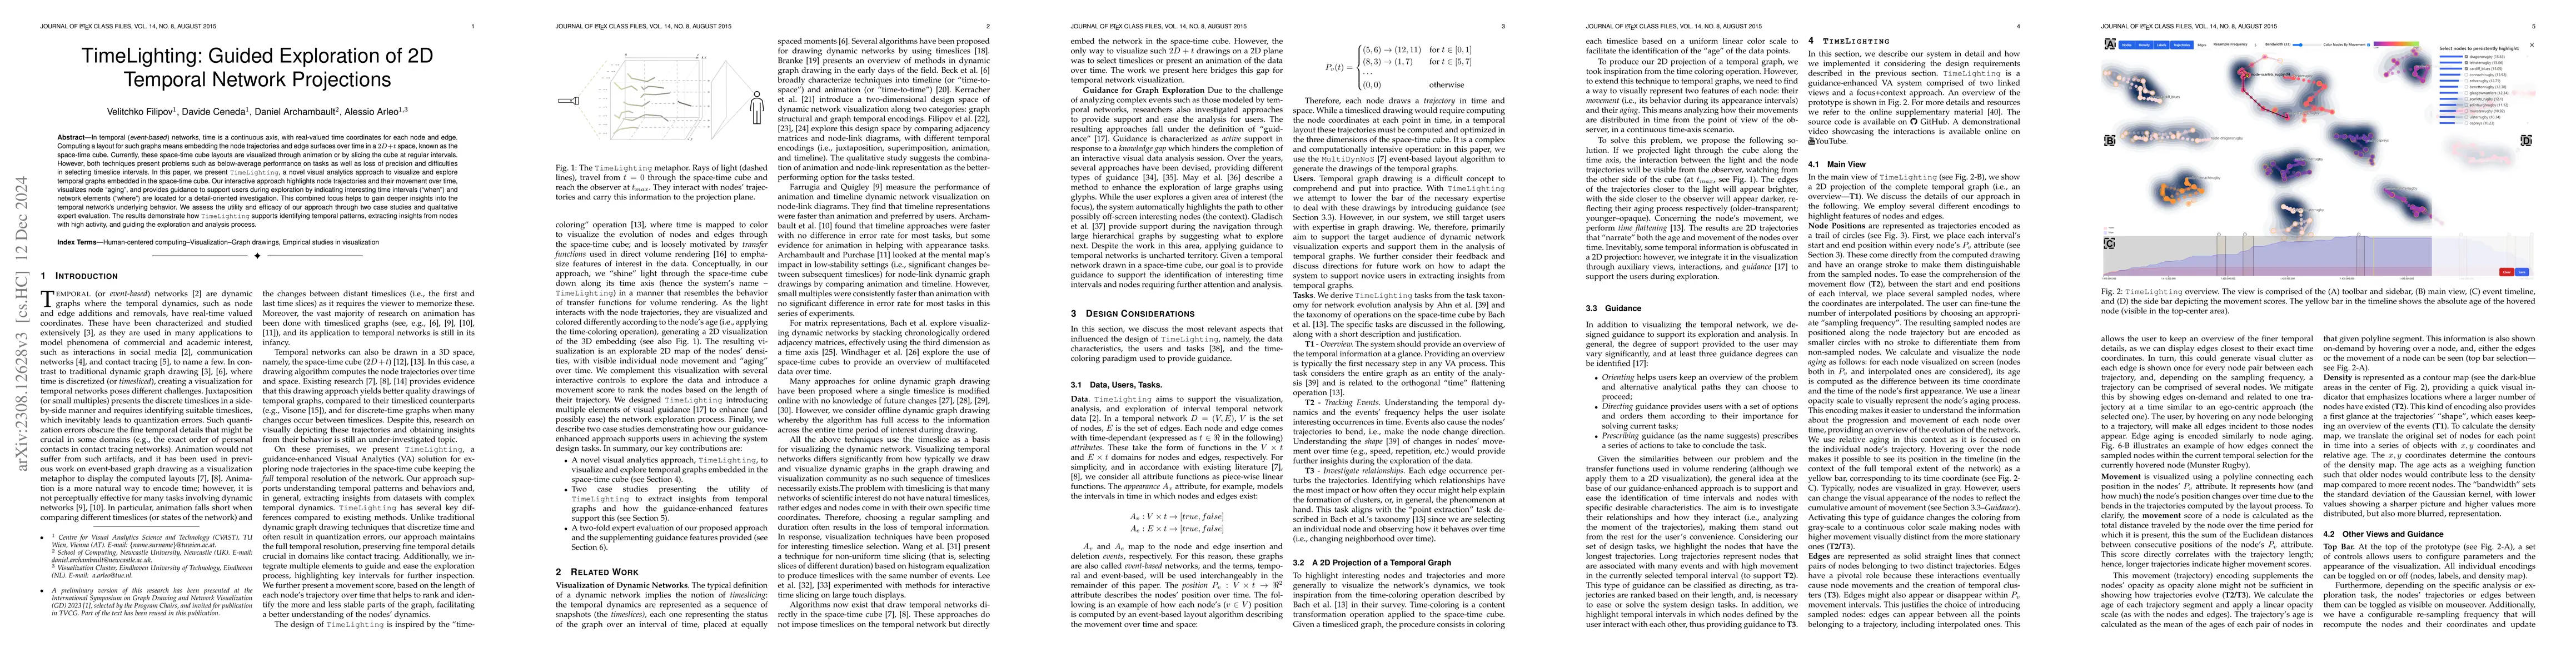
In temporal (or event-based) networks, time is a continuous axis, with real-valued time coordinates for each node and edge. Computing a layout for such graphs means embedding the node trajectories a...
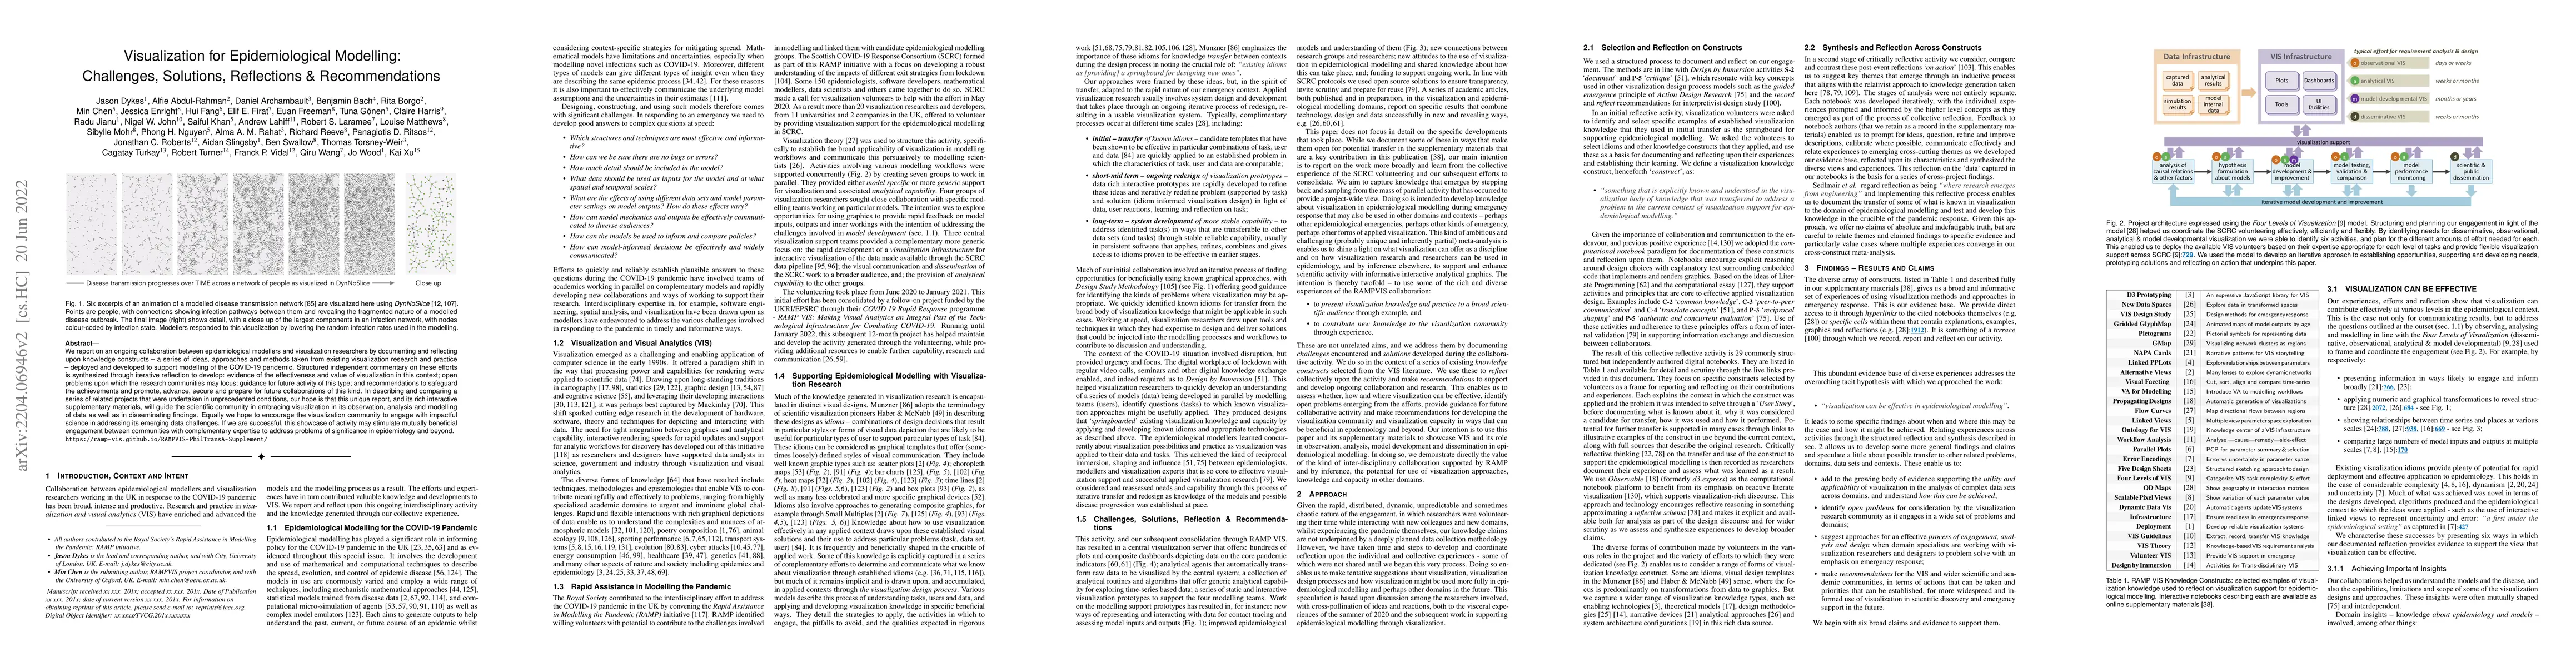
We report on an ongoing collaboration between epidemiological modellers and visualization researchers by documenting and reflecting upon knowledge constructs -- a series of ideas, approaches and met...
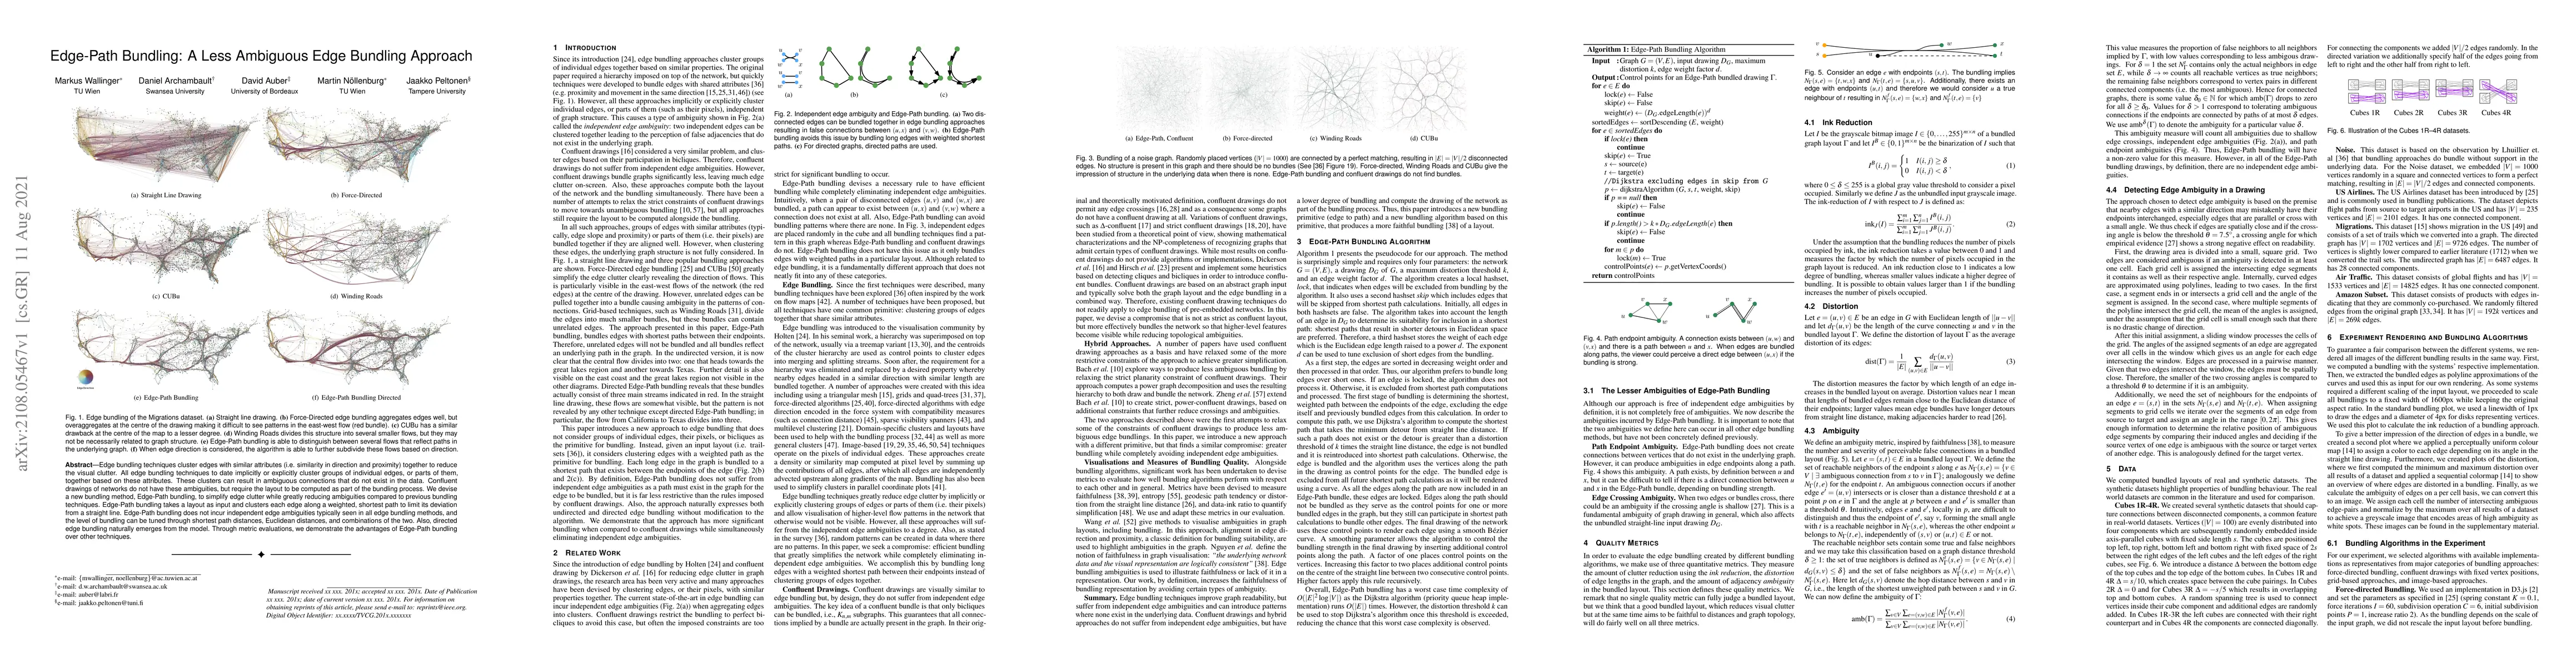
Edge bundling techniques cluster edges with similar attributes (i.e. similarity in direction and proximity) together to reduce the visual clutter. All edge bundling techniques to date implicitly or ...
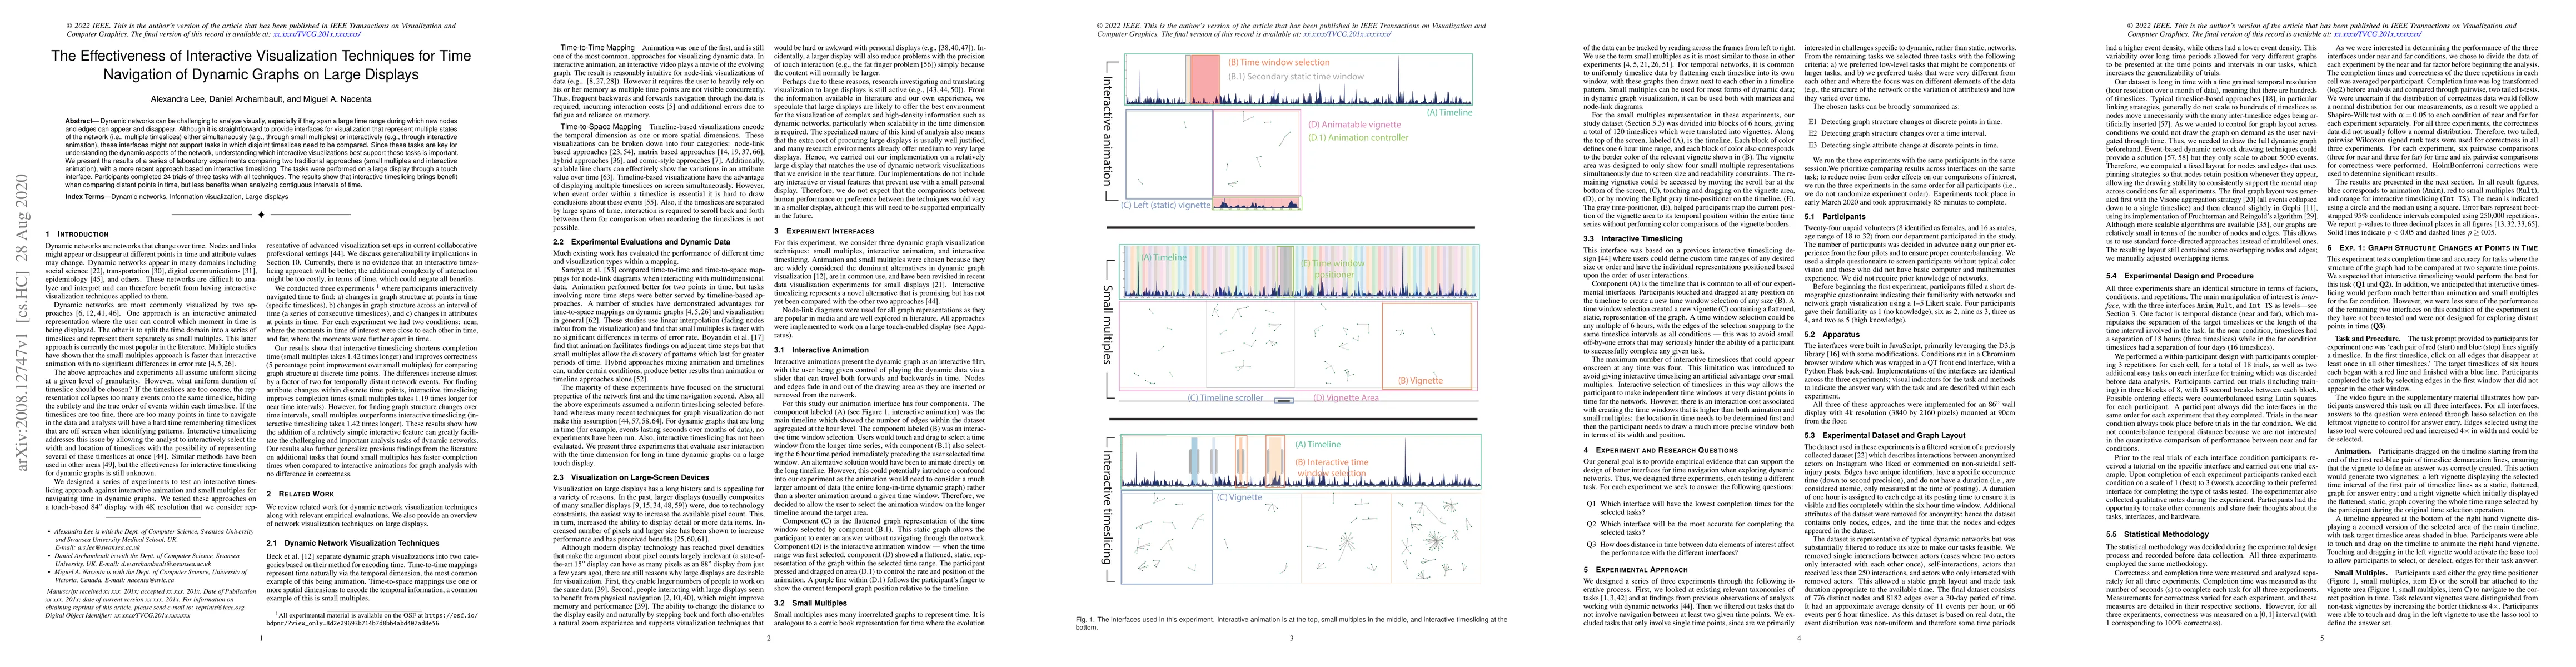
Dynamic networks can be challenging to analyze visually, especially if they span a large time range during which new nodes and edges can appear and disappear. Although it is straightforward to provi...
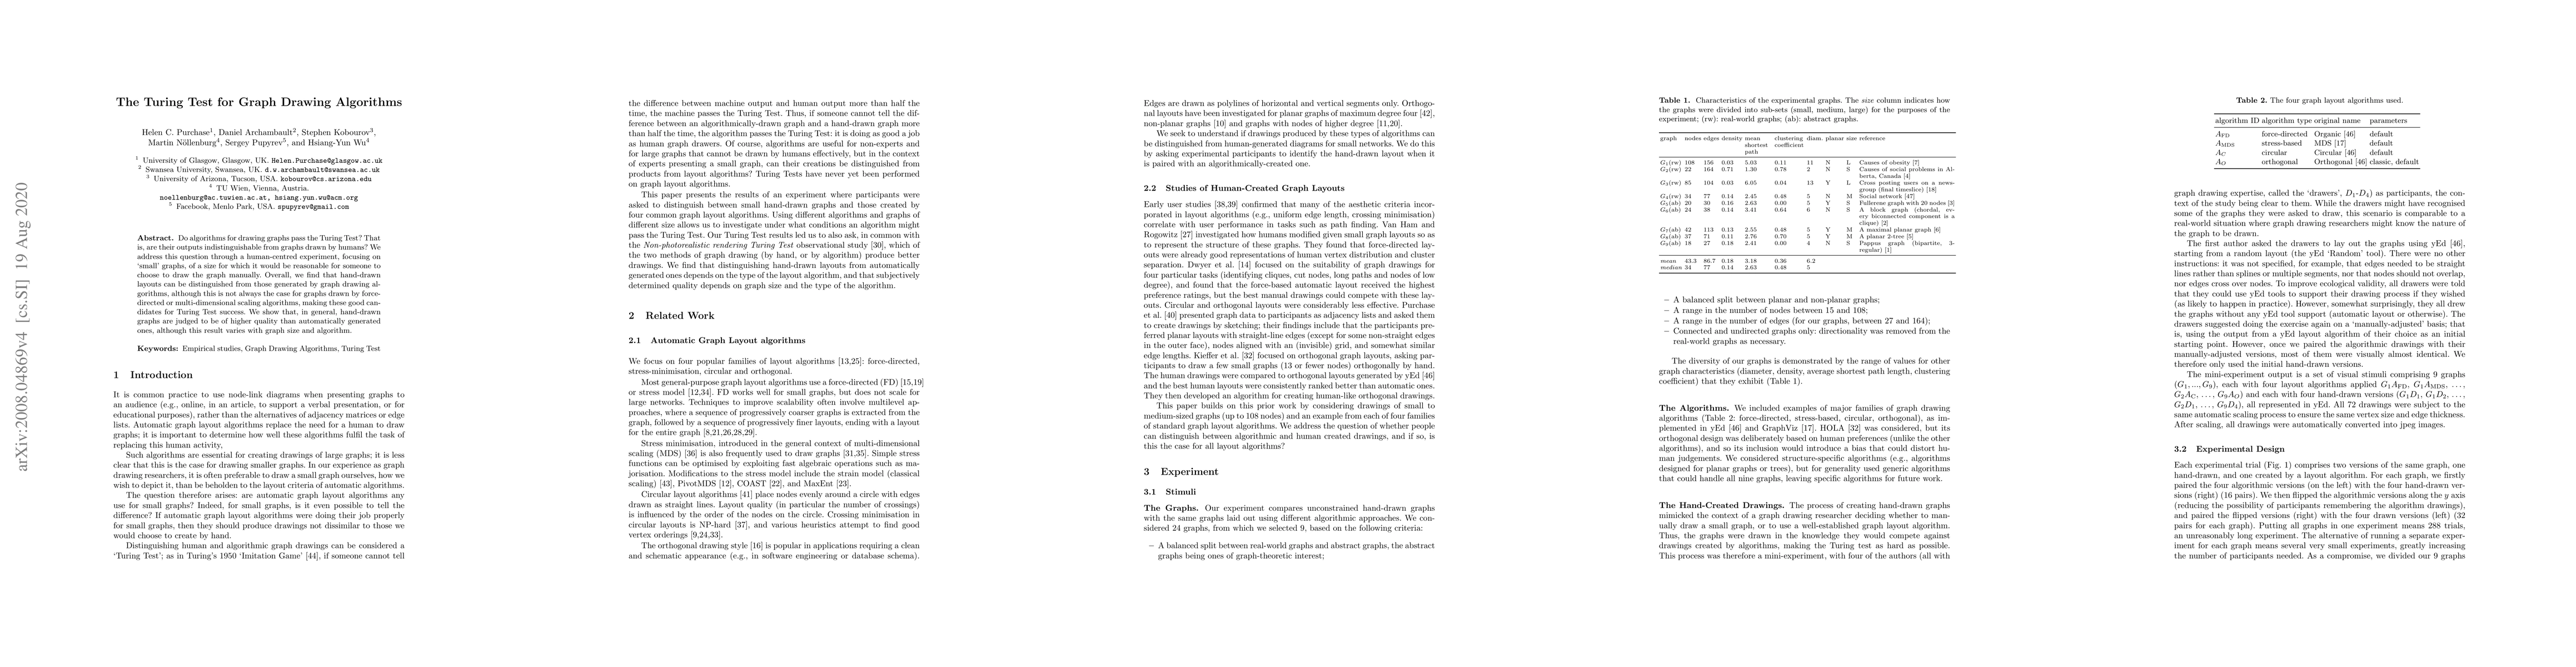
Do algorithms for drawing graphs pass the Turing Test? That is, are their outputs indistinguishable from graphs drawn by humans? We address this question through a human-centred experiment, focusing...
This is the arXiv index for the electronic proceedings of GD 2019, which contains the peer-reviewed and revised accepted papers with an optional appendix. Proceedings (without appendices) are also t...
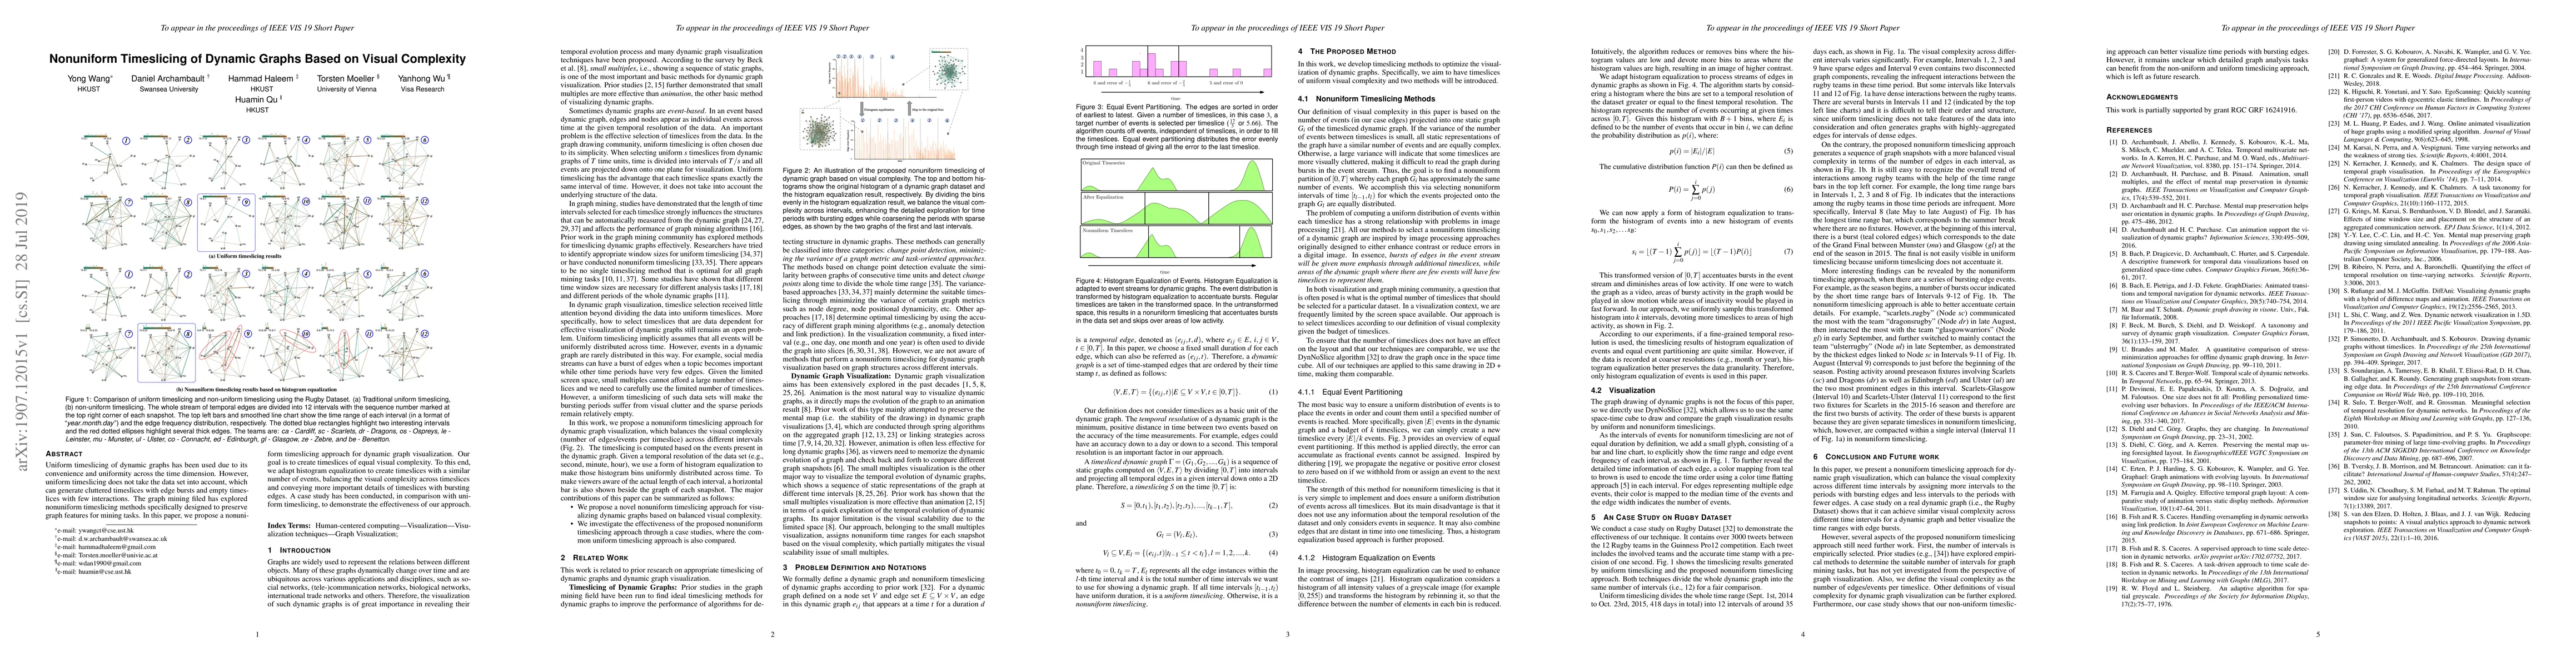
Uniform timeslicing of dynamic graphs has been used due to its convenience and uniformity across the time dimension. However, uniform timeslicing does not take the data set into account, which can g...
Dimensionality reduction (DR) techniques are essential for visually analyzing high-dimensional data. However, visual analytics using DR often face unreliability, stemming from factors such as inherent...
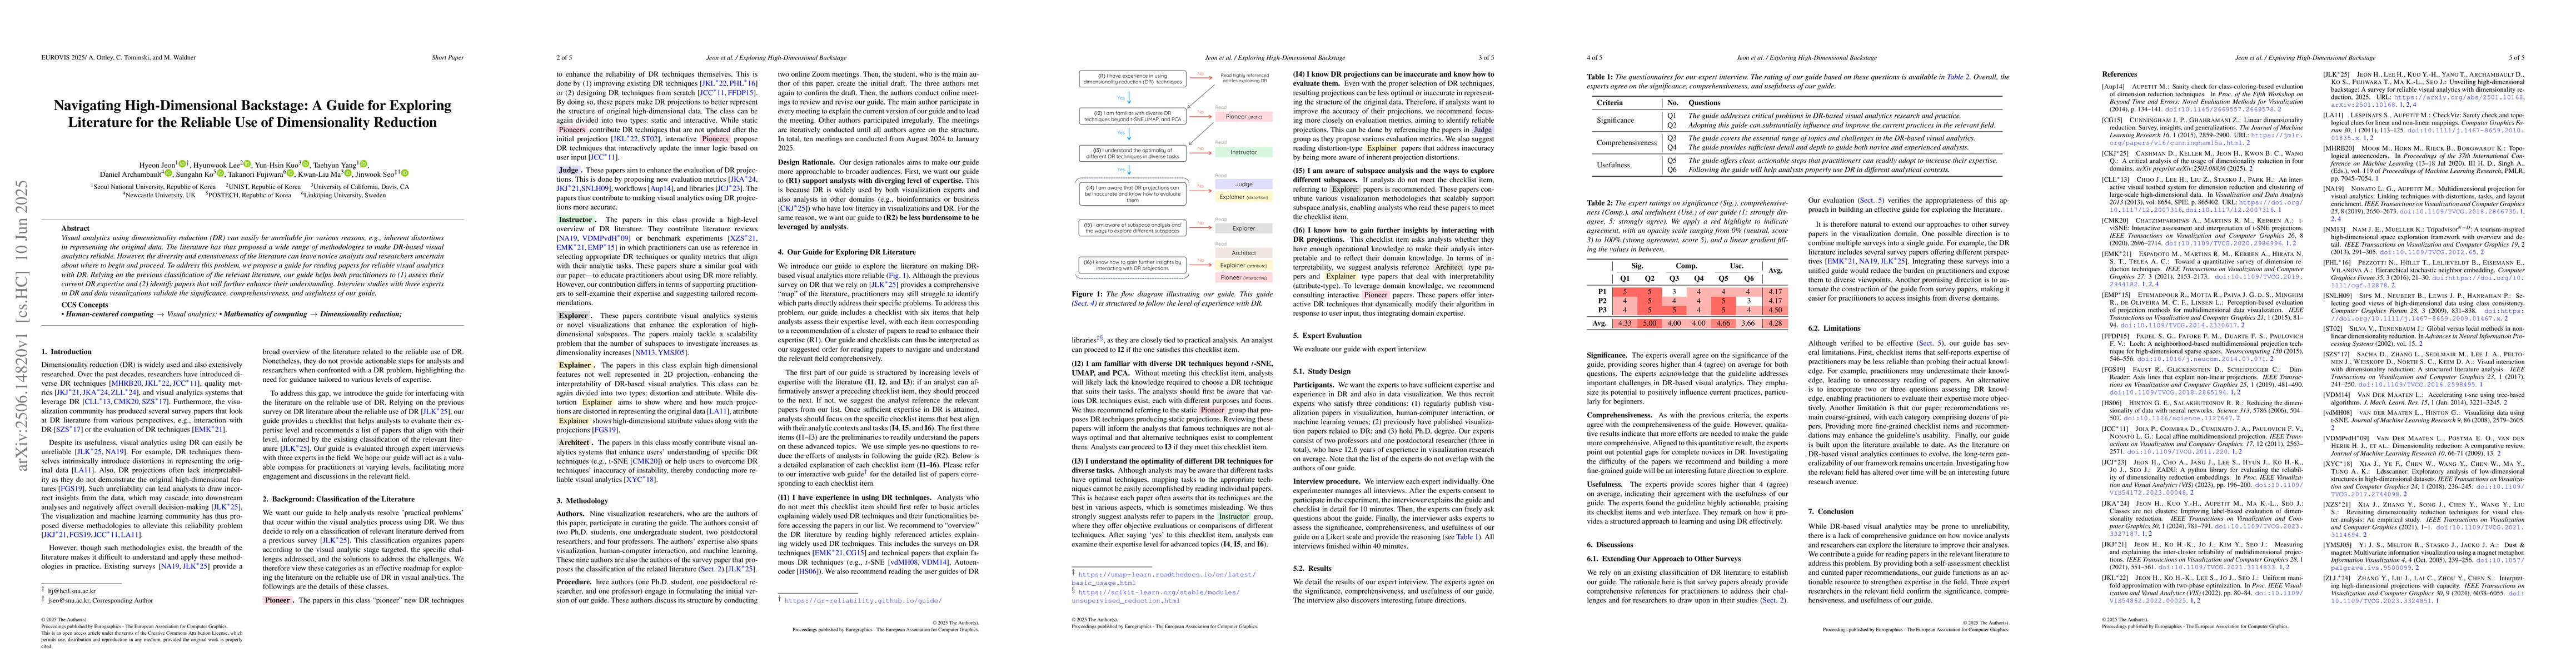
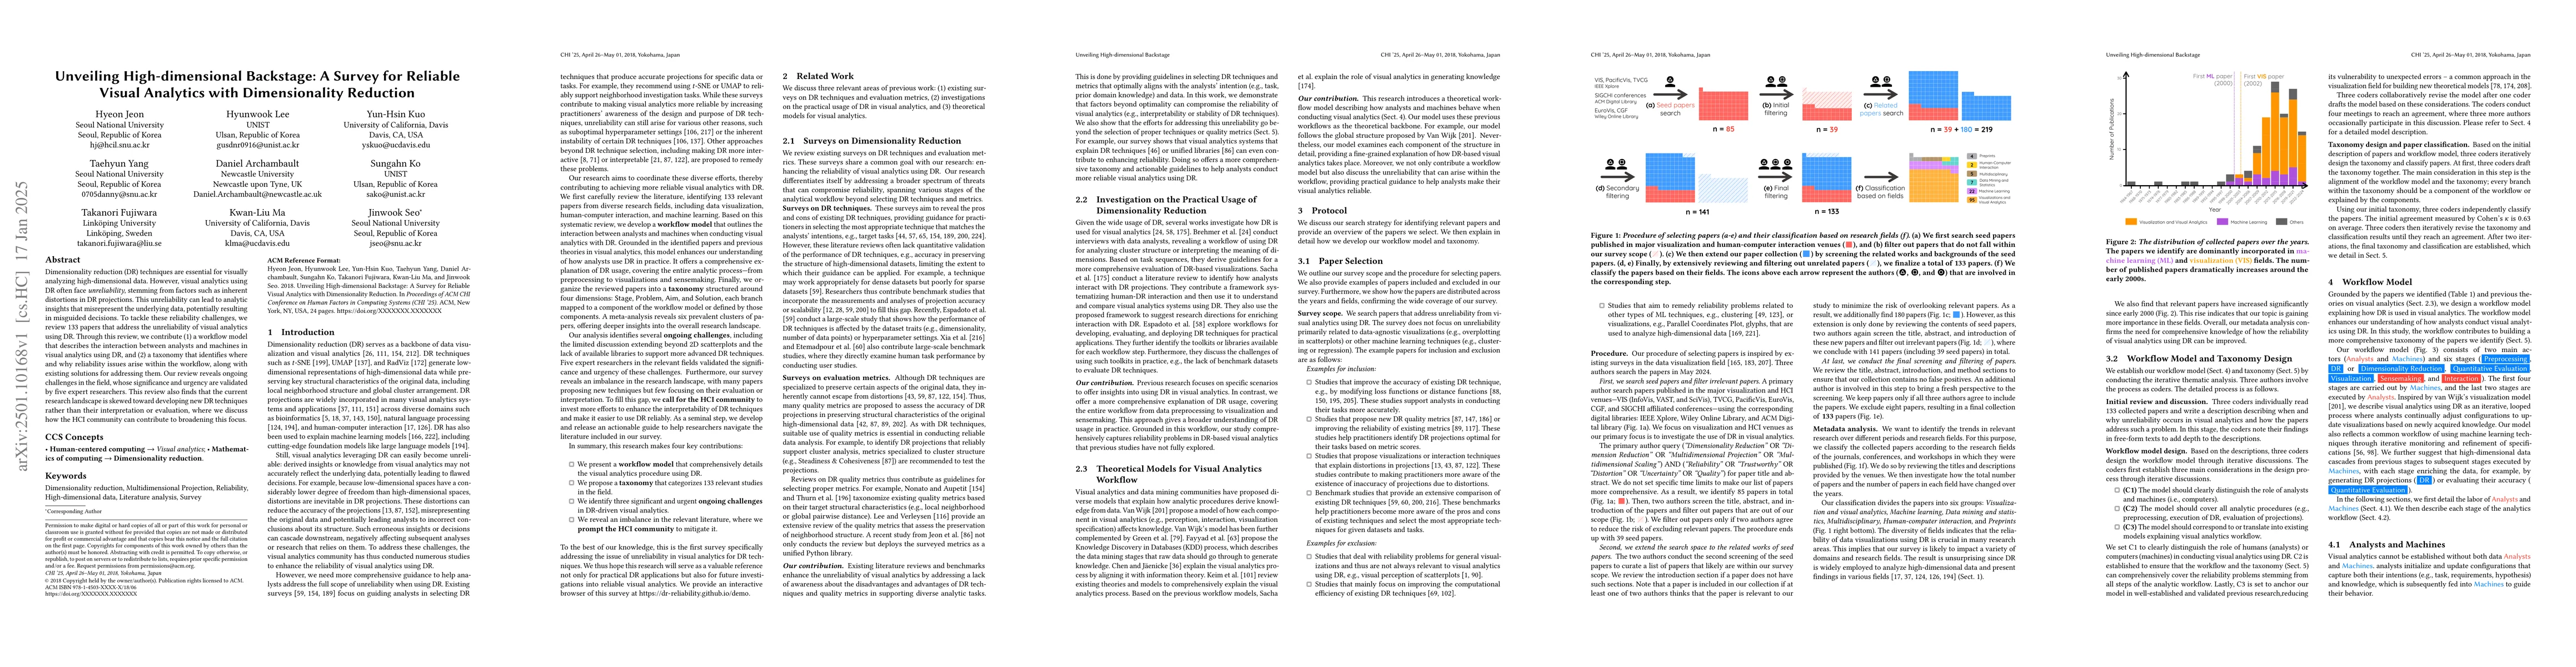
Visual analytics using dimensionality reduction (DR) can easily be unreliable for various reasons, e.g., inherent distortions in representing the original data. The literature has thus proposed a wide...
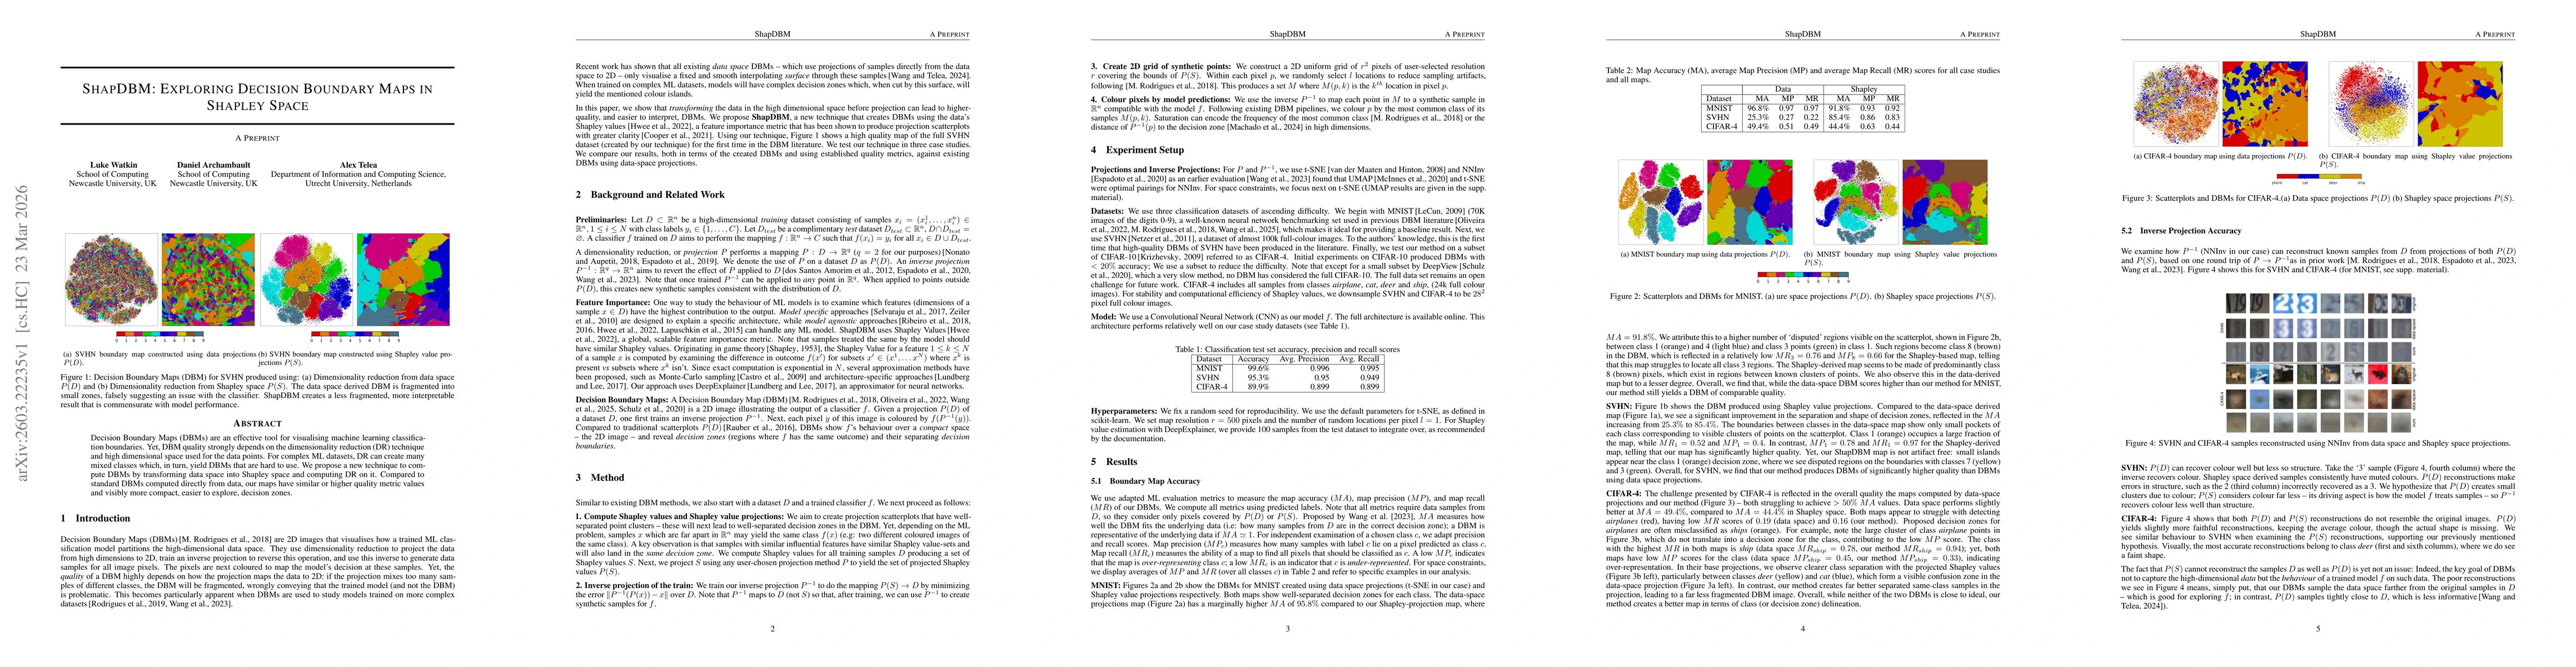
Decision Boundary Maps (DBMs) are an effective tool for visualising machine learning classification boundaries. Yet, DBM quality strongly depends on the dimensionality reduction (DR) technique and hig...