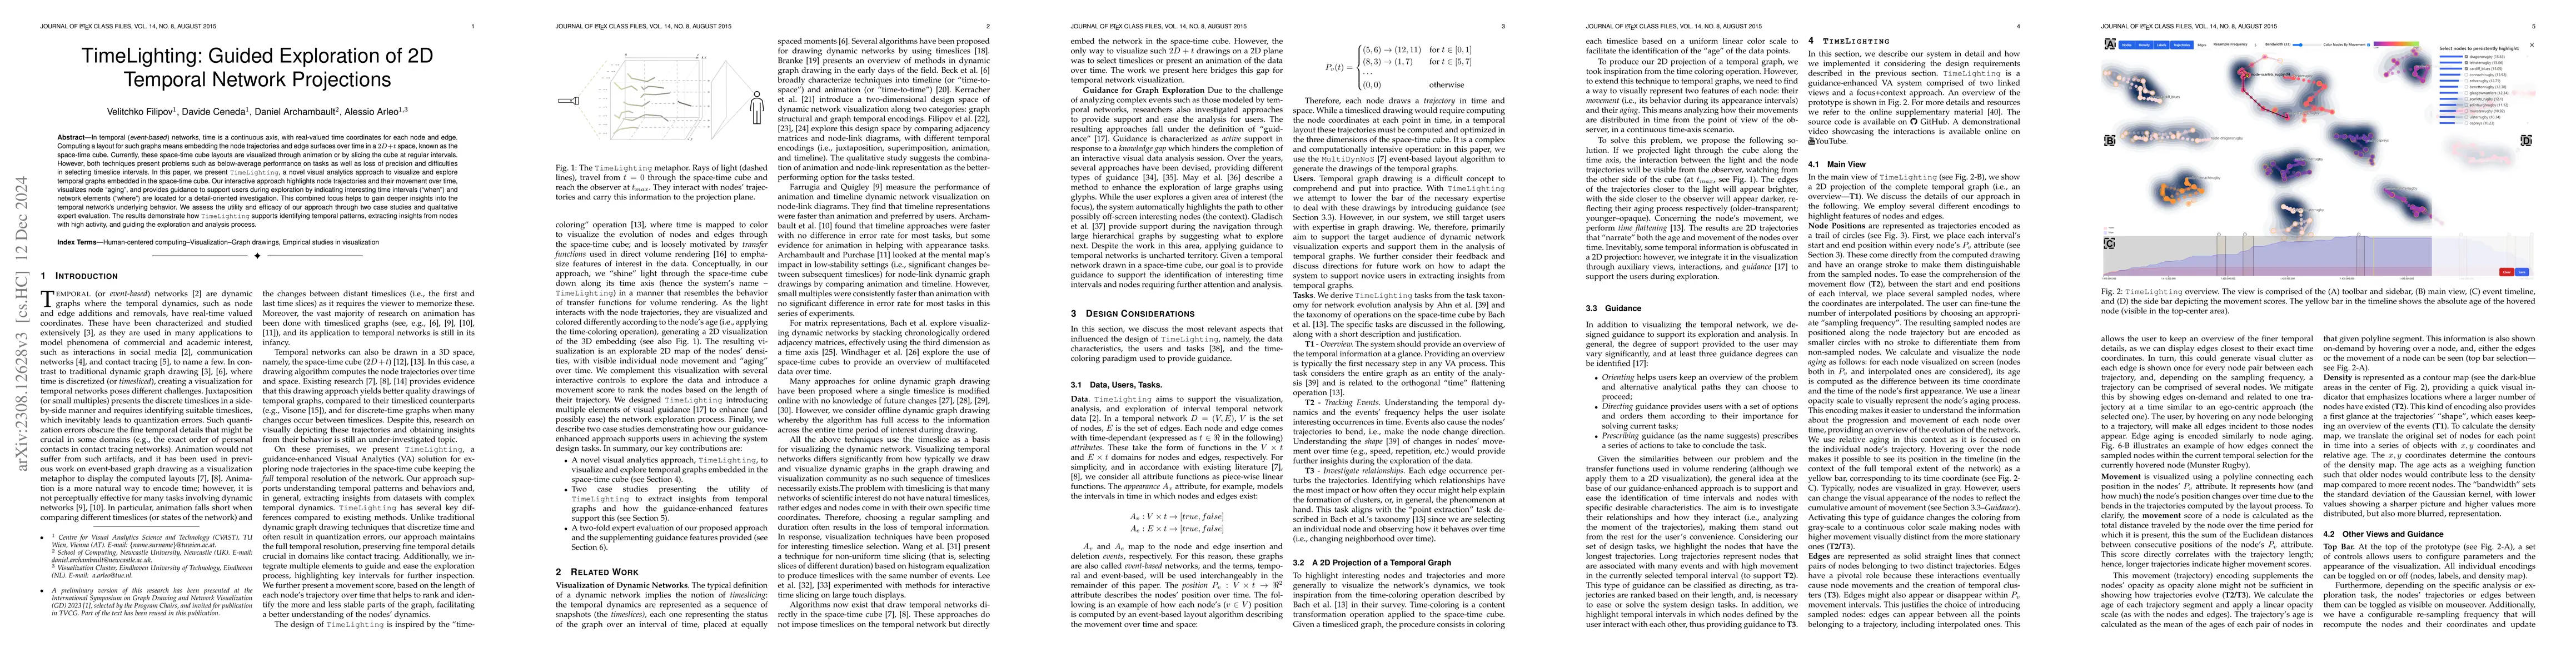
On Network Structural and Temporal Encodings: A Space and Time Odyssey
|
V. Filipov, Alessio Arleo, M. Bögl, S. Miksch
|
2023
|
View Paper
|
A Heuristic Approach for Dual Expert/End-User Evaluation of Guidance in Visual Analytics
|
D. Ceneda, C. Collins, Mennatallah El-Assady, S. Miksch, C. Tominski, Alessio Arleo
|
2023
|
View Paper
|
Are We There Yet? A Roadmap of Network Visualization from Surveys to Task Taxonomies
|
V. Filipov, Alessio Arleo, S. Miksch
|
2023
|
View Paper
|
On Time and Space: An Experimental Study on Graph Structural and Temporal Encodings
|
V. Filipov, Alessio Arleo, M. Bögl, S. Miksch
|
2022
|
View Paper
|
Event‐based Dynamic Graph Drawing without the Agonizing Pain
|
Alessio Arleo, S. Miksch, D. Archambault
|
2022
|
View Paper
|
Visual Analytics of Contact Tracing Policy Simulations During an Emergency Response
|
Max Sondag, C. Turkay, Kai Xu, L. Matthews, S. Mohr, D. Archambault
|
2022
|
View Paper
|
Show Me Your Face: Towards an Automated Method to Provide Timely Guidance in Visual Analytics
|
D. Ceneda, Alessio Arleo, T. Gschwandtner, S. Miksch
|
2021
|
View Paper
|
Visualizing Evolving Trees
|
Kathryn Gray, Mingwei Li, Abu Reyan Ahmed, S. Kobourov
|
2021
|
View Paper
|
Exploratory User Study on Graph Temporal Encodings
|
V. Filipov, Alessio Arleo, S. Miksch
|
2021
|
View Paper
|
The Effectiveness of Interactive Visualization Techniques for Time Navigation of Dynamic Graphs on Large Displays
|
Alexandra Lee, D. Archambault, Miguel A. Nacenta
|
2020
|
View Paper
|
Event-Based Dynamic Graph Visualisation
|
Paolo Simonetto, D. Archambault, S. Kobourov
|
2020
|
View Paper
|
Many Views Are Not Enough: Designing for Synoptic Insights in Cultural Collections
|
F. Windhager, Saminu M. Salisu, R. Leite, V. Filipov, S. Miksch, Günther Schreder, E. Mayr
|
2020
|
View Paper
|
Nonuniform Timeslicing of Dynamic Graphs Based on Visual Complexity
|
Yong Wang, D. Archambault, Hammad Haleem, Torsten Möller, Yanhong Wu, Huamin Qu
|
2019
|
View Paper
|
A Review of Guidance Approaches in Visual Data Analysis: A Multifocal Perspective
|
D. Ceneda, T. Gschwandtner, S. Miksch
|
2019
|
View Paper
|
Dynamic Network Plaid: A Tool for the Analysis of Dynamic Networks
|
Alexandra Lee, D. Archambault, Miguel A. Nacenta
|
2019
|
View Paper
|
A Heuristic Approach to Value-Driven Evaluation of Visualizations
|
Emily Wall, Meeshu Agnihotri, Laura E. Matzen, Kristin M. Divis, Michael J. Haass, A. Endert, J. Stasko
|
2019
|
View Paper
|
A Descriptive Framework for Temporal Data Visualizations Based on Generalized Space‐Time Cubes
|
Benjamin Bach, Pierre Dragicevic, D. Archambault, C. Hurter, M. Carpendale
|
2017
|
View Paper
|
Vispubdata.org: A Metadata Collection About IEEE Visualization (VIS) Publications
|
Petra Isenberg, Florian Heimerl, Steffen Koch, Tobias Isenberg, Panpan Xu, Charles D. Stolper, M. Sedlmair, Jian Chen, Torsten Möller, J. Stasko
|
2017
|
View Paper
|
Drawing Dynamic Graphs Without Timeslices
|
Paolo Simonetto, D. Archambault, S. Kobourov
|
2017
|
View Paper
|
A Taxonomy and Survey of Dynamic Graph Visualization
|
Fabian Beck, Michael Burch, S. Diehl, D. Weiskopf
|
2017
|
View Paper
|
State of the Art in Transfer Functions for Direct Volume Rendering
|
P. Ljung, J. Krüger, E. Gröller, Markus Hadwiger, C. Hansen, A. Ynnerman
|
2016
|
View Paper
|
Can animation support the visualisation of dynamic graphs?
|
D. Archambault, H. Purchase
|
2016
|
View Paper
|
Value-driven evaluation of visualizations
|
J. Stasko
|
2014
|
View Paper
|
Visualizing dynamic networks with matrix cubes
|
Benjamin Bach, Emmanuel Pietriga, Jean-Daniel Fekete
|
2014
|
View Paper
|
A Task Taxonomy for Network Evolution Analysis
|
Jae-wook Ahn, C. Plaisant, B. Shneiderman
|
2014
|
View Paper
|
A matter of time: Applying a data-users-tasks design triangle to visual analytics of time-oriented data
|
S. Miksch, W. Aigner
|
2014
|
View Paper
|
Navigation Recommendations for Exploring Hierarchical Graphs
|
Stefan Gladisch, H. Schumann, C. Tominski
|
2013
|
View Paper
|
Using Signposts for Navigation in Large Graphs
|
T. May, M. Steiger, J. Davey, J. Kohlhammer
|
2012
|
View Paper
|
A Quantitative Comparison of Stress-Minimization Approaches for Offline Dynamic Graph Drawing
|
U. Brandes, Martin Mader
|
2011
|
View Paper
|
Temporal Networks
|
Petter Holme, J. Saramäki
|
2011
|
View Paper
|
Animation, Small Multiples, and the Effect of Mental Map Preservation in Dynamic Graphs
|
D. Archambault, H. Purchase, Bruno Pinaud
|
2011
|
View Paper
|
Effective Temporal Graph Layout: A Comparative Study of Animation versus Static Display Methods
|
Michael Farrugia, A. Quigley
|
2011
|
View Paper
|
Online Dynamic Graph Drawing
|
Yaniv Frishman, A. Tal
|
2007
|
View Paper
|
Reality mining: sensing complex social systems
|
N. Eagle, A. Pentland
|
2006
|
View Paper
|
Visone Software for Visual Social Network Analysis
|
Michael Baur, M. Benkert, U. Brandes, Sabine Cornelsen, M. Gaertler, Boris Köpf, J. Lerner, D. Wagner
|
2001
|
View Paper
|
A framework for dynamic graph drawing
|
R. Cohen, G. Battista, R. Tamassia, I. Tollis, P. Bertolazzi
|
1992
|
View Paper
|
TimeLighting: Guidance-enhanced Exploration of 2D Projections of Temporal Graphs
|
V. Filipov, D. Ceneda, D. Archambault, Alessio Arleo
|
2023
|
View Paper
|
Davide
|
|
2020
|
|
Characterizing Guidance in Visual Analytics
|
D. Ceneda, T. Gschwandtner, T. May, S. Miksch, Hans-Jörg Schulz, M. Streit, C. Tominski
|
2017
|
View Paper
|
The Design Space of Temporal Graph Visualisation
|
Natalie Kerracher, J. Kennedy, K. Chalmers
|
2014
|
View Paper
|
Daniel Archambault received the PhD degree from the University of British Columbia
|
|
2008
|
|
WHAT ABOUT PEOPLE IN REGIONAL SCIENCE
|
Torsten Hägerstraand
|
1970
|
View Paper
|
TimeLighting Miro Board
|
|
|
|
“Networks in Time and Space: Visual Analytics of Dynamic Network Representations”
|
|
|
|
“PRO-12 Rugby Competition 2014-2015 Season Standings,”
|
|
|
|
Comments (0)