Academic Profile
Statistics
Similar Authors
Papers on arXiv
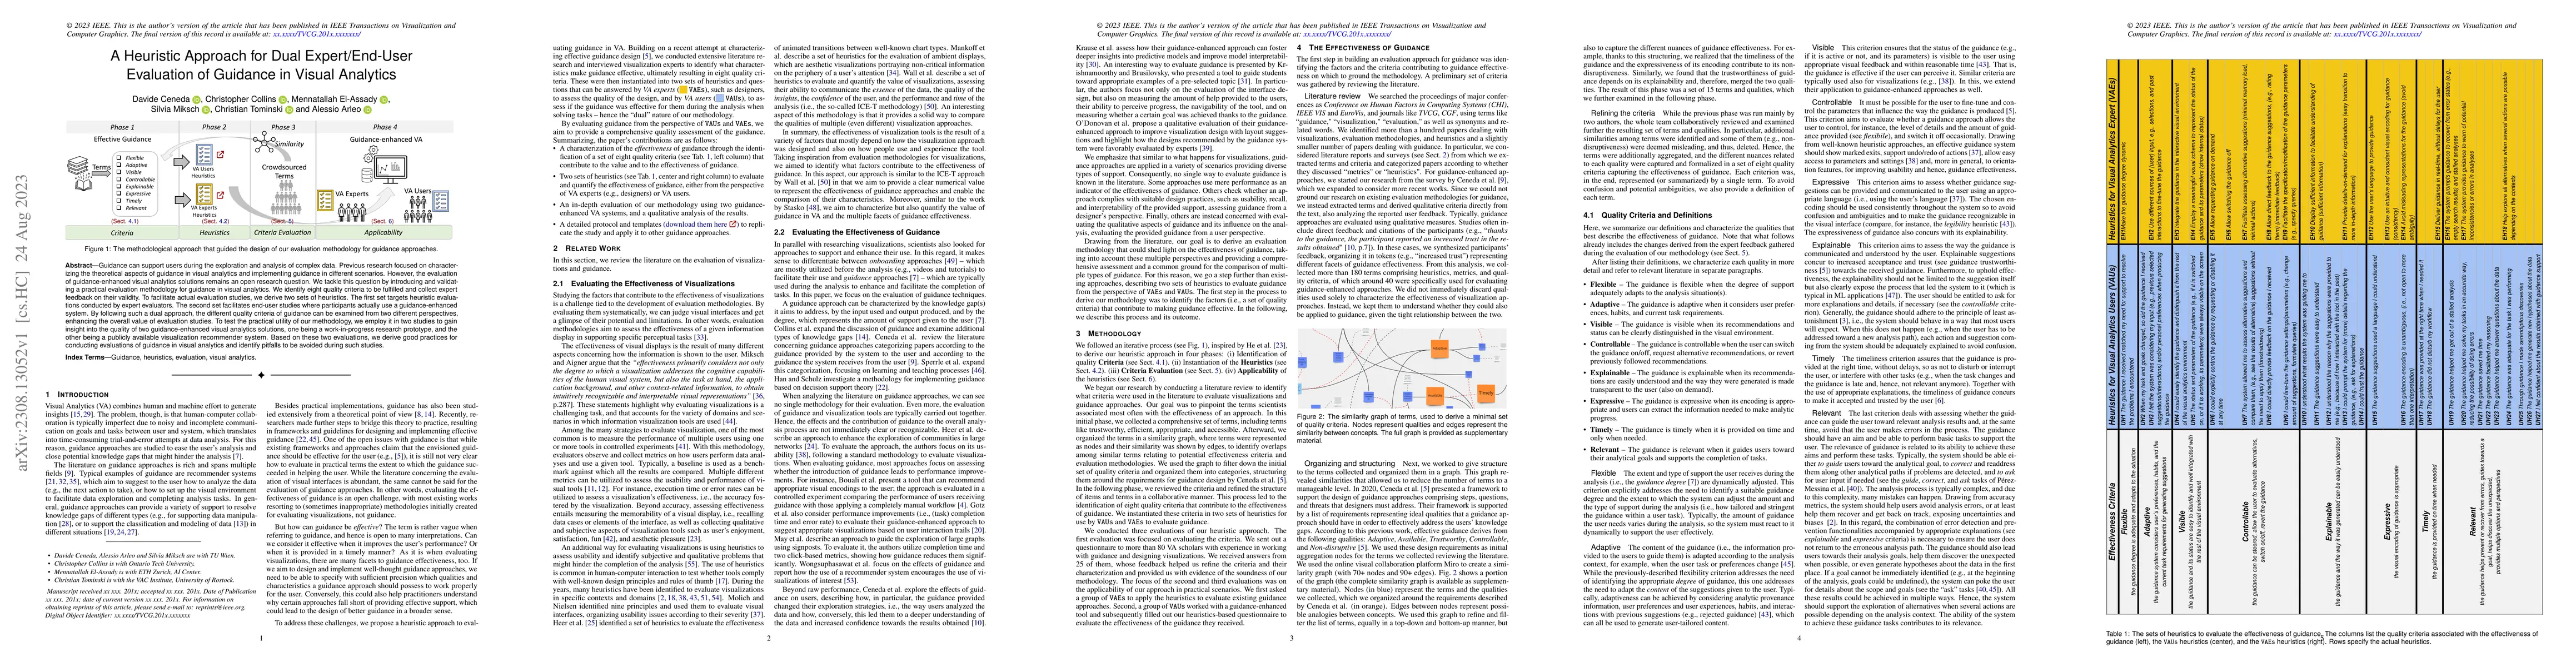
Guidance can support users during the exploration and analysis of complex data. Previous research focused on characterizing the theoretical aspects of guidance in visual analytics and implementing g...
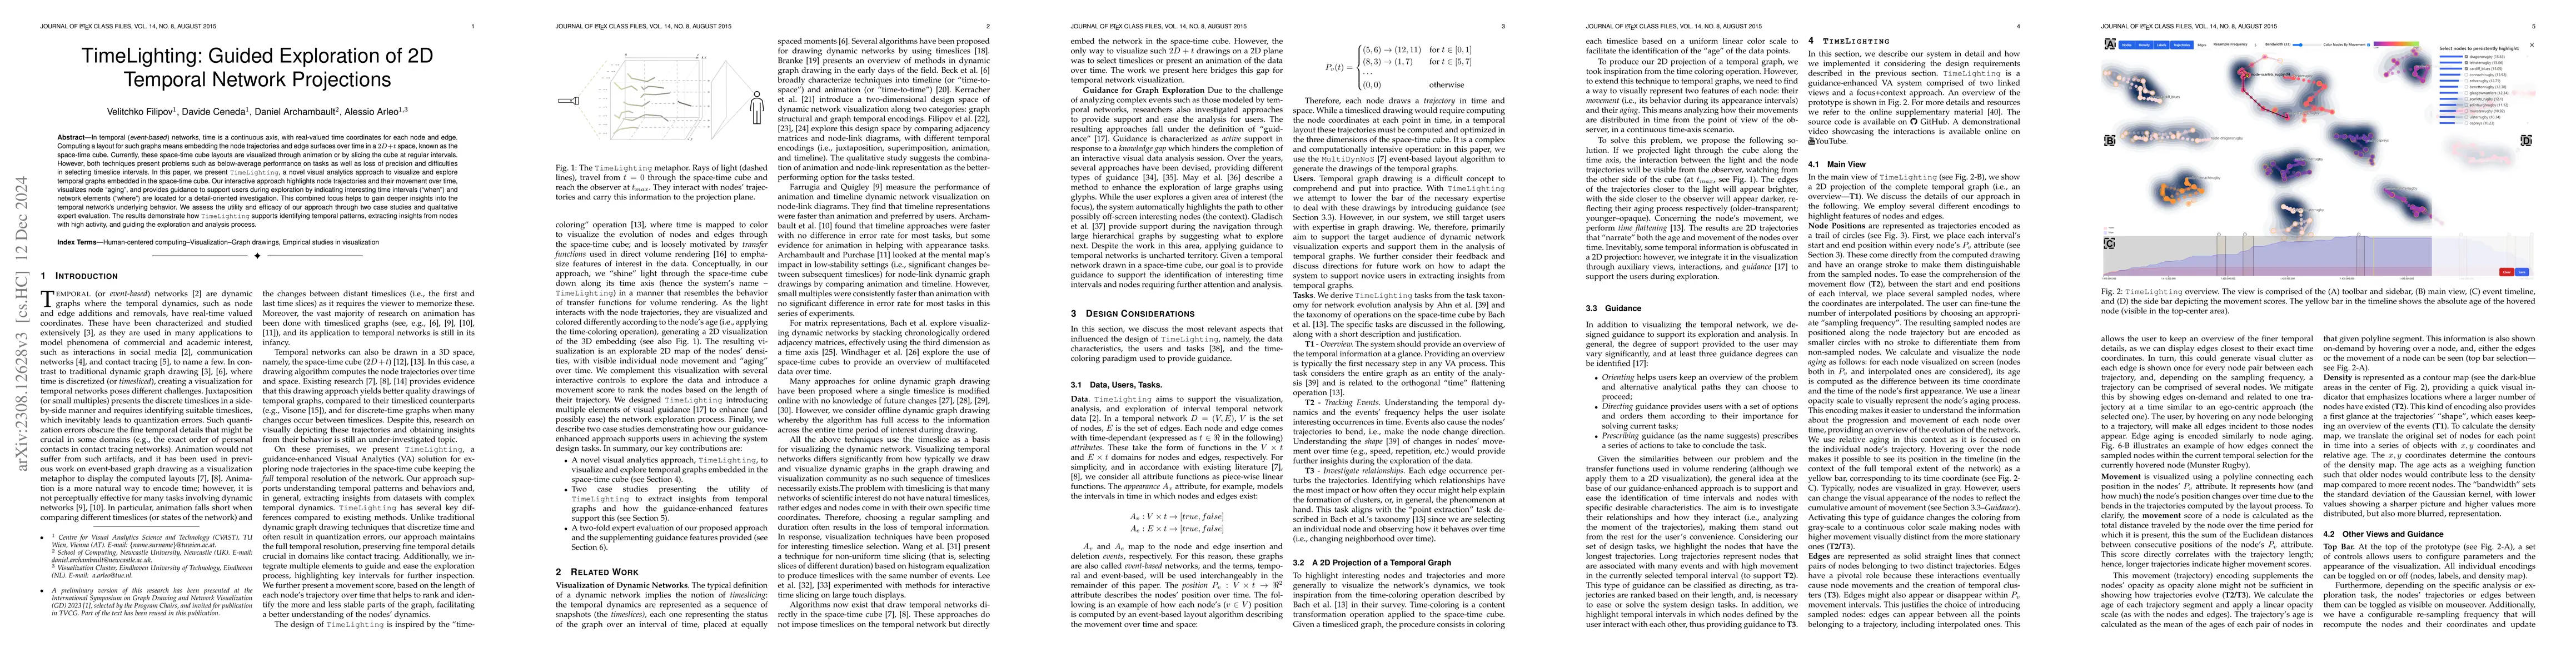
In temporal (or event-based) networks, time is a continuous axis, with real-valued time coordinates for each node and edge. Computing a layout for such graphs means embedding the node trajectories a...
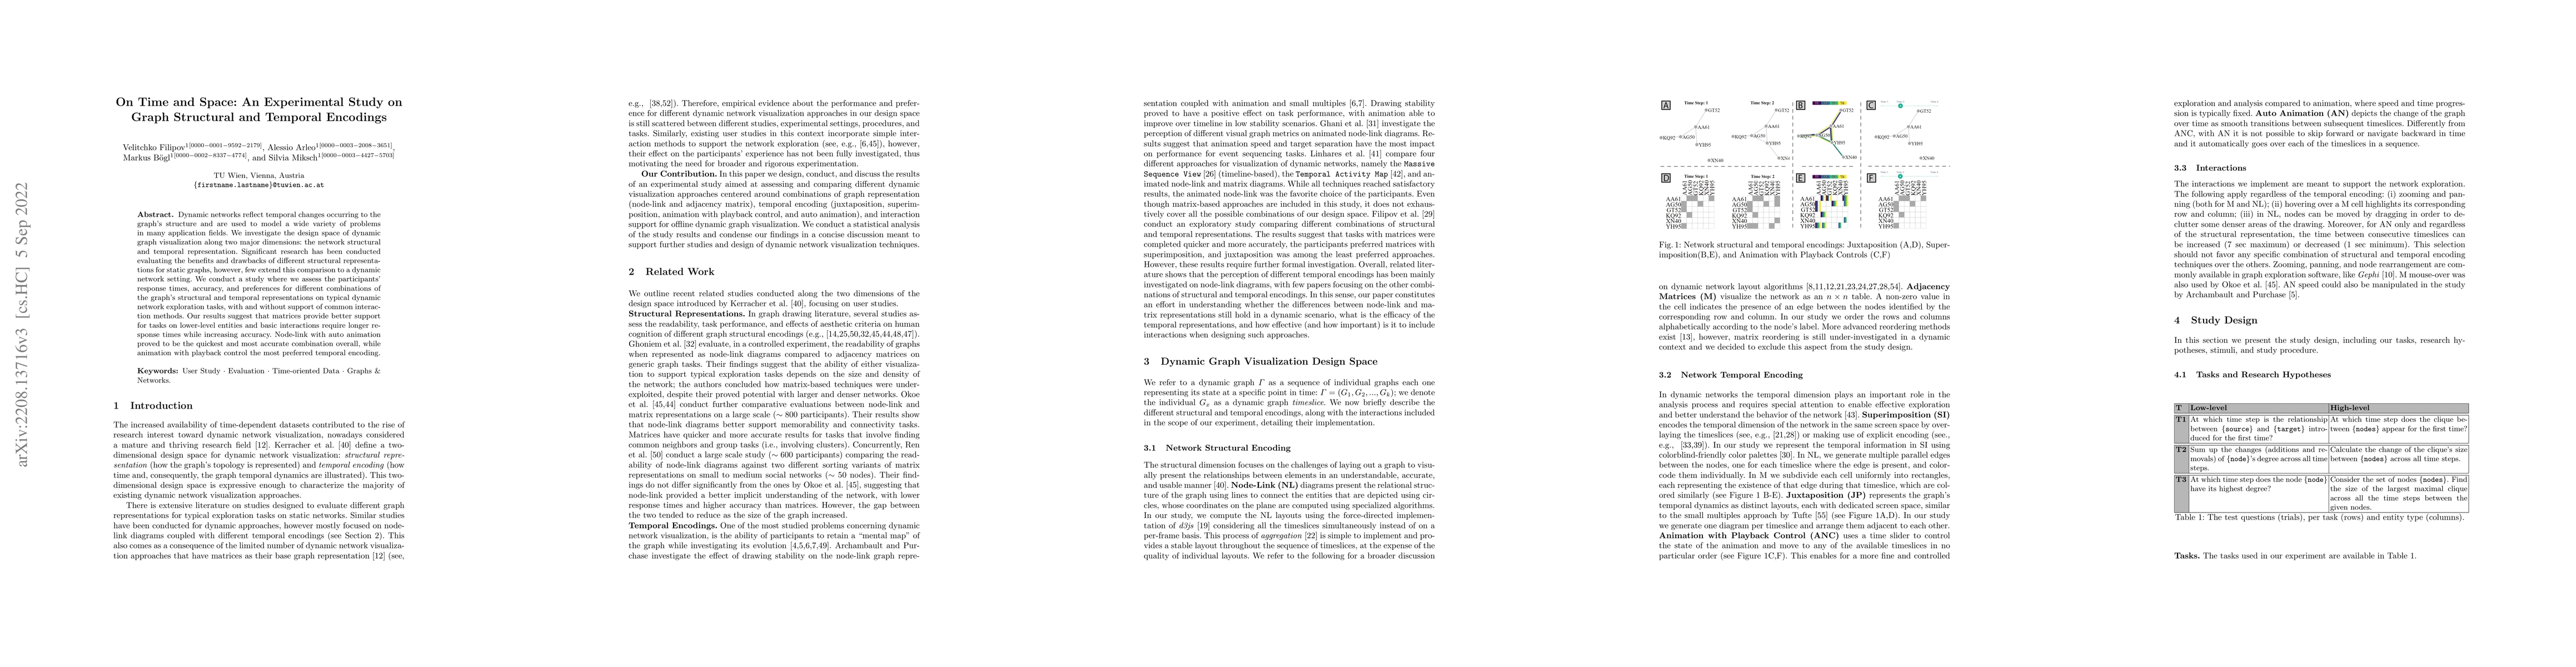
Dynamic networks reflect temporal changes occurring to the graph's structure and are used to model a wide variety of problems in many application fields. We investigate the design space of dynamic g...
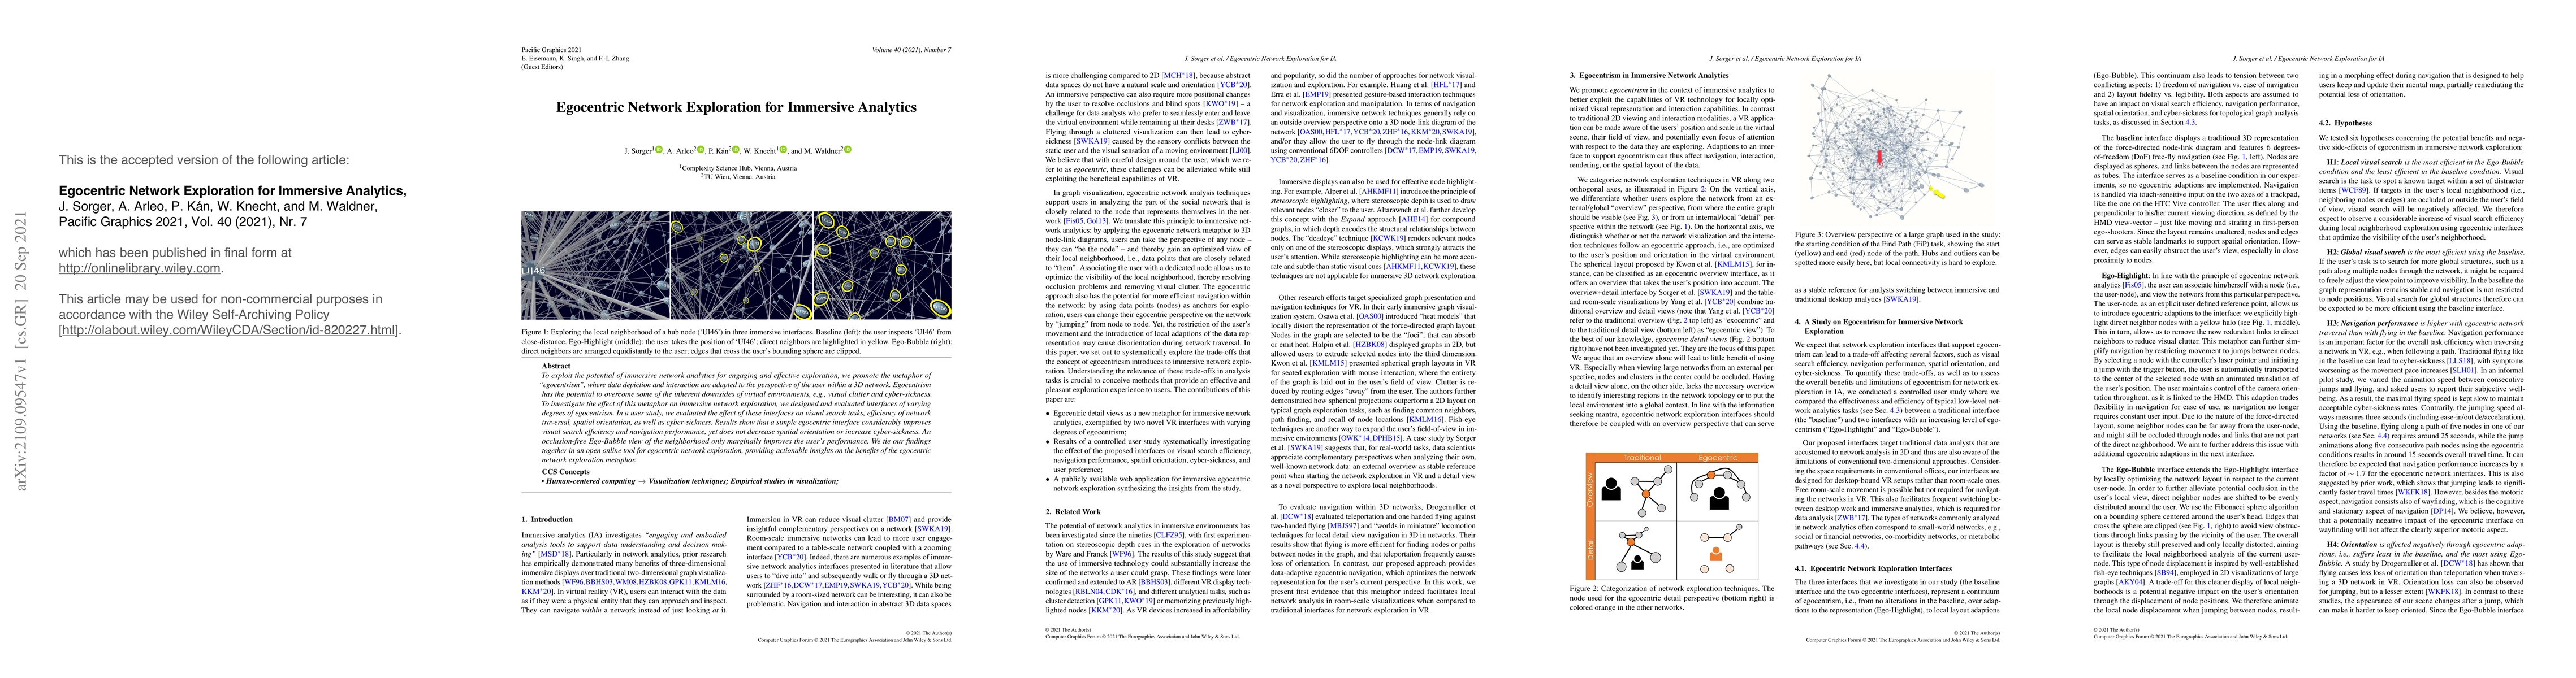
To exploit the potential of immersive network analytics for engaging and effective exploration, we promote the metaphor of "egocentrism", where data depiction and interaction are adapted to the pers...
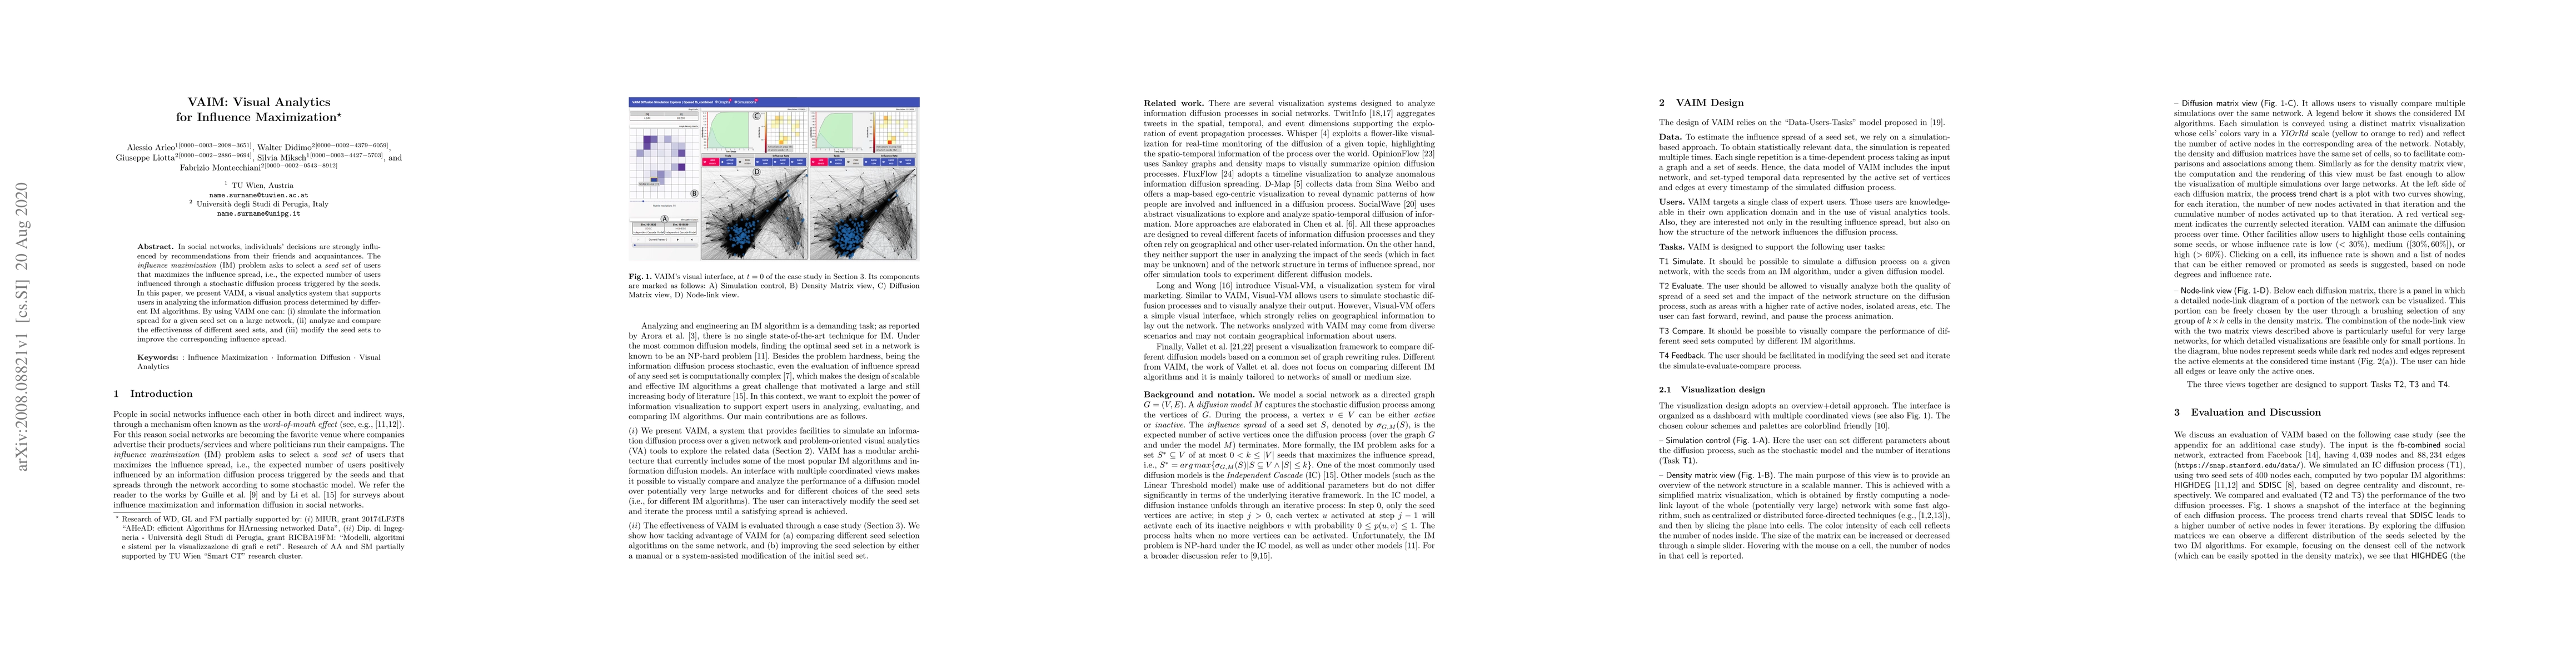
In social networks, individuals' decisions are strongly influenced by recommendations from their friends and acquaintances. The influence maximization (IM) problem asks to select a seed set of users...
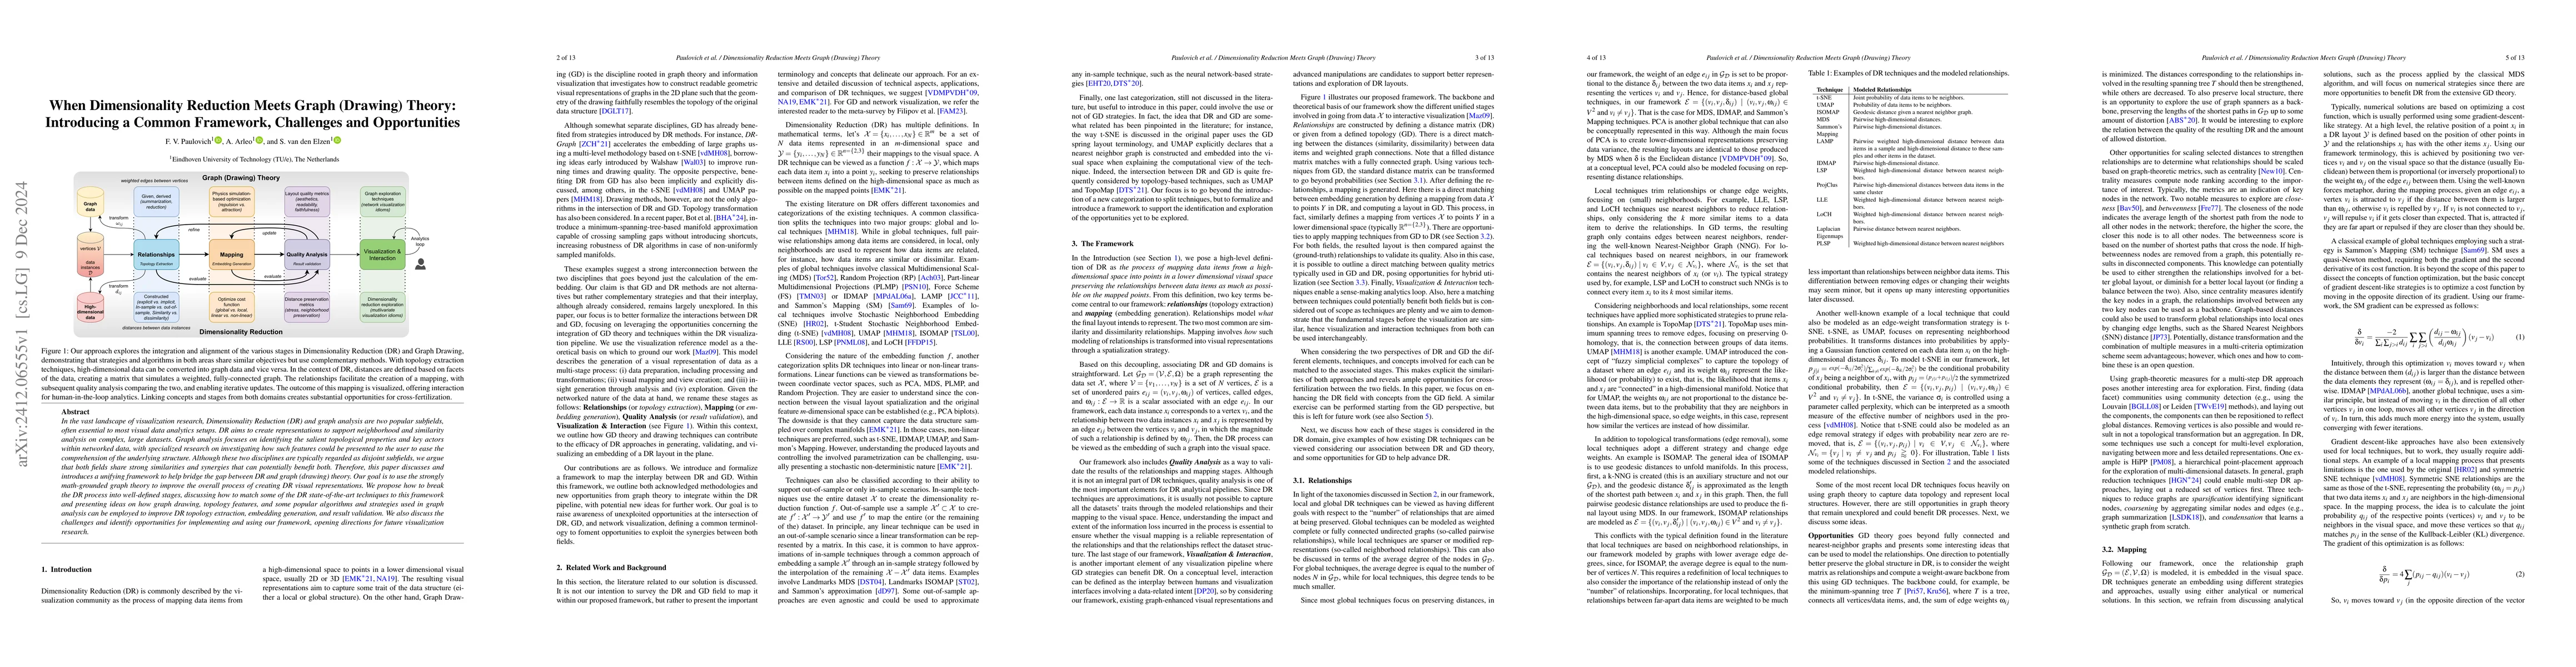
In the vast landscape of visualization research, Dimensionality Reduction (DR) and graph analysis are two popular subfields, often essential to most visual data analytics setups. DR aims to create rep...
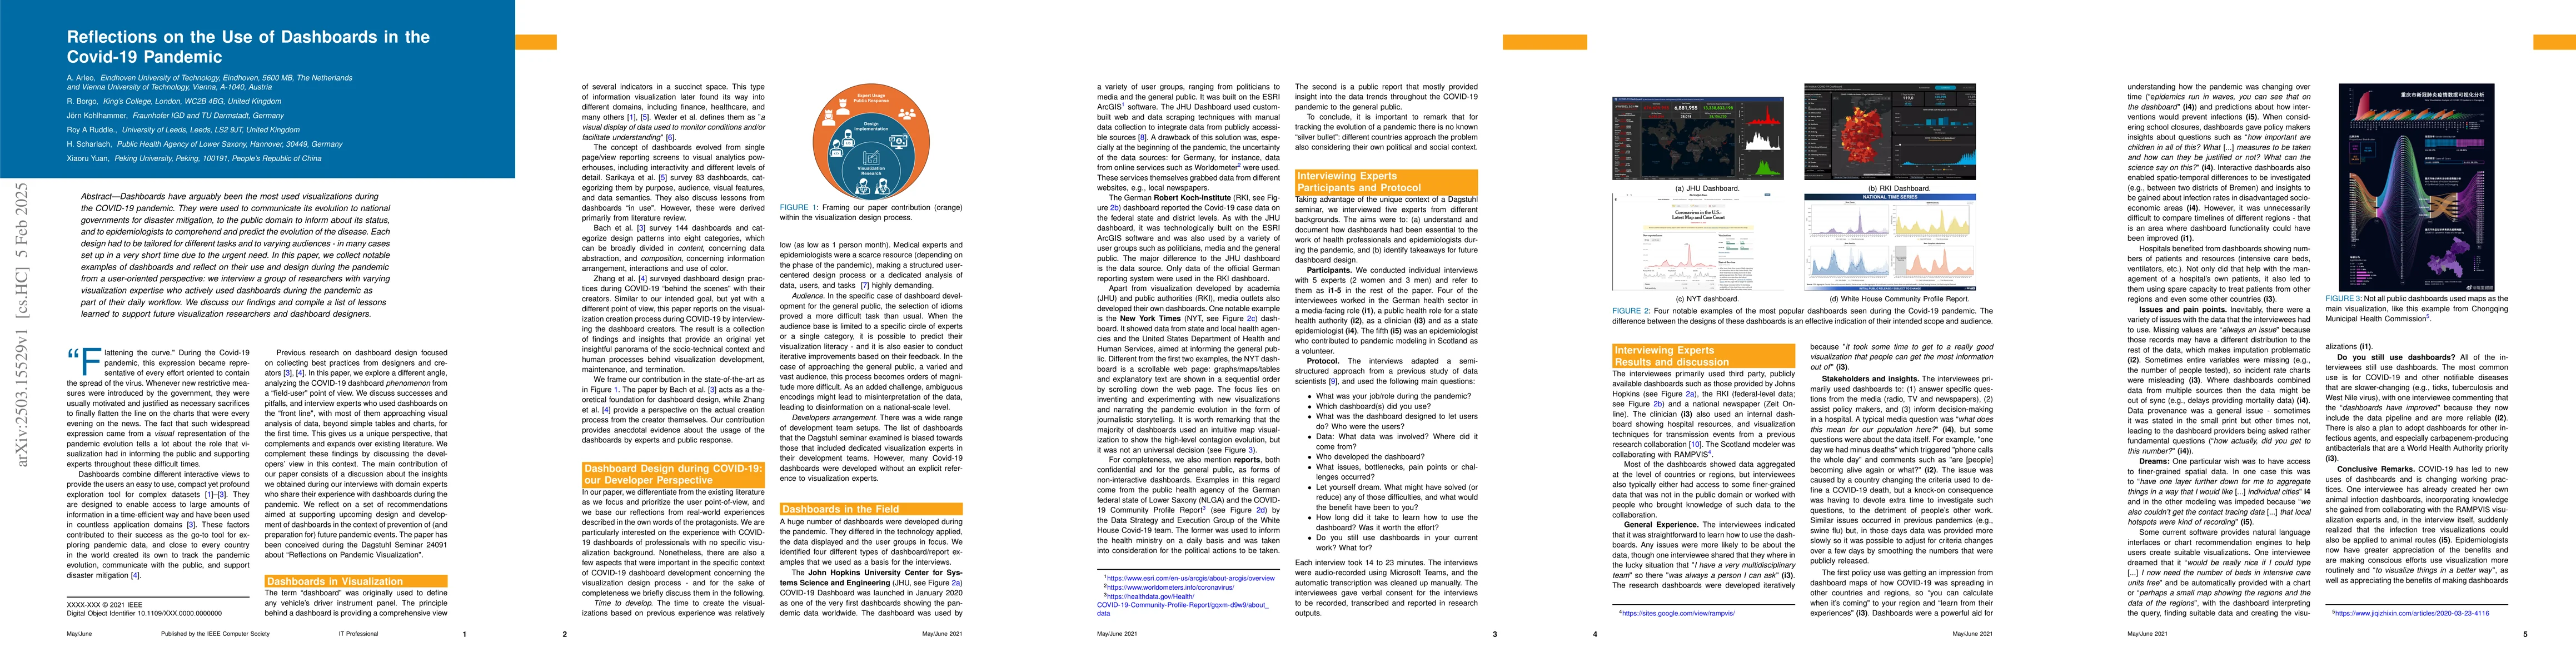
Dashboards have arguably been the most used visualizations during the COVID-19 pandemic. They were used to communicate its evolution to national governments for disaster mitigation, to the public doma...
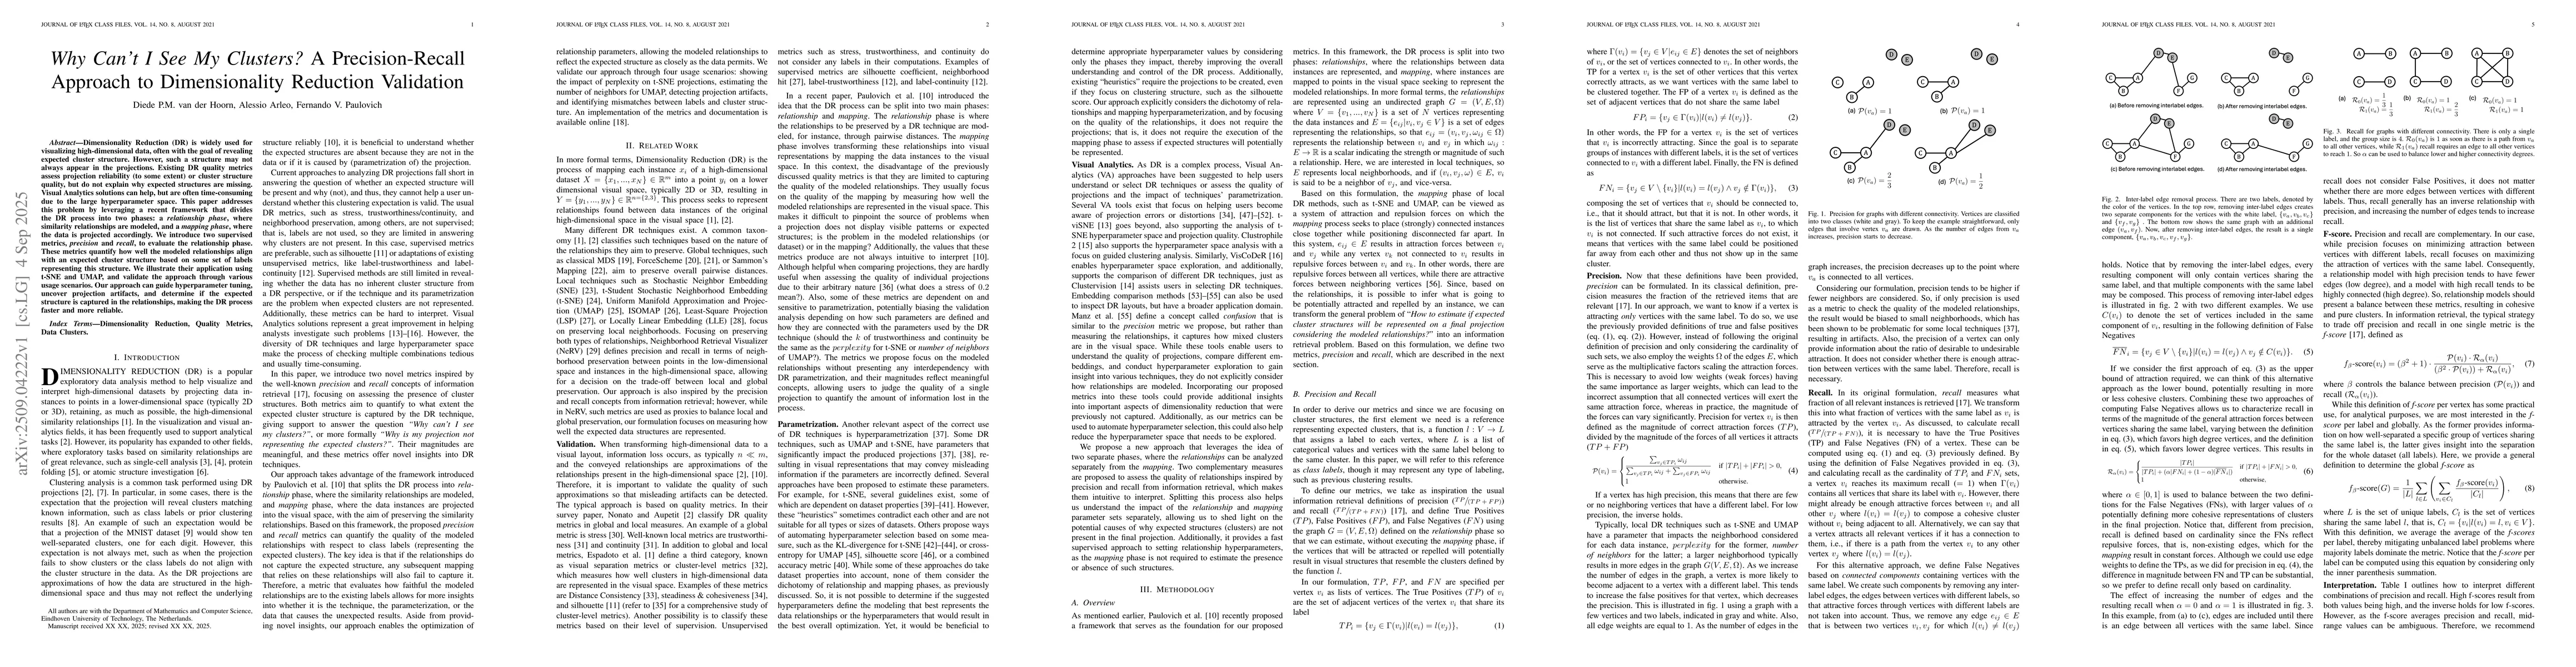
Dimensionality Reduction (DR) is widely used for visualizing high-dimensional data, often with the goal of revealing expected cluster structure. However, such a structure may not always appear in the ...
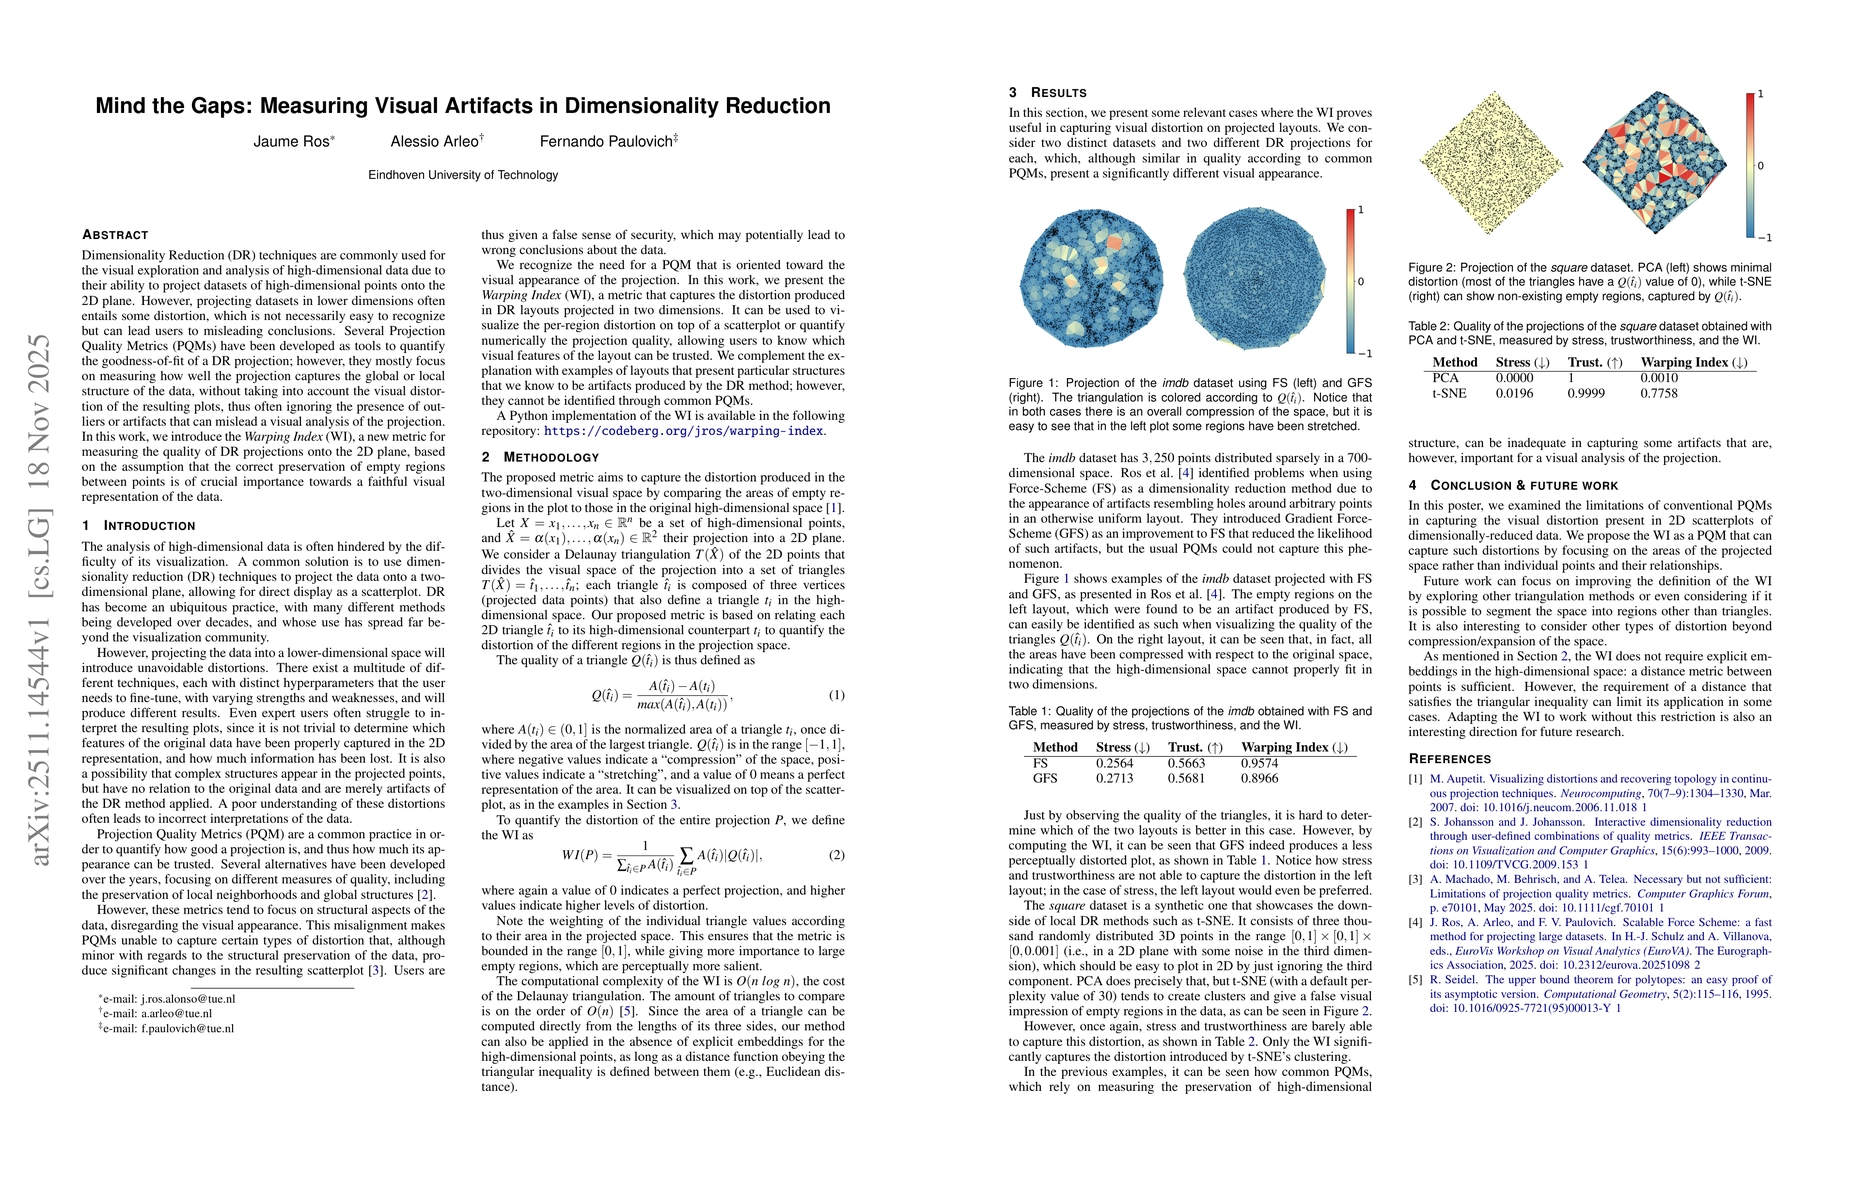
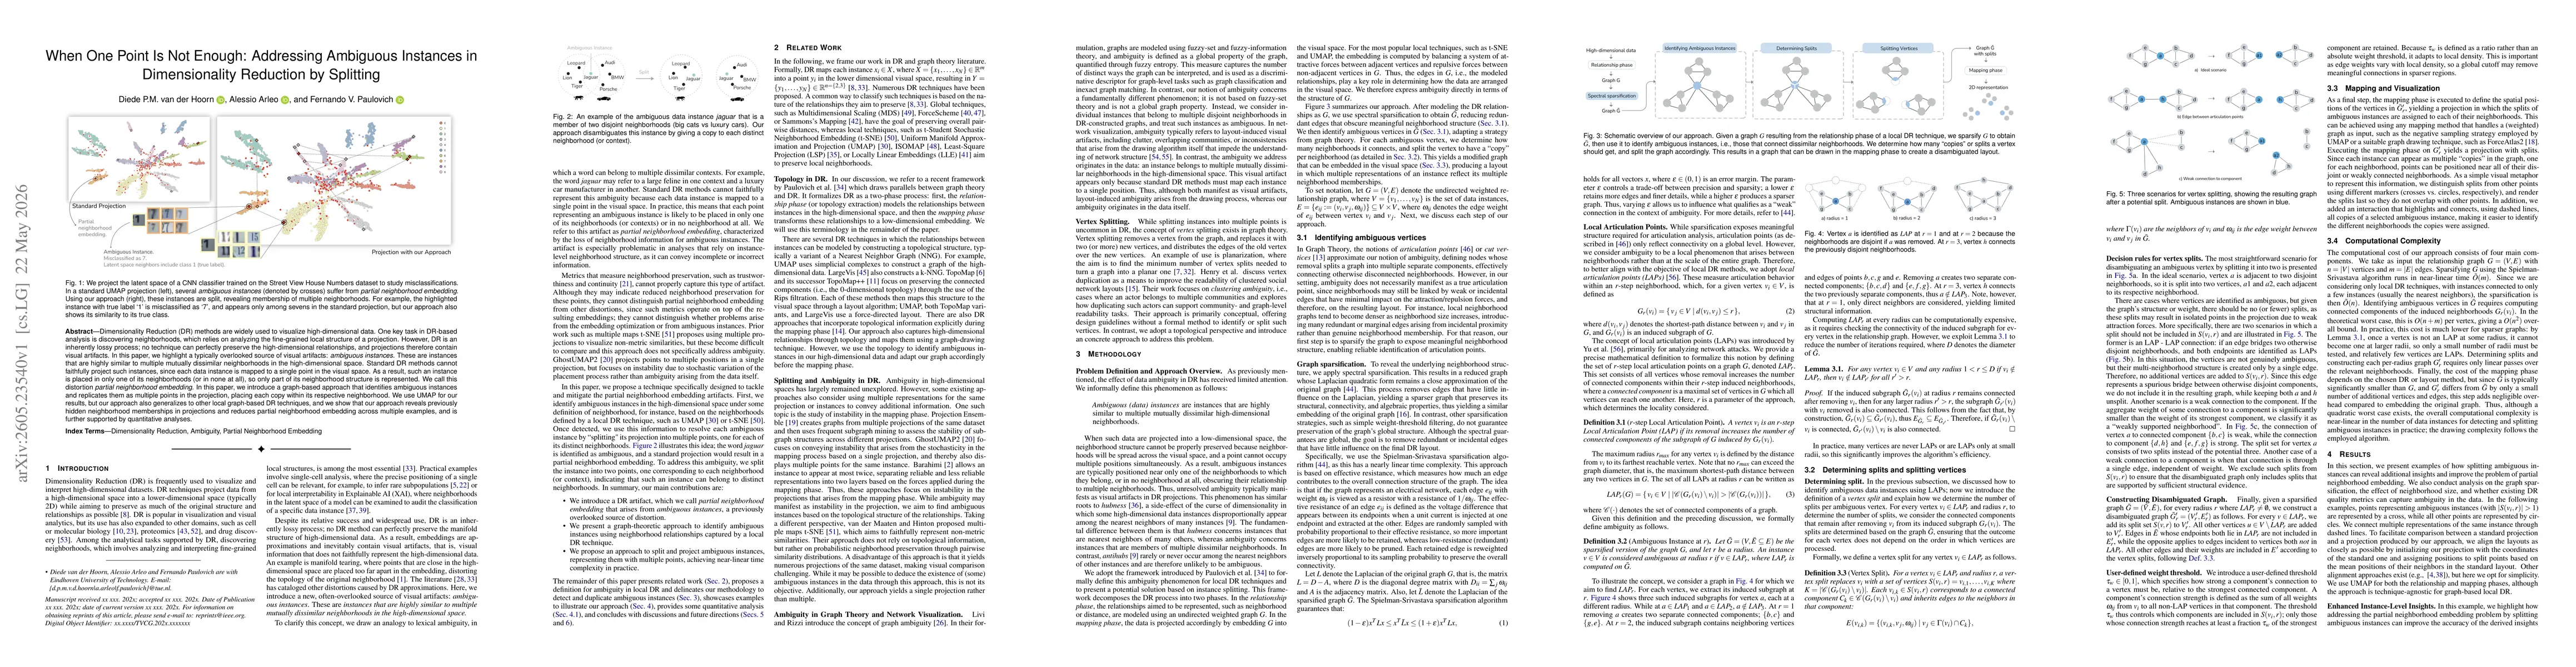
Dimensionality Reduction (DR) techniques are commonly used for the visual exploration and analysis of high-dimensional data due to their ability to project datasets of high-dimensional points onto the...
Dimensionality Reduction (DR) methods are widely used to visualize high-dimensional data. One key task in DR-based analysis is discovering neighborhoods, which relies on analyzing the fine-grained loc...
The intersection of AI, healthcare, and visualization is evolving rapidly, posing challenges that cut across disciplinary boundaries and resist easy resolution. The Visual Analytics in Healthcare work...