This study explores dynamic graph visualization by comparing structural and temporal representations, finding that matrices aid in lower-level tasks but basic interactions are slower, while node-link with auto animation is the fastest and most accurate overall. Participants prefer animations with playback control for temporal encoding.
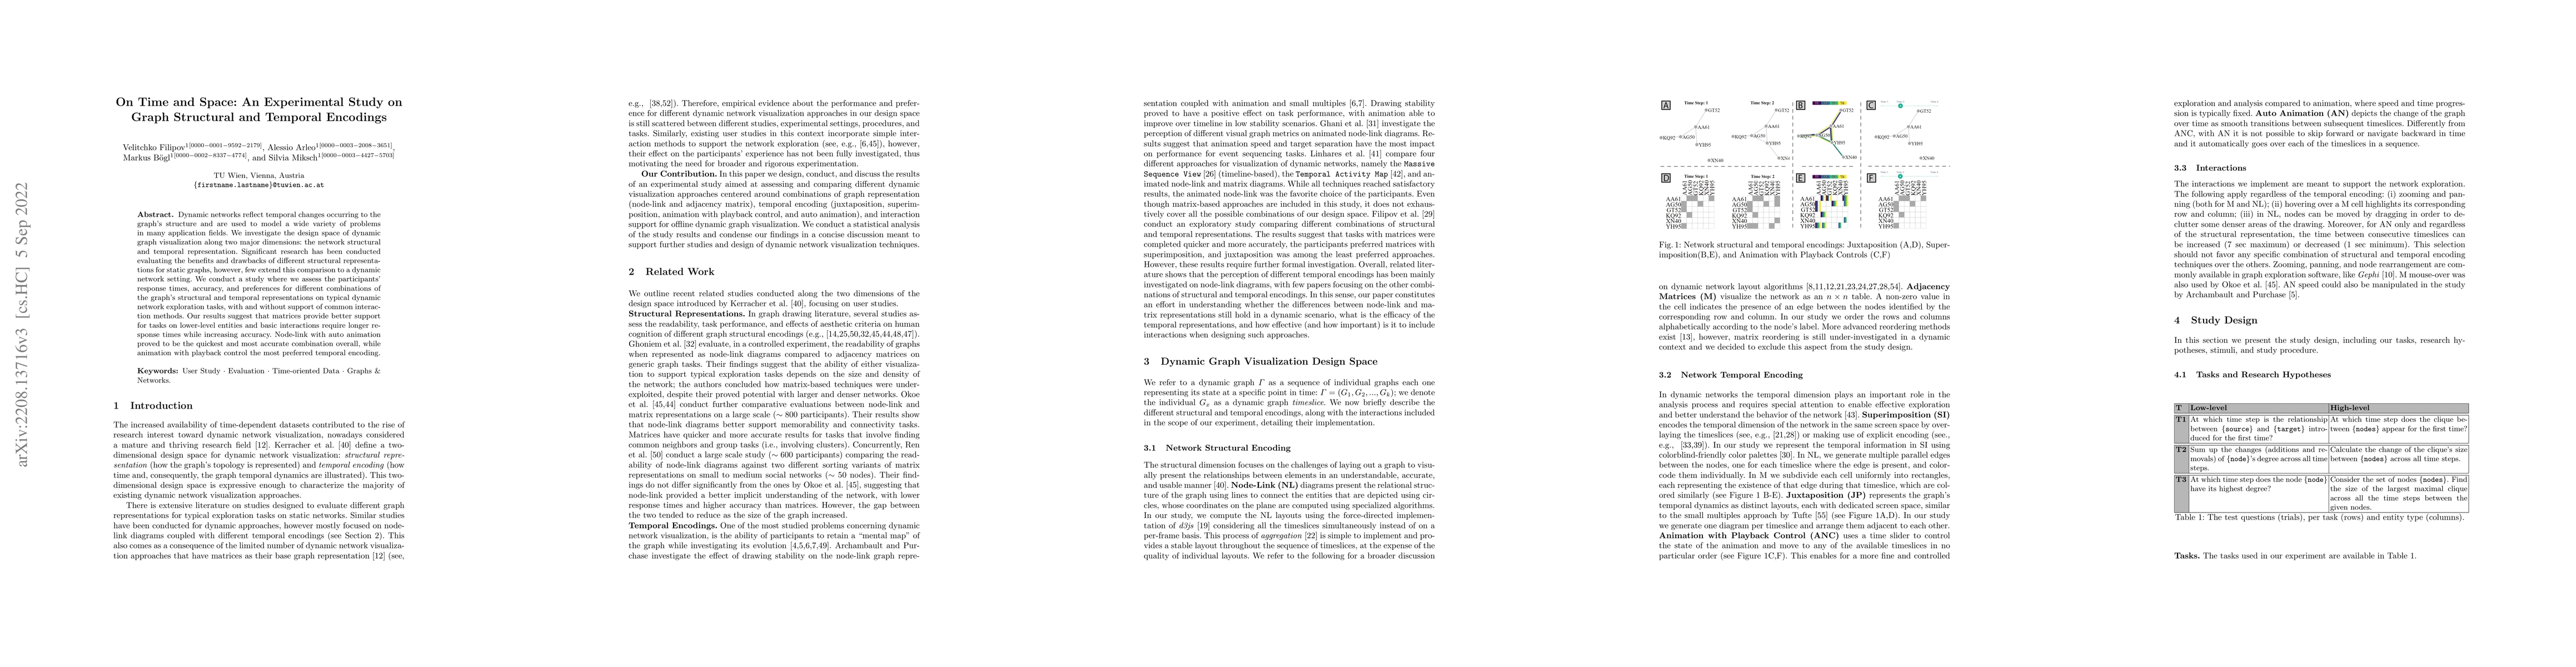
Dynamic networks reflect temporal changes occurring to the graph's structure and are used to model a wide variety of problems in many application fields. We investigate the design space of dynamic graph visualization along two major dimensions: the network structural and temporal representation. Significant research has been conducted evaluating the benefits and drawbacks of different structural representations for static graphs, however, few extend this comparison to a dynamic network setting. We conduct a study where we assess the participants' response times, accuracy, and preferences for different combinations of the graph's structural and temporal representations on typical dynamic network exploration tasks, with and without support of common interaction methods. Our results suggest that matrices provide better support for tasks on lower-level entities and basic interactions require longer response times while increasing accuracy. Node-link with auto animation proved to be the quickest and most accurate combination overall, while animation with playback control the most preferred temporal encoding.
Get AI-generated insights about this paper's methodology, results, and significance.
Current paper (gray), citations (green), references (blue)
No similar papers found for this research.
Title | Authors | Year | Actions |
---|---|---|---|
On Network Structural and Temporal Encodings: A Space and Time Odyssey
|
V. Filipov, Alessio Arleo, M. Bögl, S. Miksch
|
2023
|
View Paper |
TimeLighting: Guided Exploration of 2D Temporal Network Projections
|
V. Filipov, D. Ceneda, Daniel Archambault, Alessio Arleo
|
2023
|
View Paper |
Title | Authors | Year | Actions |
---|---|---|---|
Event‐based Dynamic Graph Drawing without the Agonizing Pain
|
Alessio Arleo, S. Miksch, D. Archambault
|
2022
|
View Paper |
A User Study on Hybrid Graph Visualizations
|
E. D. Giacomo, W. Didimo, F. Montecchiani, Alessandra Tappini
|
2021
|
View Paper |
A comparative analysis for visualizing the temporal evolution of contact networks: a user study
|
Claudio D. G. Linhares, Jean R. Ponciano, J. G. Paiva, B. Travençolo, Luis E C Rocha
|
2021
|
View Paper |
Exploratory User Study on Graph Temporal Encodings
|
V. Filipov, Alessio Arleo, S. Miksch
|
2021
|
View Paper |
Event-Based Dynamic Graph Visualisation
|
Paolo Simonetto, D. Archambault, S. Kobourov
|
2020
|
View Paper |
Array programming with NumPy
|
Charles R. Harris, K. Millman, S. Walt, R. Gommers, Pauli Virtanen, D. Cournapeau, Eric Wieser, Julian Taylor, Sebastian Berg, Nathaniel J. Smith, Robert Kern, Matti Picus, Stephan Hoyer, M. Kerkwijk, M. Brett, A. Haldane, Jaime Fern'andez del R'io, Marcy Wiebe, Pearu Peterson, Pierre G'erard-Marchant, Kevin Sheppard, Tyler Reddy, Warren Weckesser, Hameer Abbasi, C. Gohlke, T. Oliphant
|
2020
|
View Paper |
Node-Link or Adjacency Matrices: Old Question, New Insights
|
Mershack Okoe, R. Jianu, S. Kobourov
|
2019
|
View Paper |
SciPy 1.0: fundamental algorithms for scientific computing in Python
|
Pauli Virtanen, R. Gommers, T. Oliphant, Matt Haberland, Tyler Reddy, D. Cournapeau, Evgeni Burovski, Pearu Peterson, Warren Weckesser, Jonathan Bright, S. J. van der Walt, M. Brett, Joshua Wilson, K. Millman, N. Mayorov, Andrew R. J. Nelson, E. Jones, Robert Kern, Eric Larson, C. Carey, İlhan Polat, Yu Feng, Eric W. Moore, J. Vanderplas, D. Laxalde, Josef Perktold, R. Cimrman, Ian Henriksen, E. Quintero, Charles R. Harris, A. Archibald, Antônio H. Ribeiro, Fabian Pedregosa, P. van Mulbregt, Aditya Alessandro Pietro Alex Andreas Andreas Anthony Ant Vijaykumar Bardelli Rothberg Hilboll Kloeckner Sco, A. Vijaykumar, Alessandro Pietro Bardelli, Alex Rothberg, A. Hilboll, Andre Kloeckner, A. Scopatz, Antony Lee, Ariel S. Rokem, C. N. Woods, Chad Fulton, Charles Masson, C. Häggström, Clark Fitzgerald, D. Nicholson, David R. Hagen, D. Pasechnik, E. Olivetti, Eric Martin, Eric Wieser, Fabrice Silva, F. Lenders, Florian Wilhelm, G. Young, Gavin A. Price, G. Ingold, Gregory E. Allen, Gregory R. Lee, H. Audren, I. Probst, J. Dietrich, J. Silterra, James T. Webber, J. Slavič, J. Nothman, J. Buchner, Johannes Kulick, Johannes L. Schönberger, J. V. De Miranda Cardoso, J. Reimer, J. Harrington, Juan Rodríguez, Juan Nunez-Iglesias, Justin Kuczynski, K. Tritz, M. Thoma, M. Newville, Matthias Kümmerer, Maximilian Bolingbroke, Michael Tartre, M. Pak, Nathaniel J. Smith, N. Nowaczyk, Nikolay Shebanov, O. Pavlyk, P. A. Brodtkorb, Perry Lee, R. McGibbon, Roman Feldbauer, Sam Lewis, S. Tygier, Scott Sievert, S. Vigna, Stefan Peterson, S. More, Tadeusz Pudlik, T. Oshima, T. Pingel, T. Robitaille, Thomas Spura, T. Jones, T. Cera, Tim Leslie, Tiziano Zito, Tom Krauss, U. Upadhyay, Y. Halchenko, Y. Vázquez-Baeza
|
2019
|
View Paper |
Understanding node-link and matrix visualizations of networks: A large-scale online experiment
|
Donghao Ren, L. Marusich, J. O'Donovan, J. Bakdash, J. Schaffer, Daniel N. Cassenti, Sue E. Kase, Heather E. Roy, W. Lin, Tobias Höllerer
|
2019
|
View Paper |
Pingouin: statistics in Python
|
Raphael Vallat
|
2018
|
View Paper |
Exploring the Limits of Complexity: A Survey of Empirical Studies on Graph Visualisation
|
Vahan Yoghourdjian, D. Archambault, S. Diehl, Tim Dwyer, Karsten Klein, H. Purchase, Hsiang-Yun Wu
|
2018
|
View Paper |
Revisited Experimental Comparison of Node-Link and Matrix Representations
|
Mershack Okoe, R. Jianu, S. Kobourov
|
2017
|
View Paper |
DyNetVis: a system for visualization of dynamic networks
|
Claudio D. G. Linhares, B. Travençolo, J. G. Paiva, Luis E C Rocha
|
2017
|
View Paper |
A Taxonomy and Survey of Dynamic Graph Visualization
|
Fabian Beck, Michael Burch, S. Diehl, D. Weiskopf
|
2017
|
View Paper |
Matrix Reordering Methods for Table and Network Visualization
|
M. Behrisch, Benjamin Bach, N. Riche, Tobias Schreck, Jean-Daniel Fekete
|
2016
|
View Paper |
Can animation support the visualisation of dynamic graphs?
|
D. Archambault, H. Purchase
|
2016
|
View Paper |
Visual Techniques to Support Exploratory Analysis of Temporal Graph Data
|
Natalie Kerracher, J. Kennedy, K. Chalmers, Martin Graham
|
2015
|
View Paper |
AniMatrix: A Matrix-Based Visualization of Software Evolution
|
Sébastien Rufiange, G. Melançon
|
2014
|
View Paper |
Dynamic Network Visualization withExtended Massive Sequence Views
|
S. V. D. Elzen, Danny Holten, Jorik Blaas, J. V. Wijk
|
2014
|
View Paper |
A Task Taxonomy for Network Evolution Analysis
|
Jae-wook Ahn, C. Plaisant, B. Shneiderman
|
2014
|
View Paper |
A matter of time: Applying a data-users-tasks design triangle to visual analytics of time-oriented data
|
S. Miksch, W. Aigner
|
2014
|
View Paper |
The "Map" in the mental map: Experimental results in dynamic graph drawing
|
D. Archambault, H. Purchase
|
2013
|
View Paper |
Mental Map Preservation Helps User Orientation in Dynamic Graphs
|
D. Archambault, H. Purchase
|
2012
|
View Paper |
Perception of Animated Node‐Link Diagrams for Dynamic Graphs
|
Sohaib Ghani, N. Elmqvist, Ji Soo Yi
|
2012
|
View Paper |
Exploring the design space of composite visualization
|
Waqas Javed, N. Elmqvist
|
2012
|
View Paper |
D³ Data-Driven Documents
|
M. Bostock, Vadim Ogievetsky, Jeffrey Heer
|
2011
|
View Paper |
Visual comparison for information visualization
|
Michael Gleicher, Danielle Albers, Rick Walker, Ilir Jusufi, C. Hansen, Jonathan C. Roberts
|
2011
|
View Paper |
A Quantitative Comparison of Stress-Minimization Approaches for Offline Dynamic Graph Drawing
|
U. Brandes, Martin Mader
|
2011
|
View Paper |
Animation, Small Multiples, and the Effect of Mental Map Preservation in Dynamic Graphs
|
D. Archambault, H. Purchase, Bruno Pinaud
|
2011
|
View Paper |
Gephi: An Open Source Software for Exploring and Manipulating Networks
|
Mathieu Bastian, Sebastien Heymann, Mathieu Jacomy
|
2009
|
View Paper |
Exploring Network Structure, Dynamics, and Function using NetworkX
|
A. Hagberg, D. Schult, P. Swart, JM Hagberg
|
2008
|
View Paper |
MatLink: Enhanced Matrix Visualization for Analyzing Social Networks
|
N. Riche, Jean-Daniel Fekete
|
2007
|
View Paper |
The Aesthetics of Graph Visualization
|
C. Bennett, Jody Ryall, Leo Spalteholz, A. Gooch
|
2007
|
View Paper |
How Important Is the "Mental Map"? - An Empirical Investigation of a Dynamic Graph Layout Algorithm
|
H. Purchase, Eve E. Hoggan, C. Görg
|
2006
|
View Paper |
A Comparison of the Readability of Graphs Using Node-Link and Matrix-Based Representations
|
M. Ghoniem, Jean-Daniel Fekete, P. Castagliola
|
2004
|
View Paper |
Exploring the computing literature using temporal graph visualization
|
C. Erten, P. J. Harding, S. Kobourov, K. Wampler, Gary V. Yee
|
2004
|
View Paper |
GraphAEL: Graph Animations with Evolving Layouts
|
C. Erten, P. J. Harding, S. Kobourov, K. Wampler, Gary V. Yee
|
2003
|
View Paper |
A system for graph-based visualization of the evolution of software
|
C. Collberg, S. Kobourov, J. Nagra, J. Pitts, K. Wampler
|
2003
|
View Paper |
Directed scale-free graphs
|
B. Bollobás, C. Borgs, J. Chayes, O. Riordan
|
2003
|
View Paper |
Visual unrolling of network evolution and the analysis of dynamic discourse
|
U. Brandes, Steven R. Corman
|
2002
|
View Paper |
Empirical Evaluation of Aesthetics-based Graph Layout
|
H. Purchase, D. Carrington, Jo-Anne Allder
|
2002
|
View Paper |
Visone Software for Visual Social Network Analysis
|
Michael Baur, M. Benkert, U. Brandes, Sabine Cornelsen, M. Gaertler, Boris Köpf, J. Lerner, D. Wagner
|
2001
|
View Paper |
Statistical mechanics of complex networks
|
R. Albert, A. Barabási
|
2001
|
View Paper |
The effects of graph layout
|
H. Purchase
|
1998
|
View Paper |
The Visual Display of Quantitative Information
|
E. Tufte
|
1985
|
View Paper |
The Visual Display of Quantitative Information
|
T. Obremski
|
1984
|
View Paper |
An Analysis of Transformations
|
G. Box, D. Cox
|
1964
|
View Paper |
Teoria Statistica Delle Classi e Calcolo Delle Probabilità
|
2022
|
View Paper | |
Angewandte Statistik
|
J. Hedderich, L. Sachs
|
2020
|
View Paper |
Networkx: Network analysis with python
|
2020
|
||
Fortgeschrittene multivariate Analysemethoden: eine anwendungsorientierte Einführung.
|
Backhaus, Erichson, Weiber
|
2015
|
View Paper |
The Design Space of Temporal Graph Visualisation
|
Natalie Kerracher, J. Kennedy, K. Chalmers
|
2014
|
View Paper |
Statistik für Sozialwissenschaftler
|
E. Standard
|
2012
|
View Paper |
Is it really robust? reinvestigating the robustness of anova against violations of the normal distribution
|
2010
|
||
Basiswissen medizinische statistik, vol. 4
|
2005
|
||
Alternatives to the Median Absolute Deviation
|
P. Rousseeuw, C. Croux
|
1993
|
View Paper |
Robustness of the Two-Sample T-Test
|
H. Posten
|
1984
|
View Paper |
The effects of violations of assumptions underlying the test.
|
C. A. Boneau
|
1960
|
View Paper |
Journal of Graph Algorithms and Applications an Incremental Layout Method for Visualizing Online Dynamic Graphs
|
Tarik Crnovrsanin, J. Chu, K. Ma, E. Di, Giacomo, A. Lubiw
|
View Paper | |
Surveyjs -survey and form javascript libraries
|
|||
viridis - Colorblind-Friendly Color Maps for R, r package version 0.6.2
|
Showing first page preview. Click "Open Full PDF" to view the complete paper.
Your comment contains inappropriate language and has been rejected.
Are you sure you want to remove this tag? This action cannot be undone.
Someone just favorited a paper!
Comments (0)