Academic Profile
Statistics
Similar Authors
Papers on arXiv
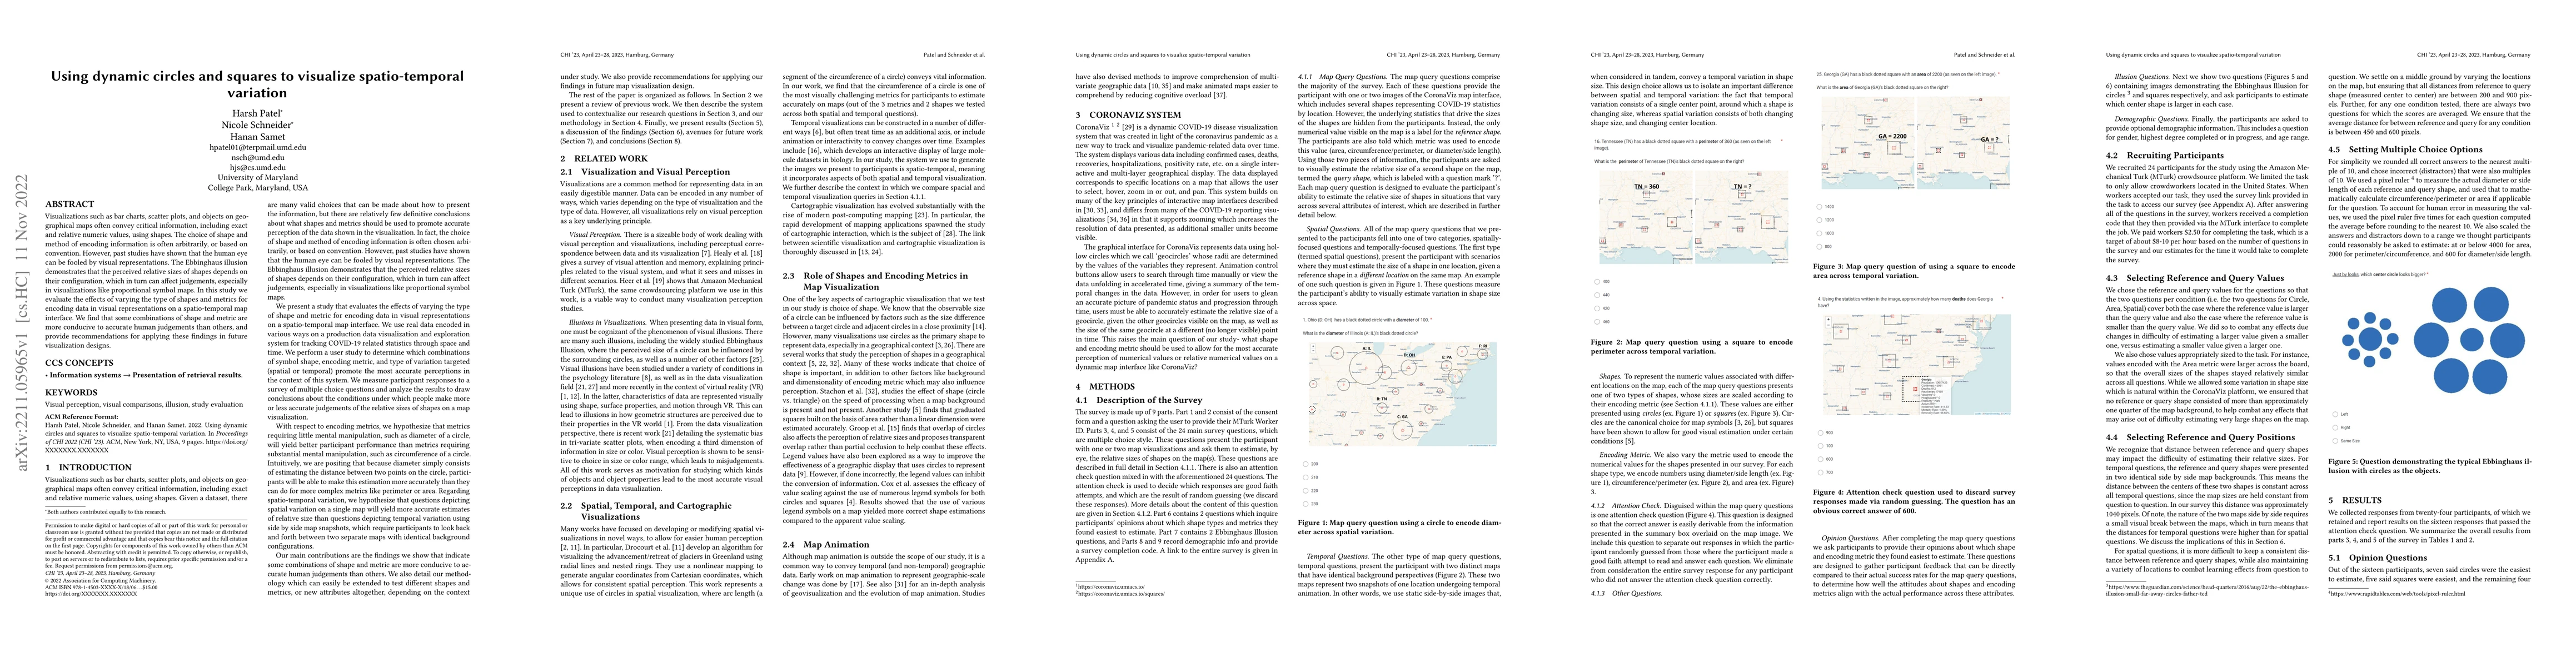
Visualizations such as bar charts, scatter plots, and objects on geographical maps often convey critical information, including exact and relative numeric values, using shapes. The choice of shape a...
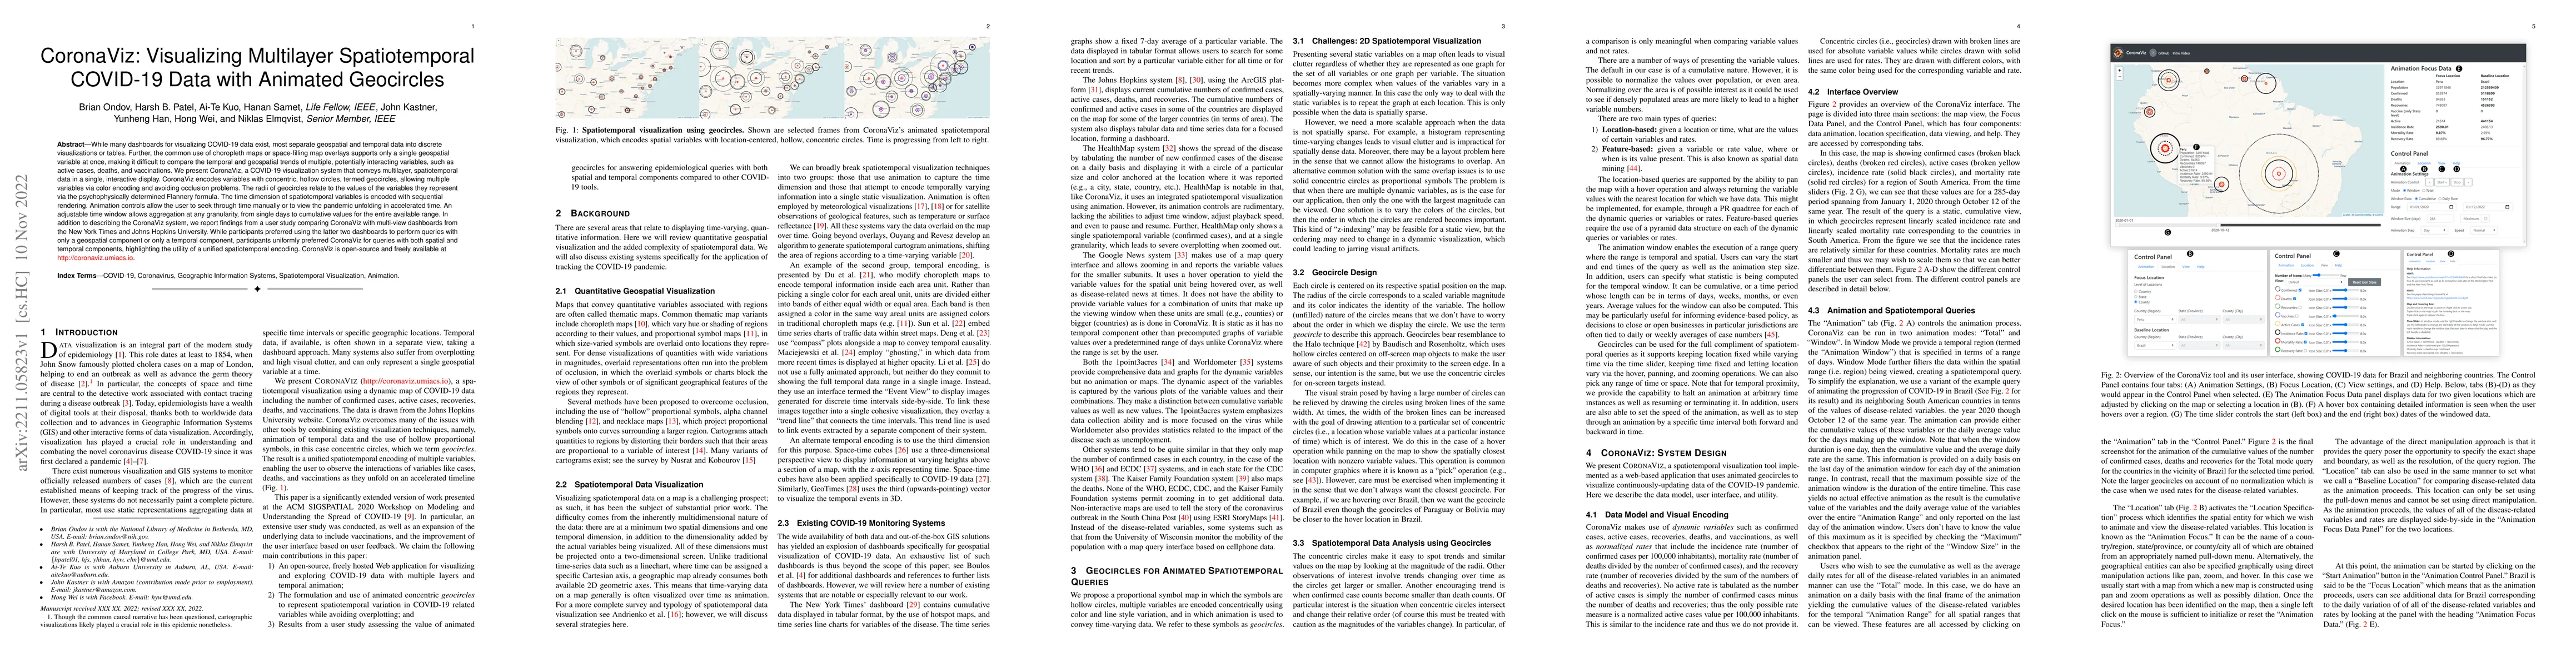
While many dashboards for visualizing COVID-19 data exist, most separate geospatial and temporal data into discrete visualizations or tables. Further, the common use of choropleth maps or space-fill...
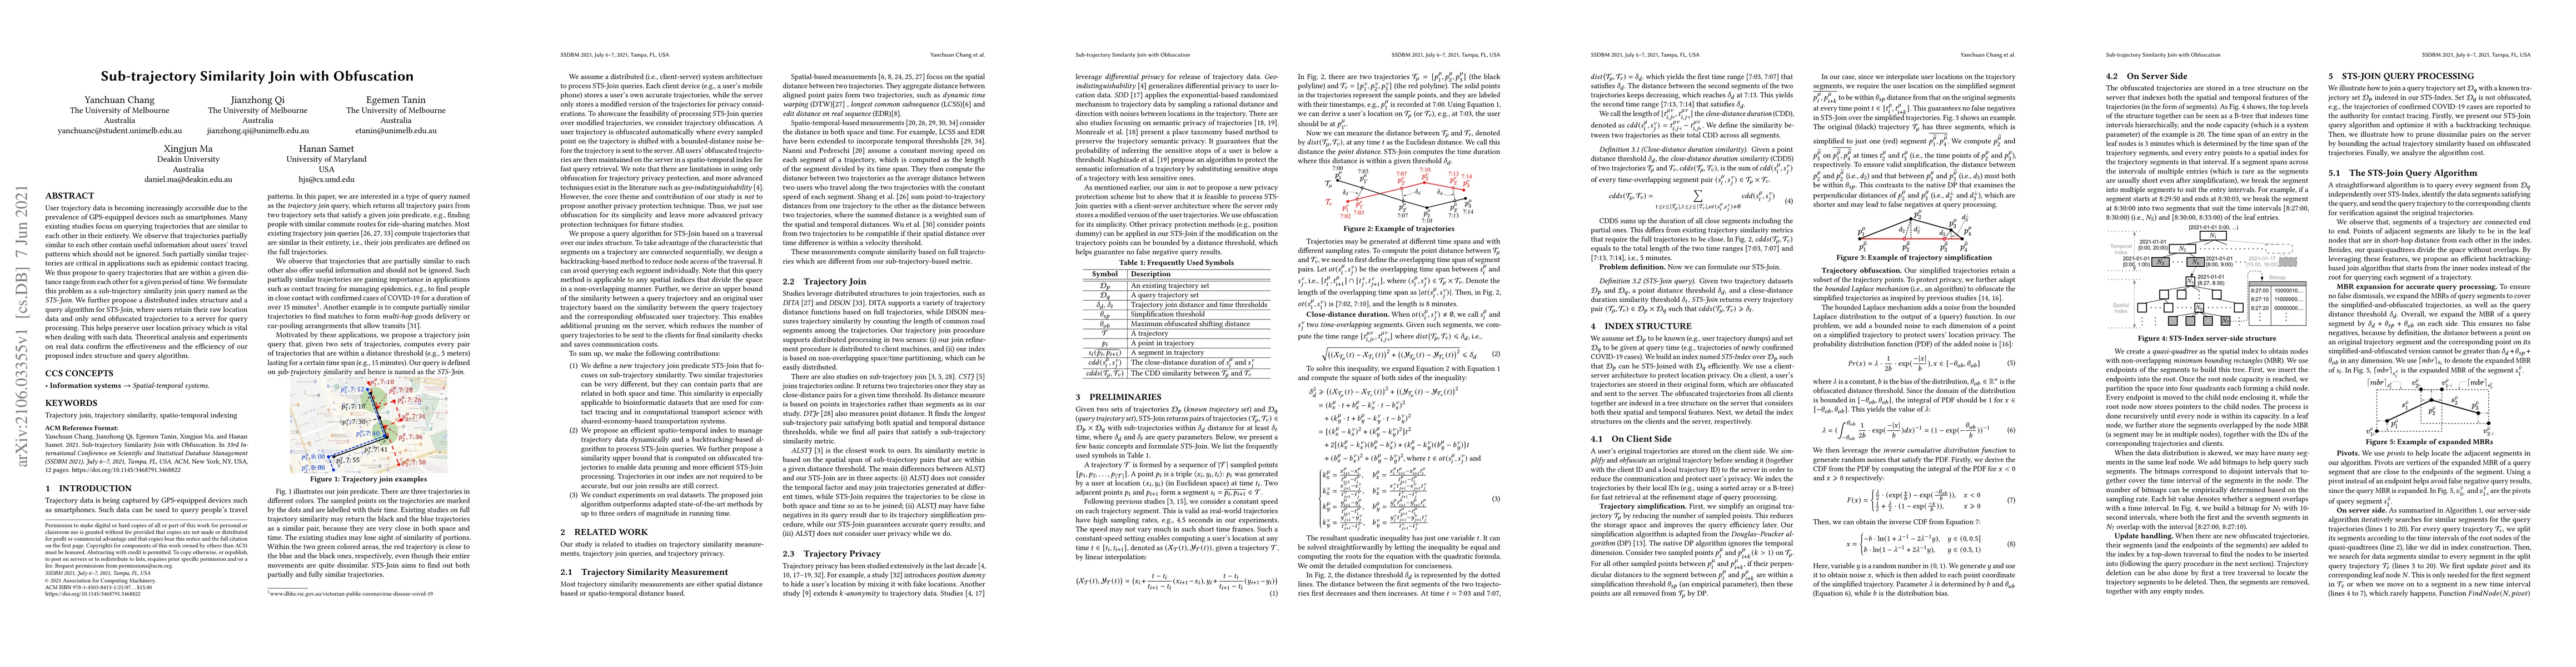
User trajectory data is becoming increasingly accessible due to the prevalence of GPS-equipped devices such as smartphones. Many existing studies focus on querying trajectories that are similar to e...
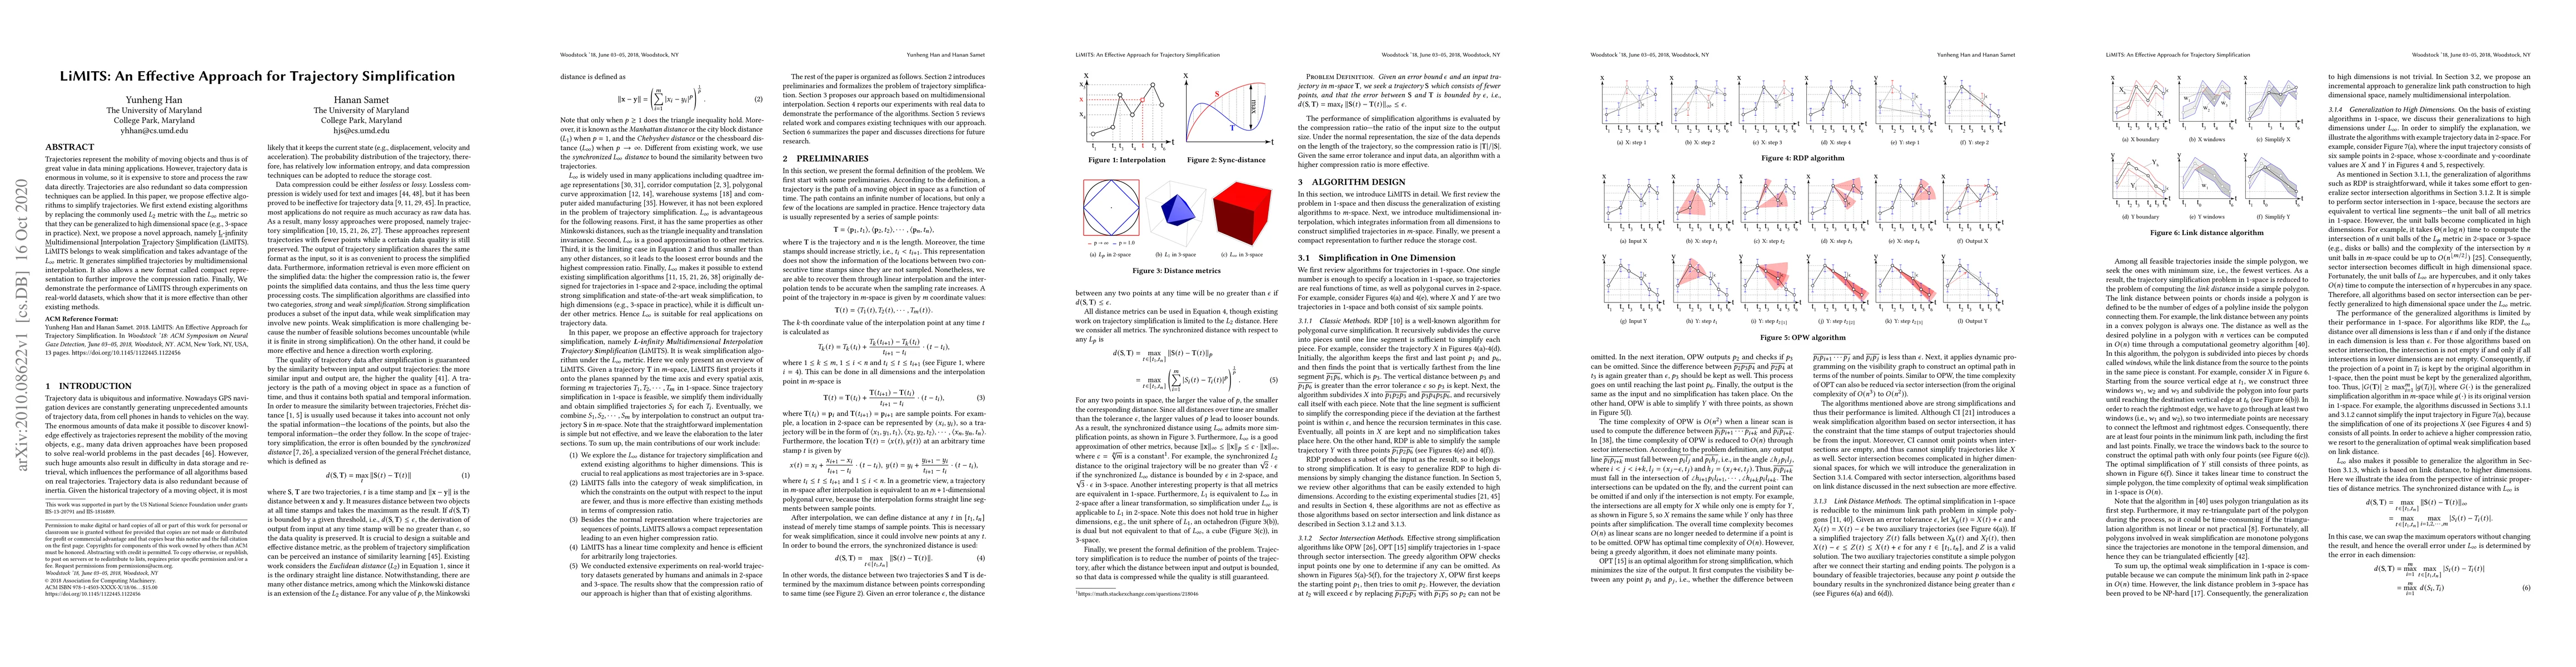
Trajectories represent the mobility of moving objects and thus is of great value in data mining applications. However, trajectory data is enormous in volume, so it is expensive to store and process ...
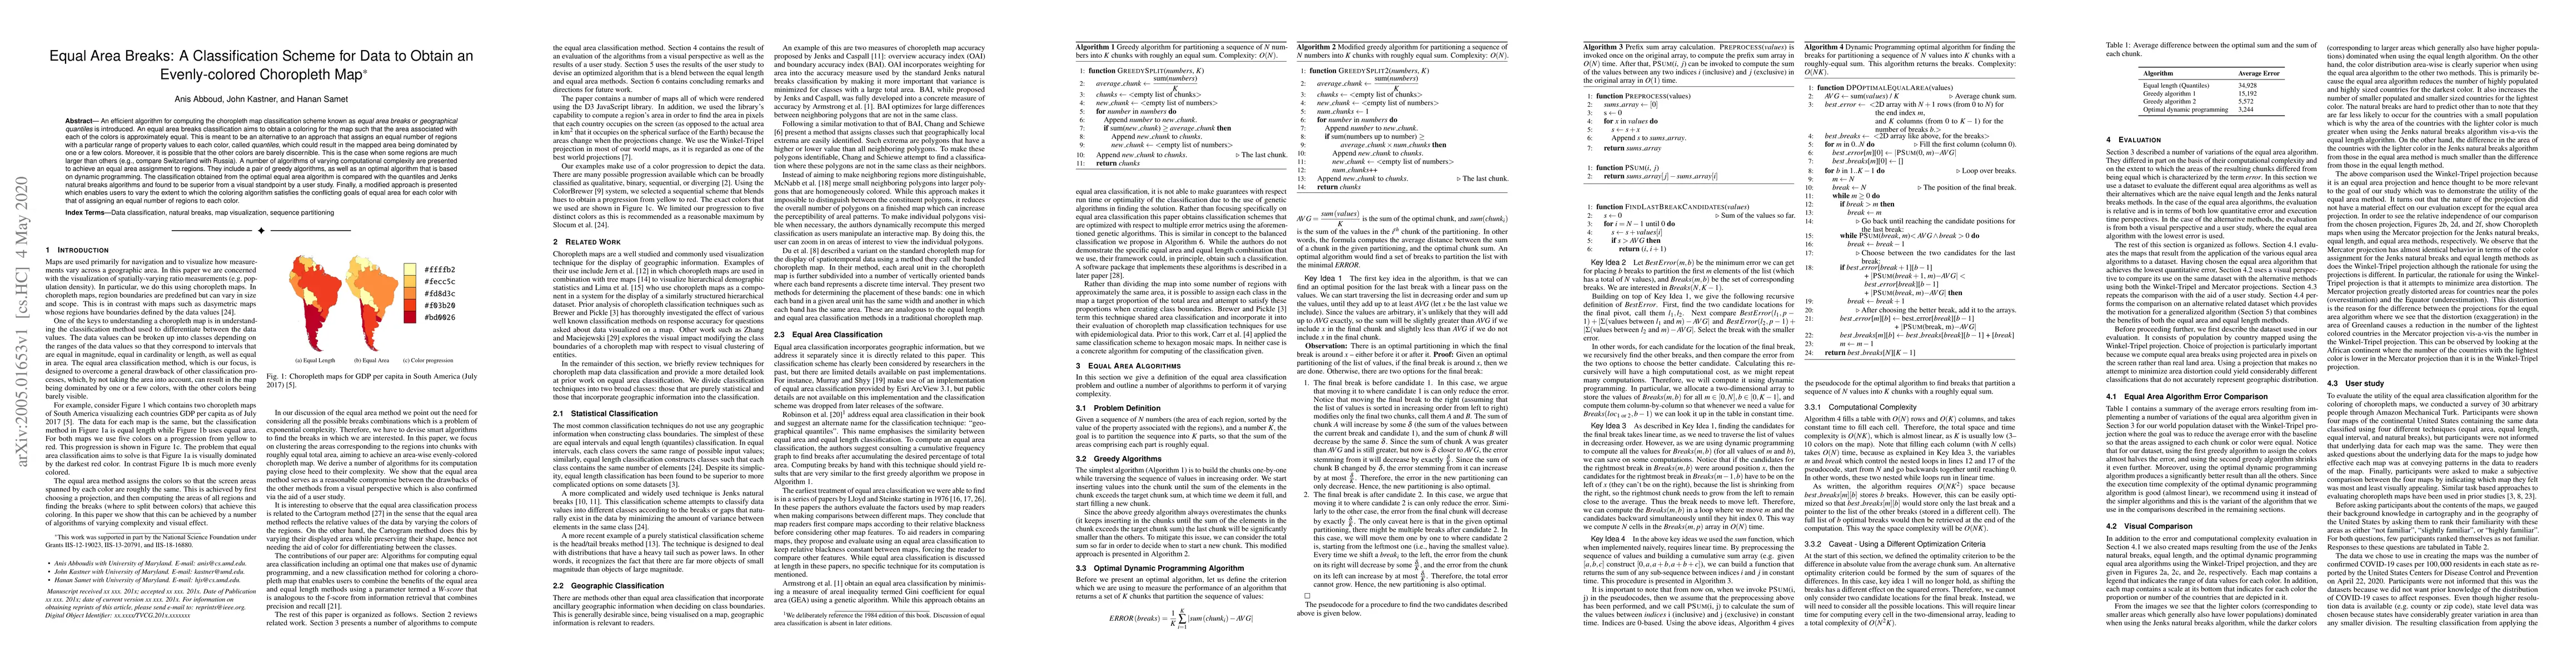
An efficient algorithm for computing the choropleth map classification scheme known as equal area breaks or geographical quantiles is introduced. An equal area breaks classification aims to obtain a...
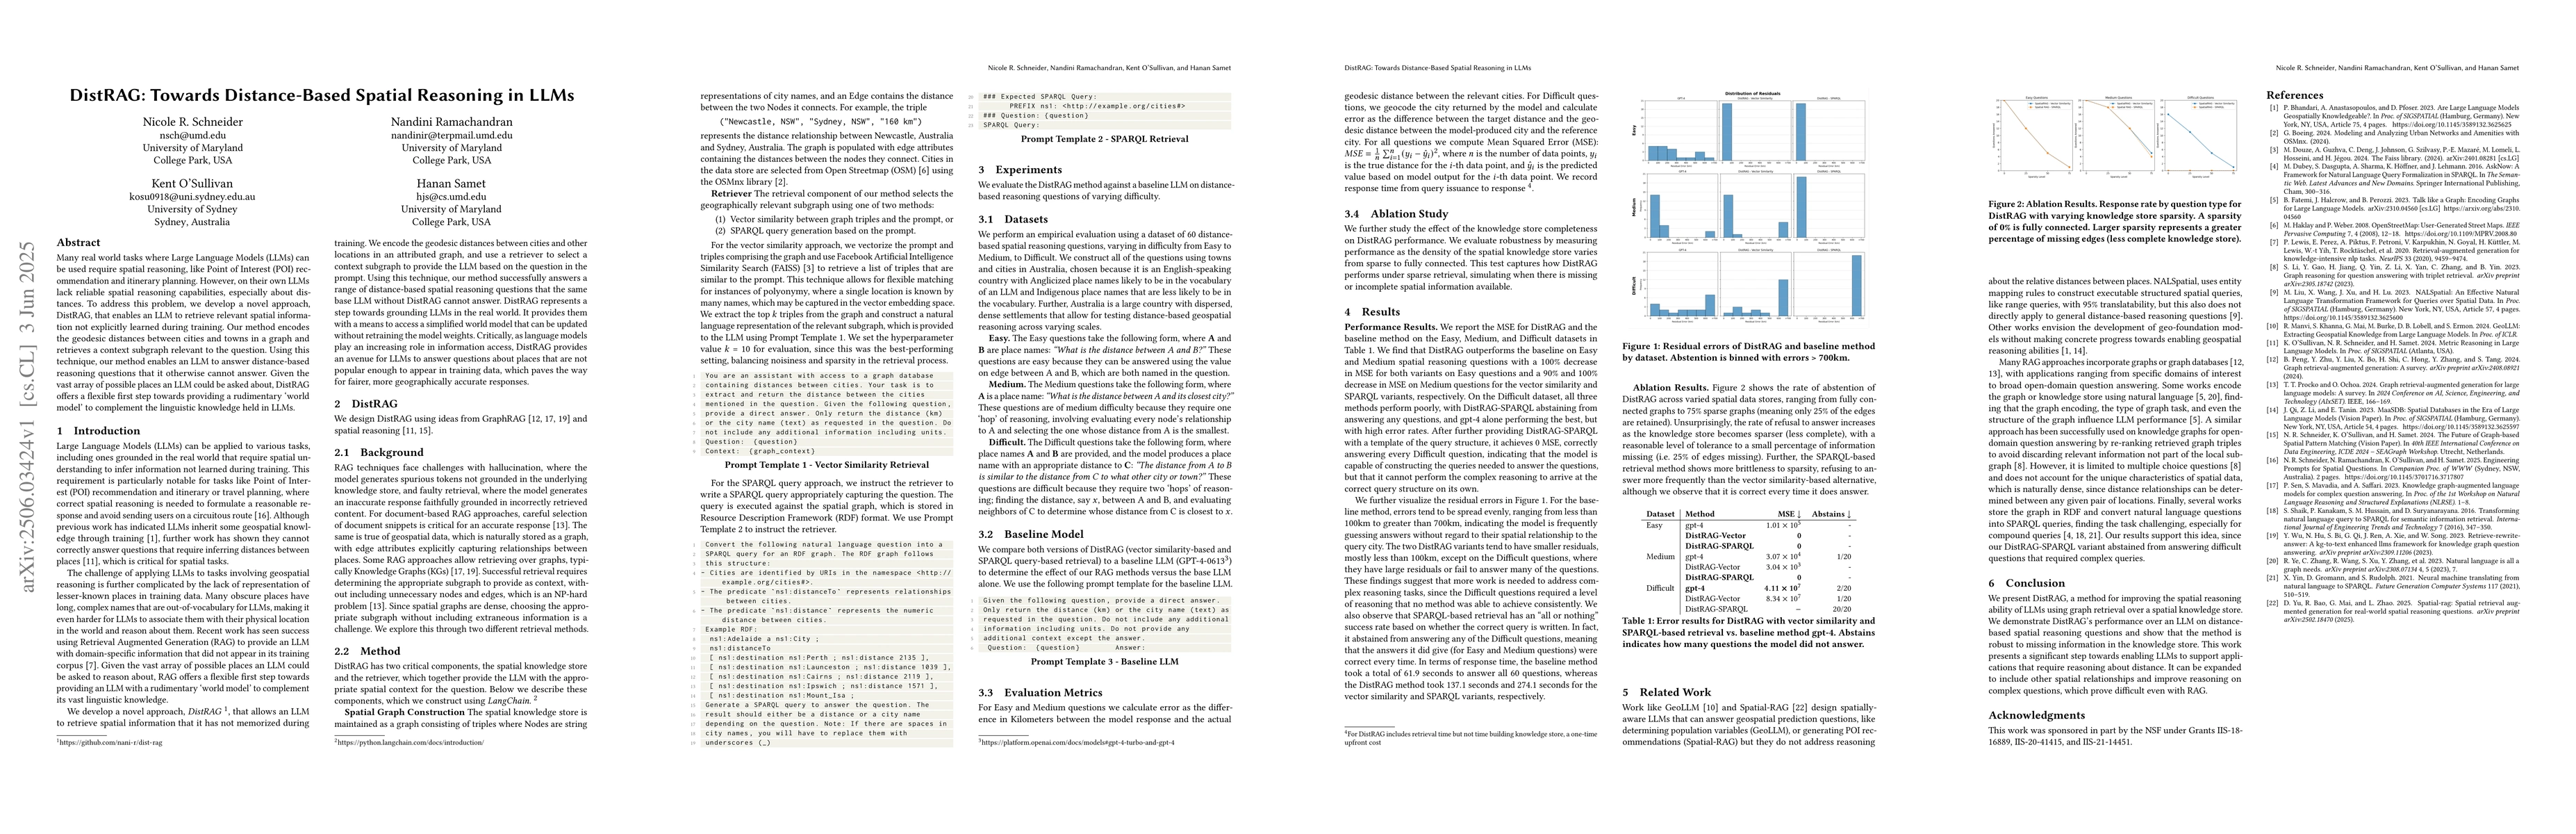
Many real world tasks where Large Language Models (LLMs) can be used require spatial reasoning, like Point of Interest (POI) recommendation and itinerary planning. However, on their own LLMs lack reli...
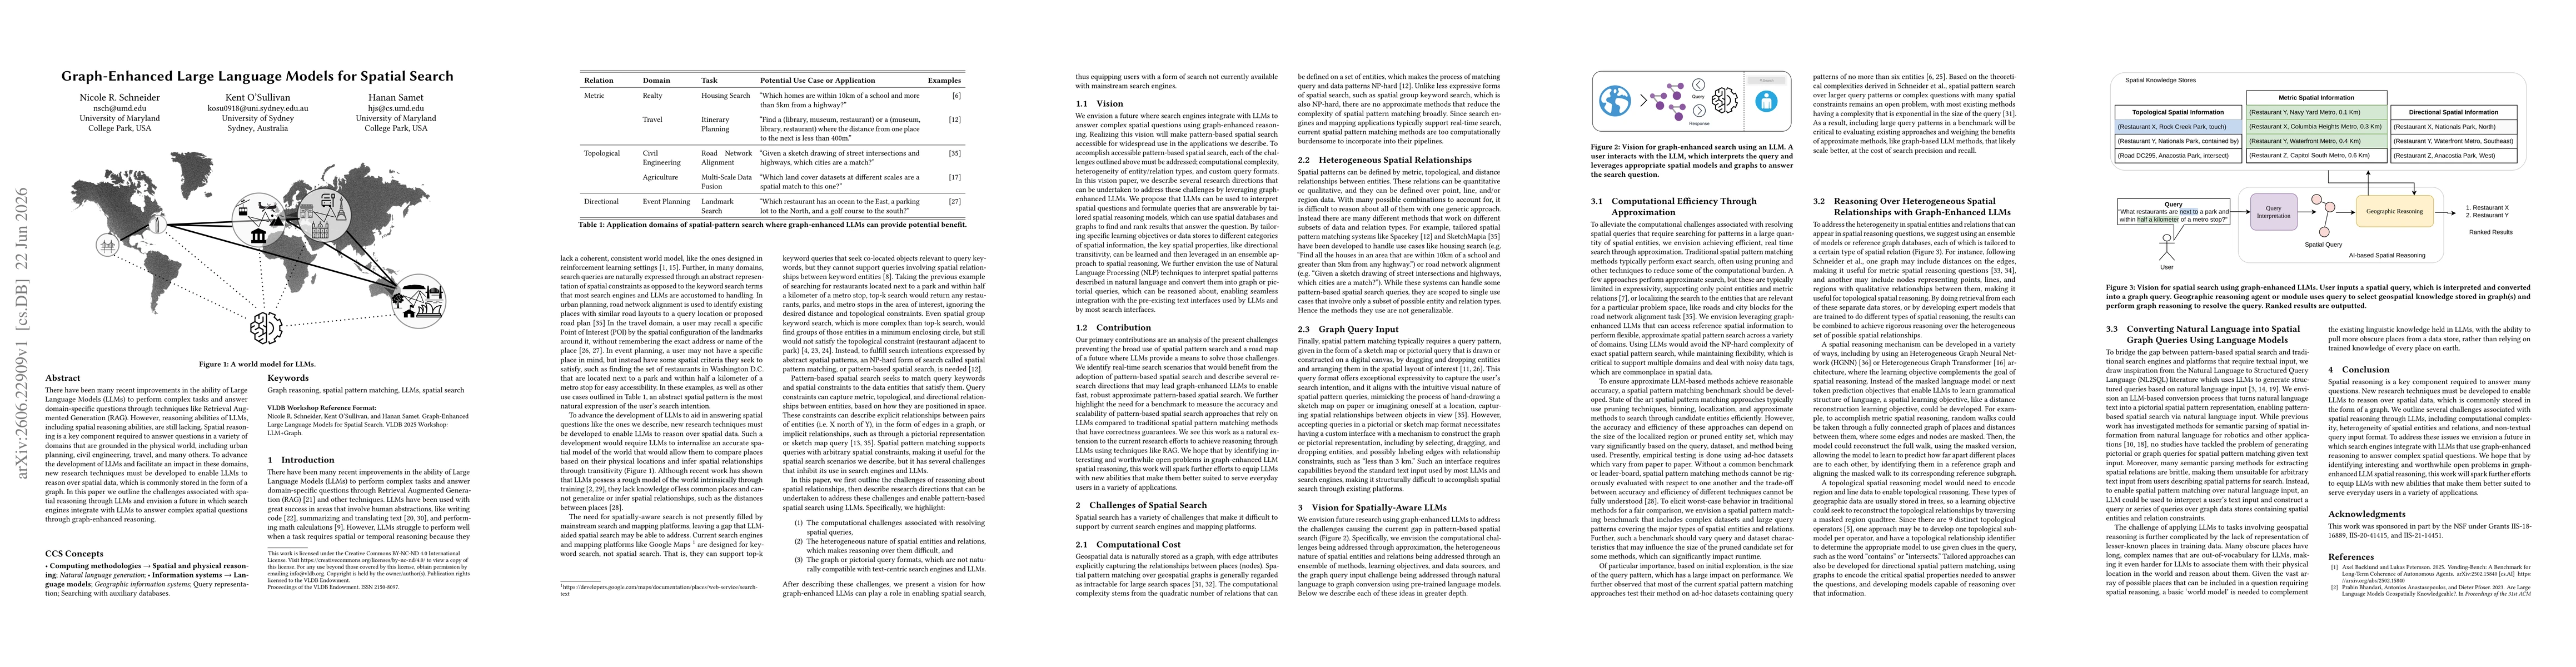
There have been many recent improvements in the ability of Large Language Models (LLMs) to perform complex tasks and answer domain-specific questions through techniques like Retrieval Augmented Genera...
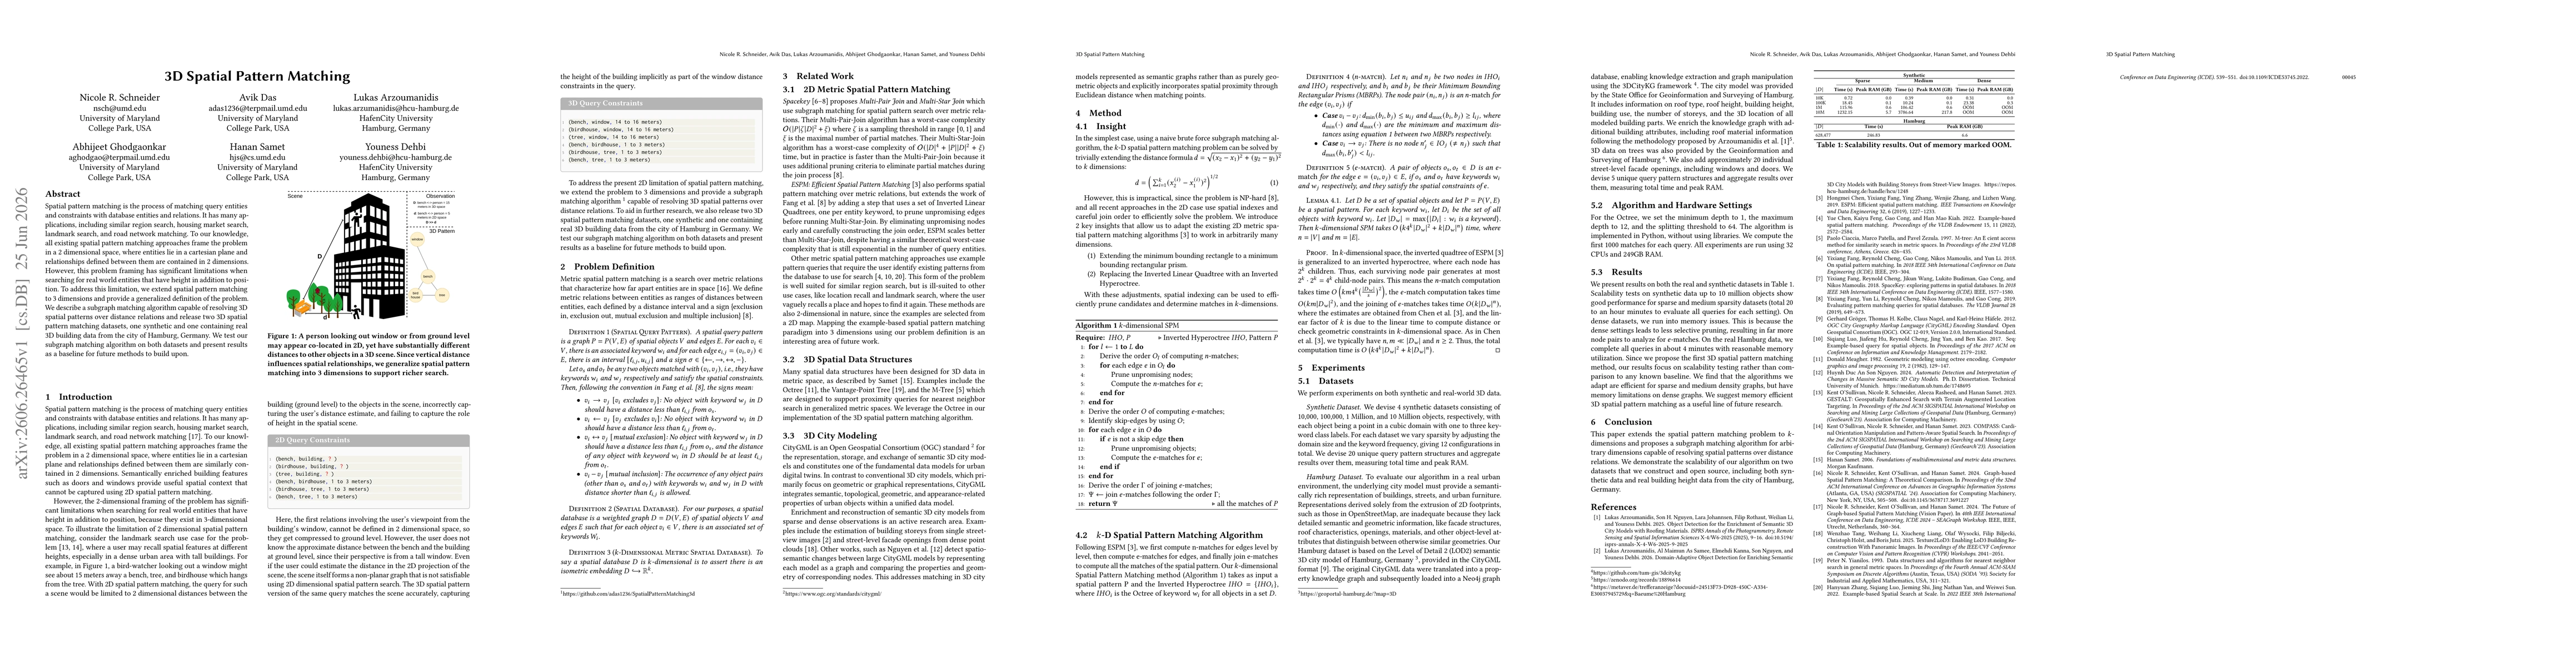
Spatial pattern matching is the process of matching query entities and constraints with database entities and relations. It has many applications, including similar region search, housing market searc...