CoronaViz: Visualizing Multilayer Spatiotemporal COVID-19 Data with Animated Geocircles
Publication
Metrics
AI Quick Summary
CoronaViz is an innovative visualization tool designed to present multilayer spatiotemporal COVID-19 data through animated geocircles. This system allows for the simultaneous comparison of multiple variables, such as active cases, deaths, and vaccinations, overcoming the limitations of traditional dashboards. It is freely available and can be explored for comprehensive insights into the pandemic's trends. For more details, visit the official website at http://coronaviz.umiacs.io.
Paper Preview
Abstract
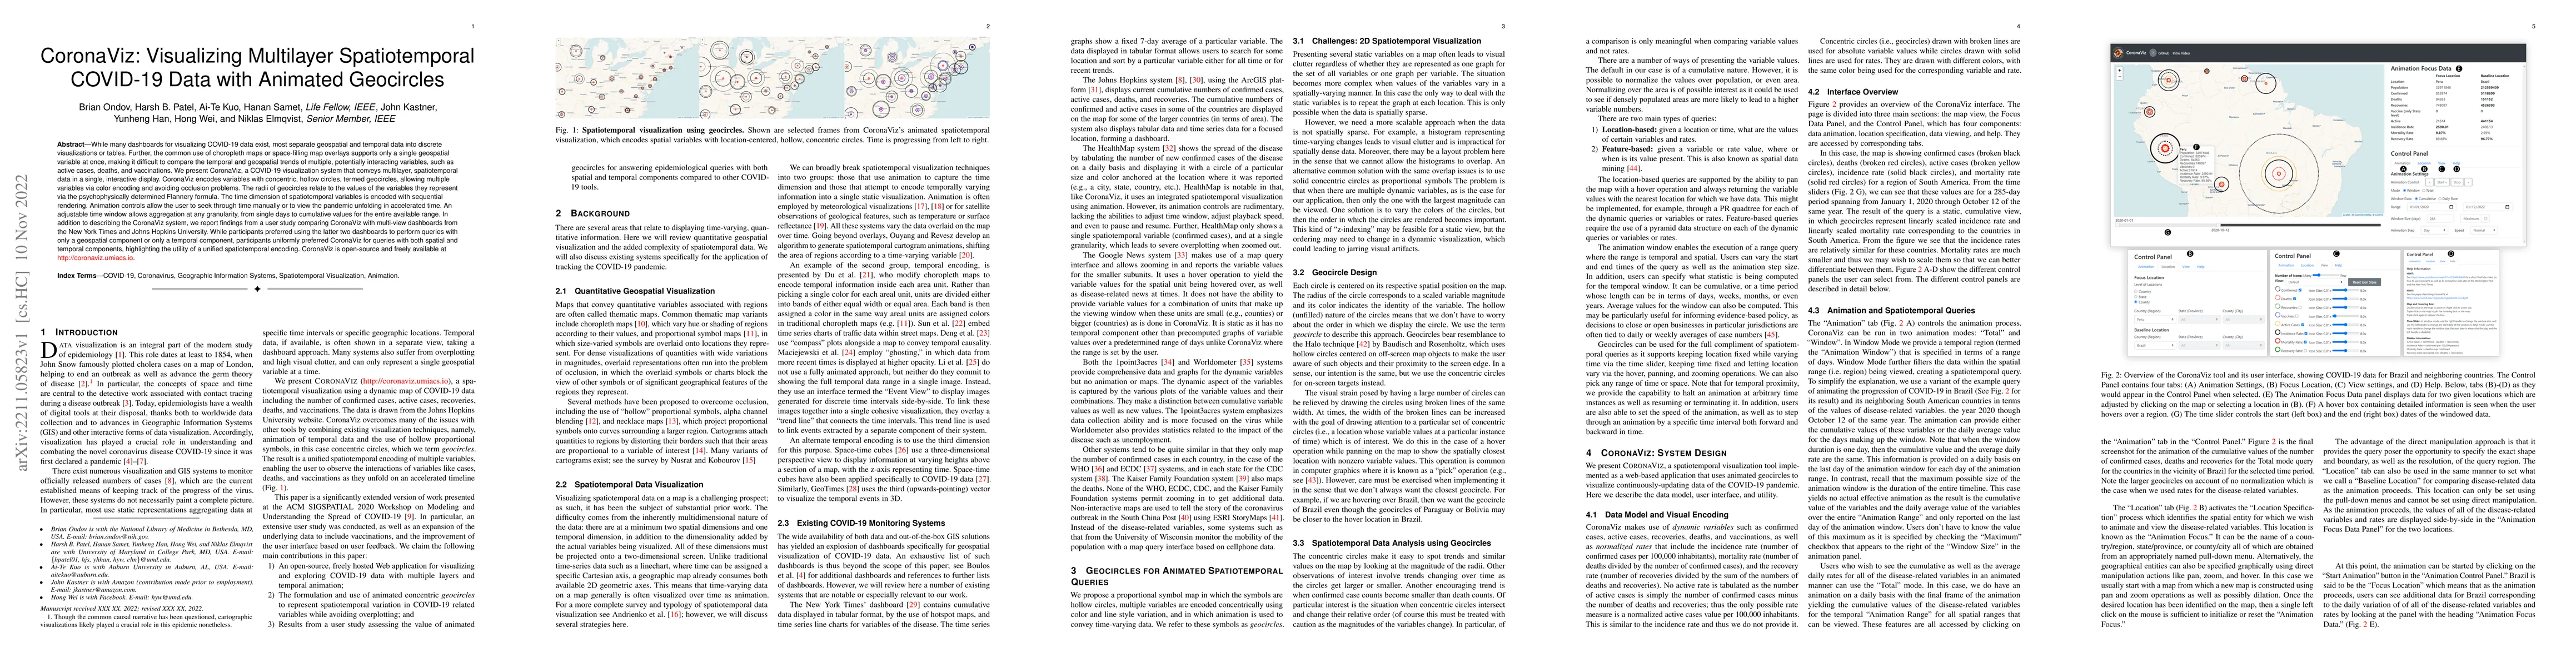
While many dashboards for visualizing COVID-19 data exist, most separate geospatial and temporal data into discrete visualizations or tables. Further, the common use of choropleth maps or space-filling map overlays supports only a single geospatial variable at once, making it difficult to compare the temporal and geospatial trends of multiple, potentially interacting variables, such as active cases, deaths, and vaccinations. We present CoronaViz, a COVID-19 visualization system that conveys multilayer, spatiotemporal data in a single, interactive display. CoronaViz encodes variables with concentric, hollow circles, termed geocircles, allowing multiple variables via color encoding and avoiding occlusion problems. The radii of geocircles relate to the values of the variables they represent via the psychophysically determined Flannery formula. The time dimension of spatiotemporal variables is encoded with sequential rendering. Animation controls allow the user to seek through time manually or to view the pandemic unfolding in accelerated time. An adjustable time window allows aggregation at any granularity, from single days to cumulative values for the entire available range. In addition to describing the CoronaViz system, we report findings from a user study comparing CoronaViz with multi-view dashboards from the New York Times and Johns Hopkins University. While participants preferred using the latter two dashboards to perform queries with only a geospatial component or only a temporal component, participants uniformly preferred CoronaViz for queries with both spatial and temporal components, highlighting the utility of a unified spatiotemporal encoding. CoronaViz is open-source and freely available at http://coronaviz.umiacs.io.
AI Key Findings
Get AI-generated insights about this paper's methodology, results, significance, and more — seven facets brought into focus.
Impact
Paper Details
Authors
PDF Preview
Key Terms
Citation Network
Current paper (gray), citations (green), references (blue)
Display is limited for performance on very large graphs.
Discussion 0