Academic Profile
Statistics
Similar Authors
Papers on arXiv
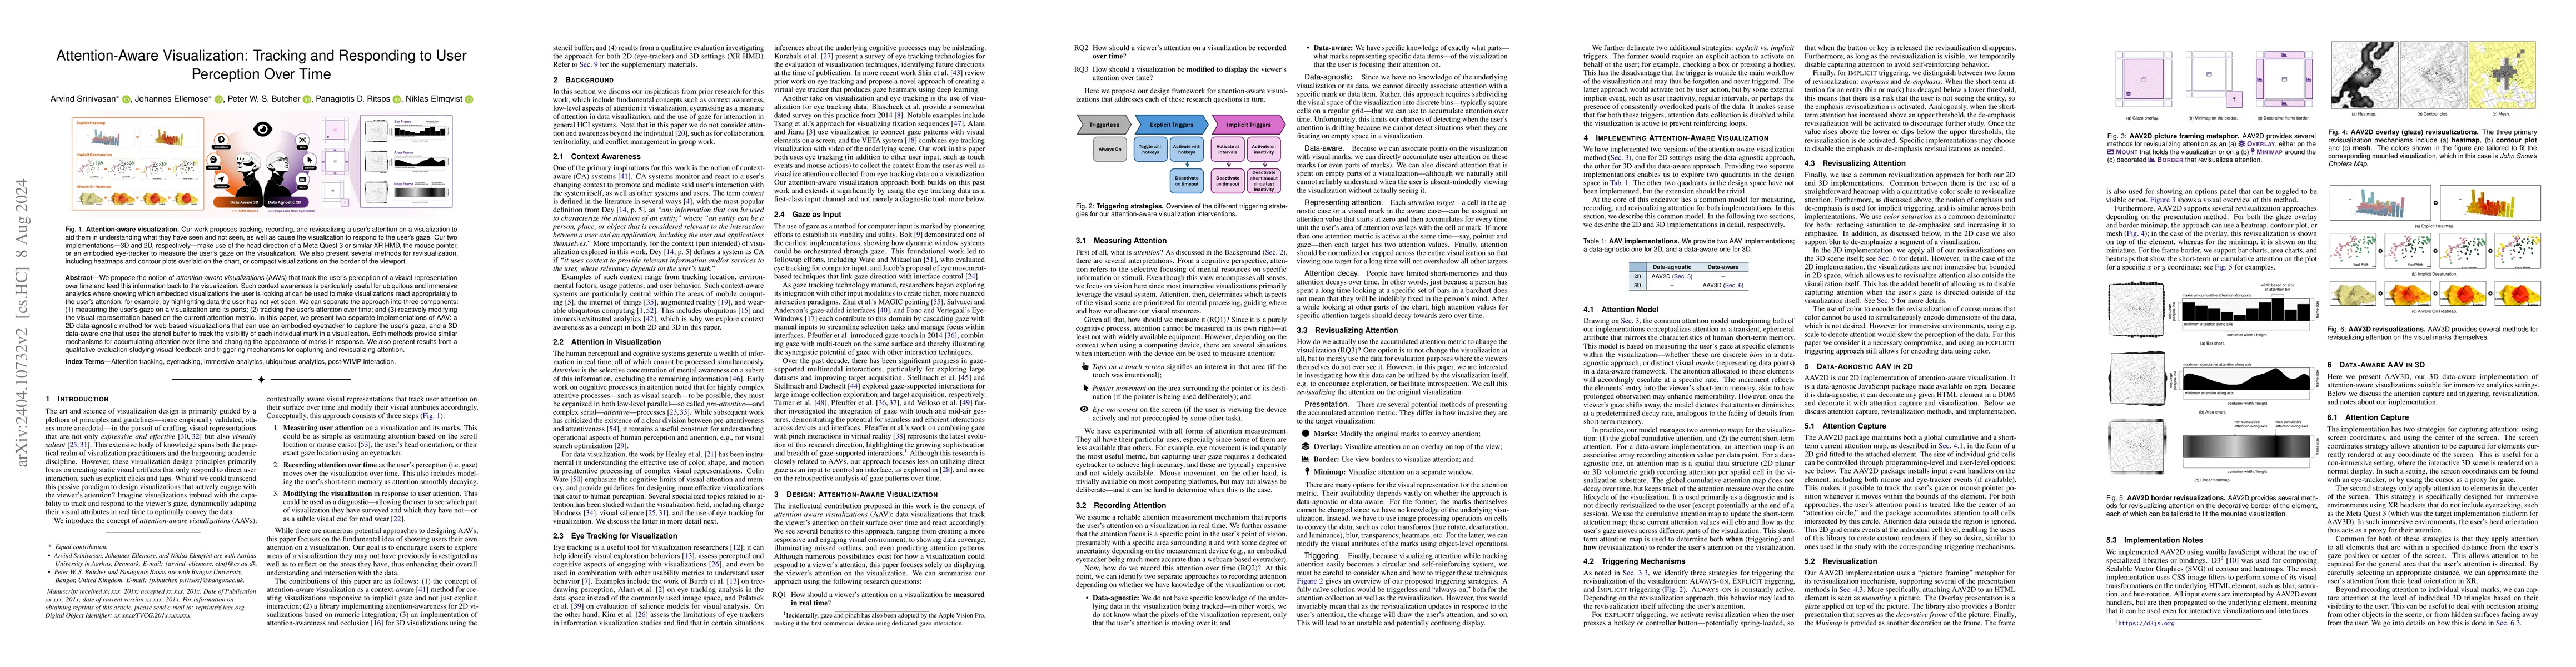
We propose the notion of Attention-Aware Visualizations (AAVs) that track the user's perception of a visual representation over time and feed this information back to the visualization. Such context...
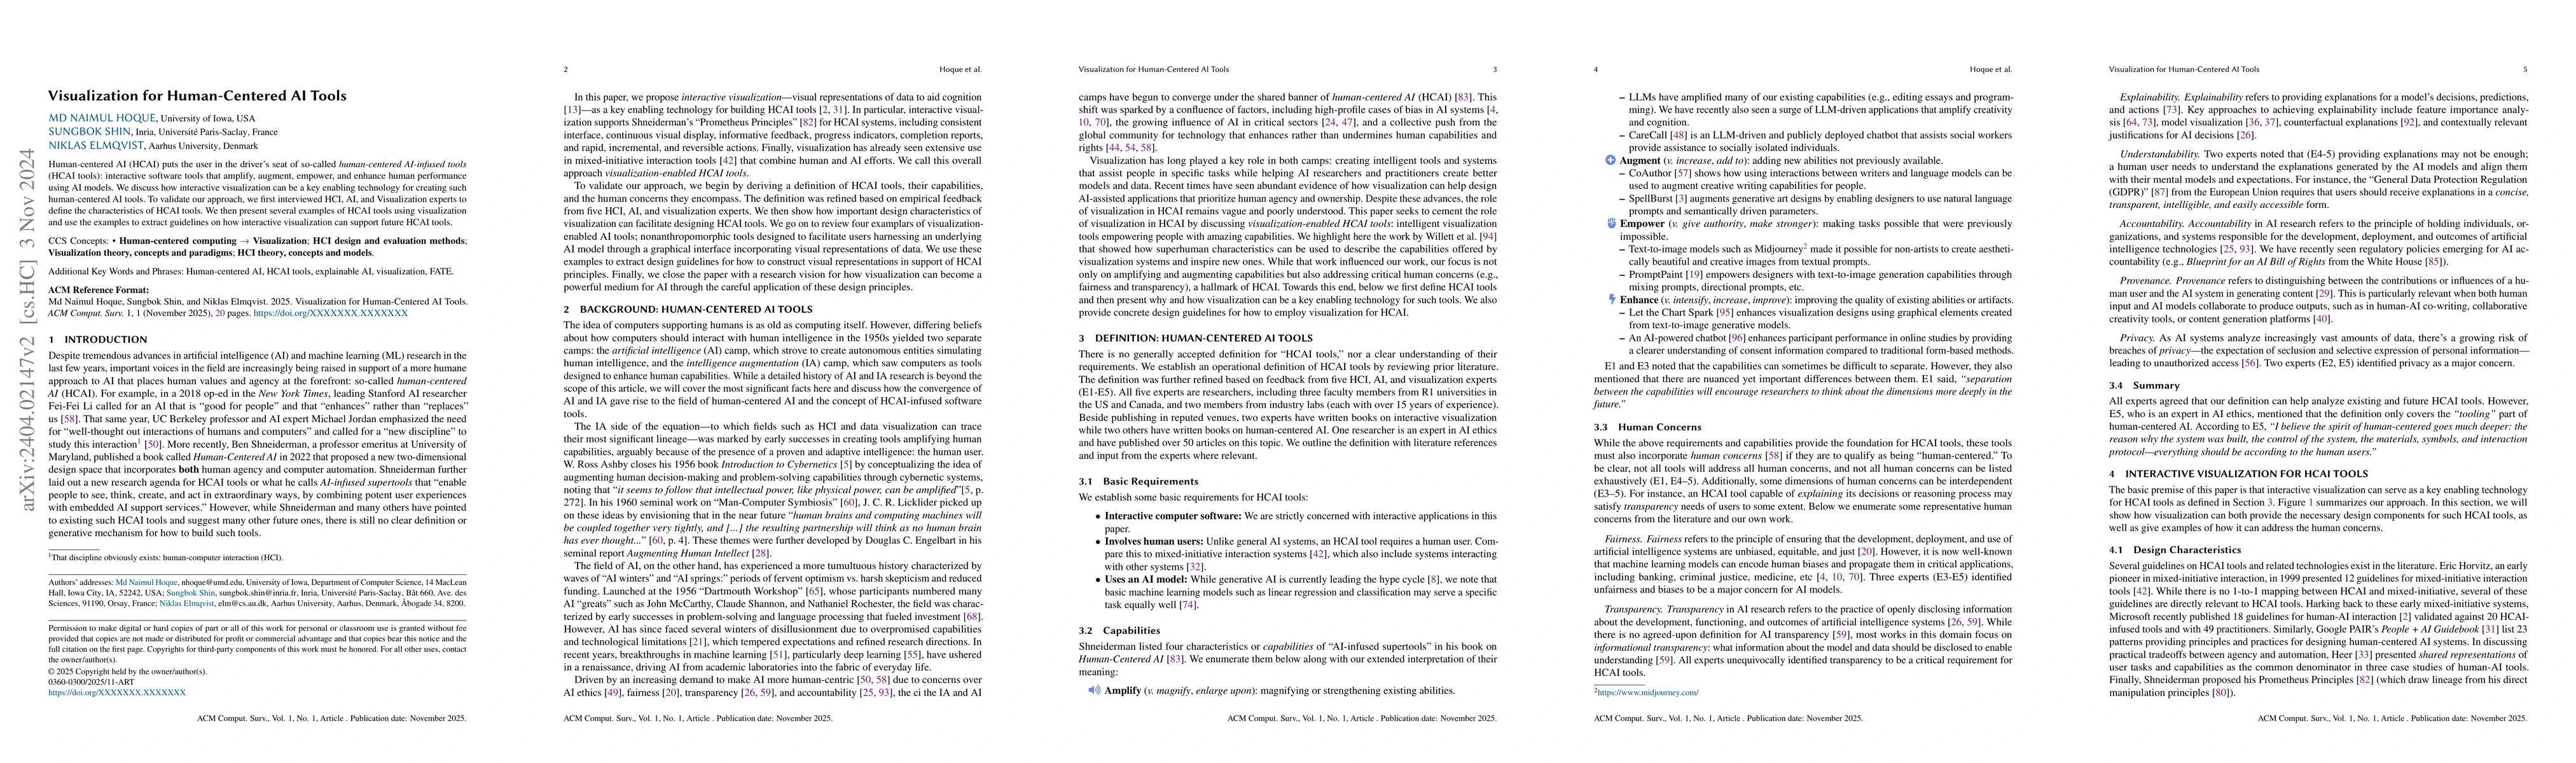
Human-centered AI (HCAI), rather than replacing the human, puts the human user in the driver's seat of so-called human-centered AI-infused tools (HCAI tools): interactive software tools that amplify...
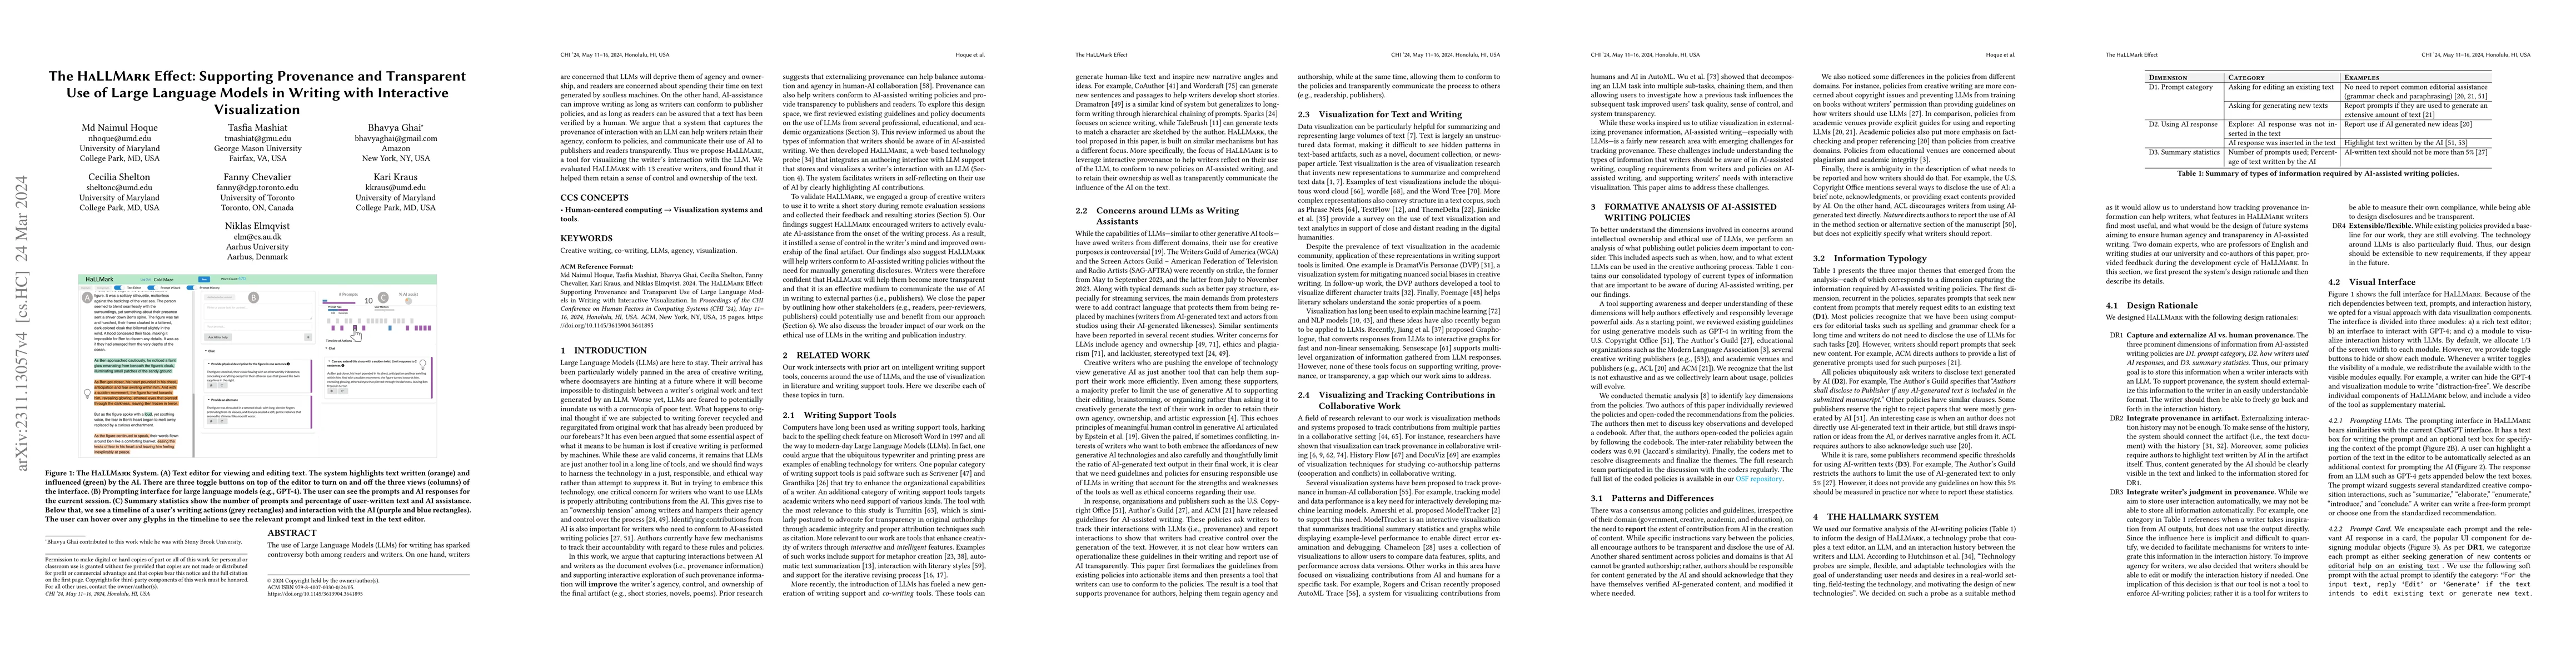
The use of Large Language Models (LLMs) for writing has sparked controversy both among readers and writers. On one hand, writers are concerned that LLMs will deprive them of agency and ownership, an...
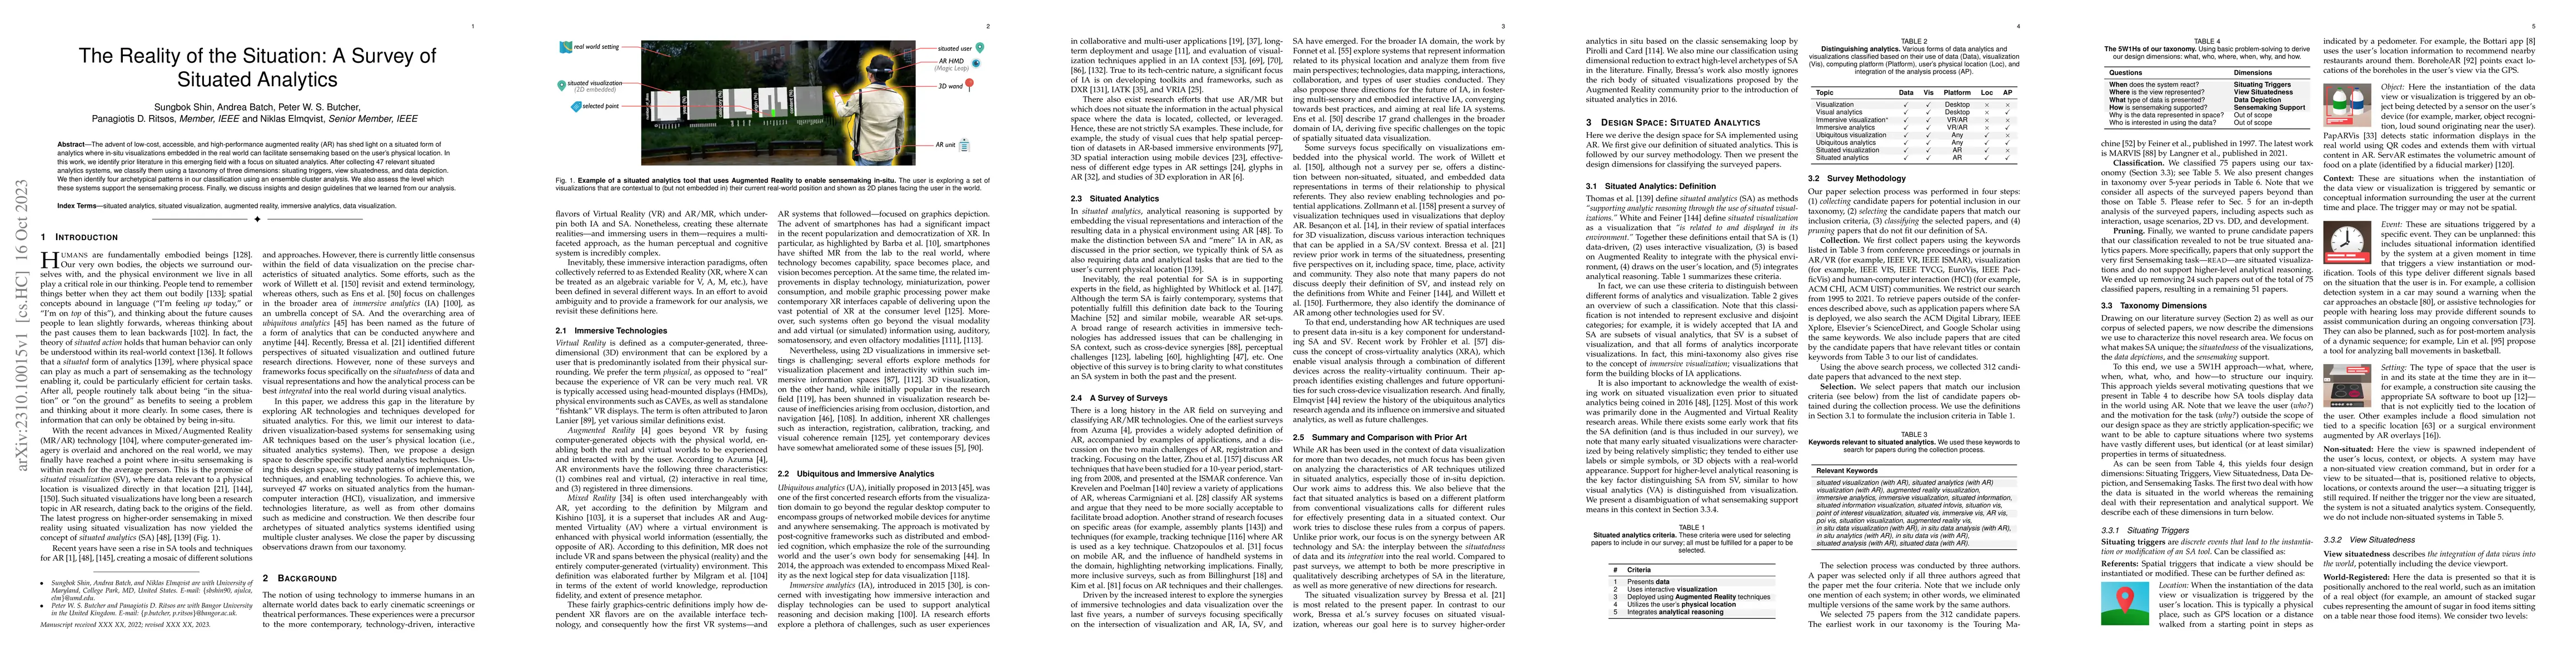
The advent of low cost, accessible, and high performance augmented reality (AR) has shed light on a situated form of analytics where in-situ visualizations embedded in the real world can facilitate ...
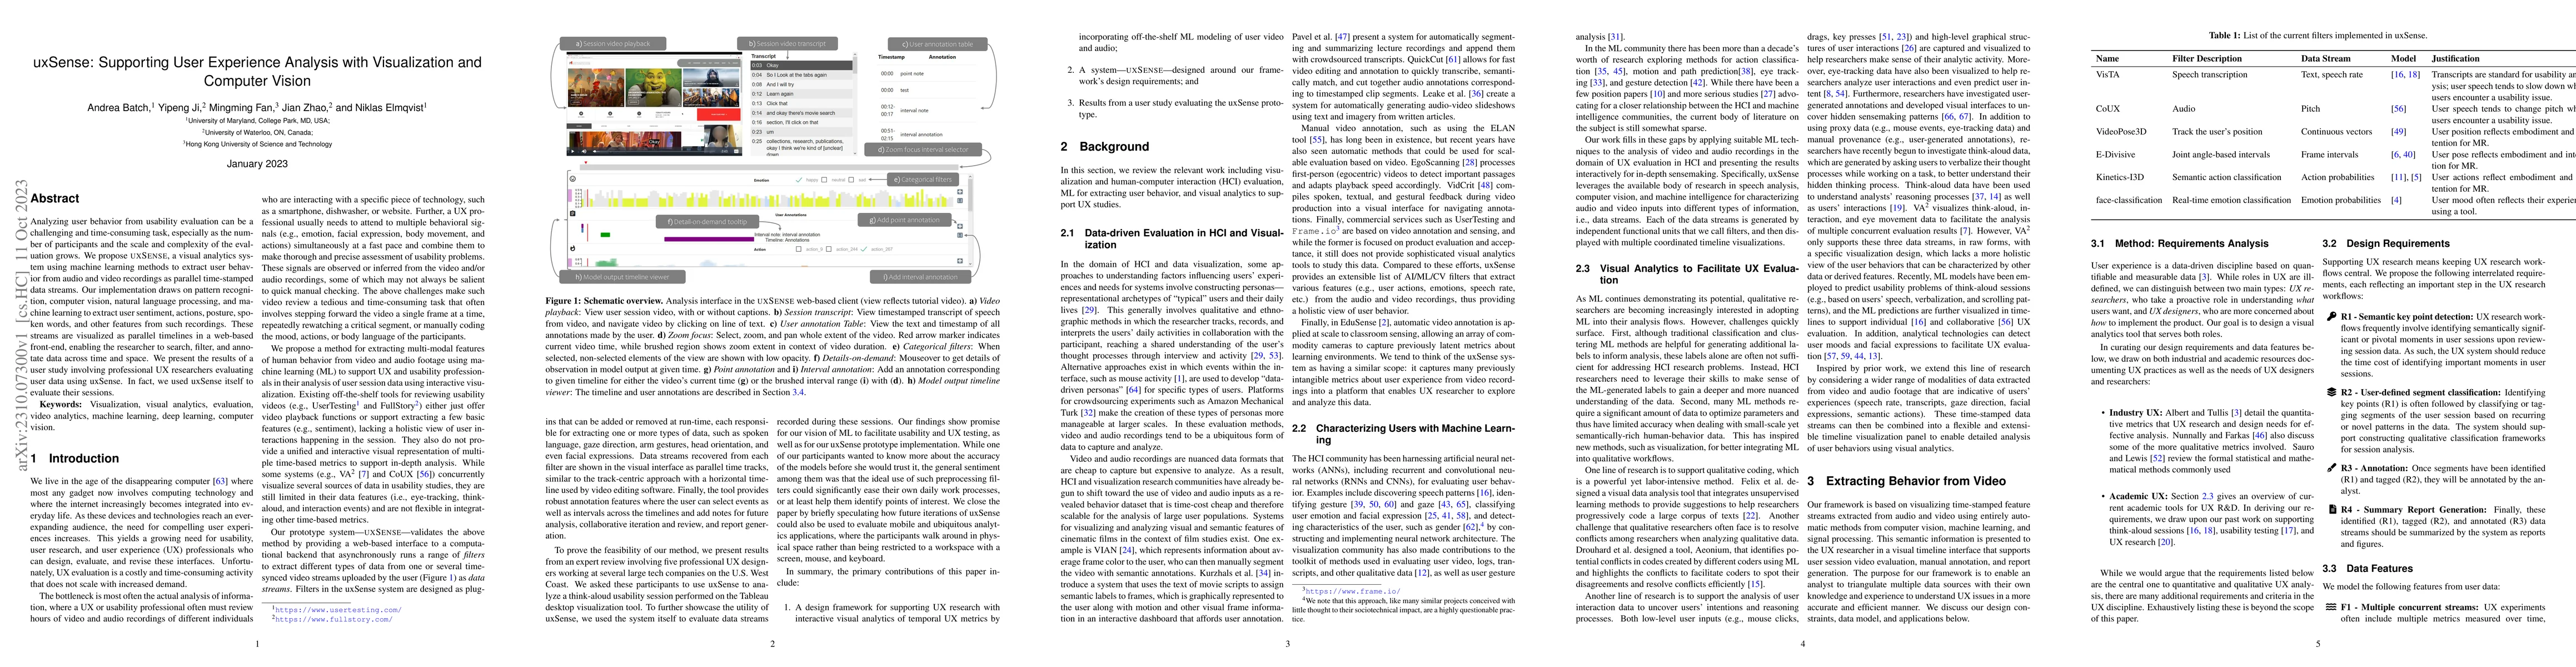
Analyzing user behavior from usability evaluation can be a challenging and time-consuming task, especially as the number of participants and the scale and complexity of the evaluation grows. We prop...
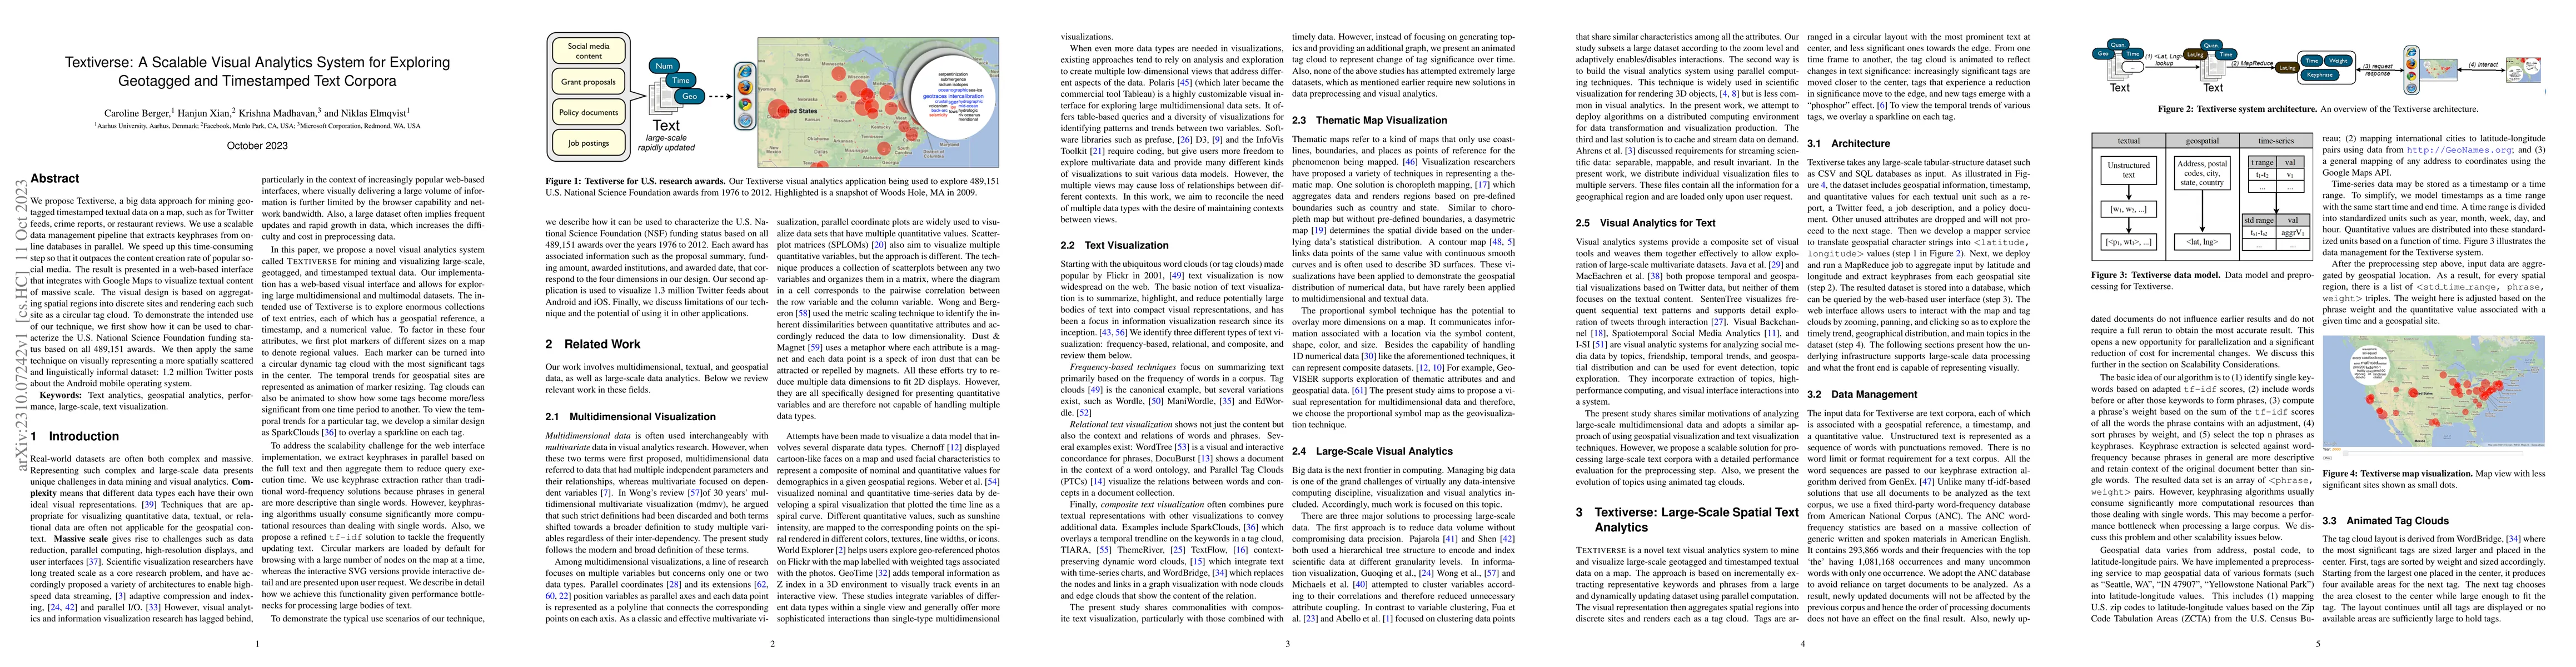
We propose Textiverse, a big data approach for mining geotagged timestamped textual data on a map, such as for Twitter feeds, crime reports, or restaurant reviews. We use a scalable data management ...
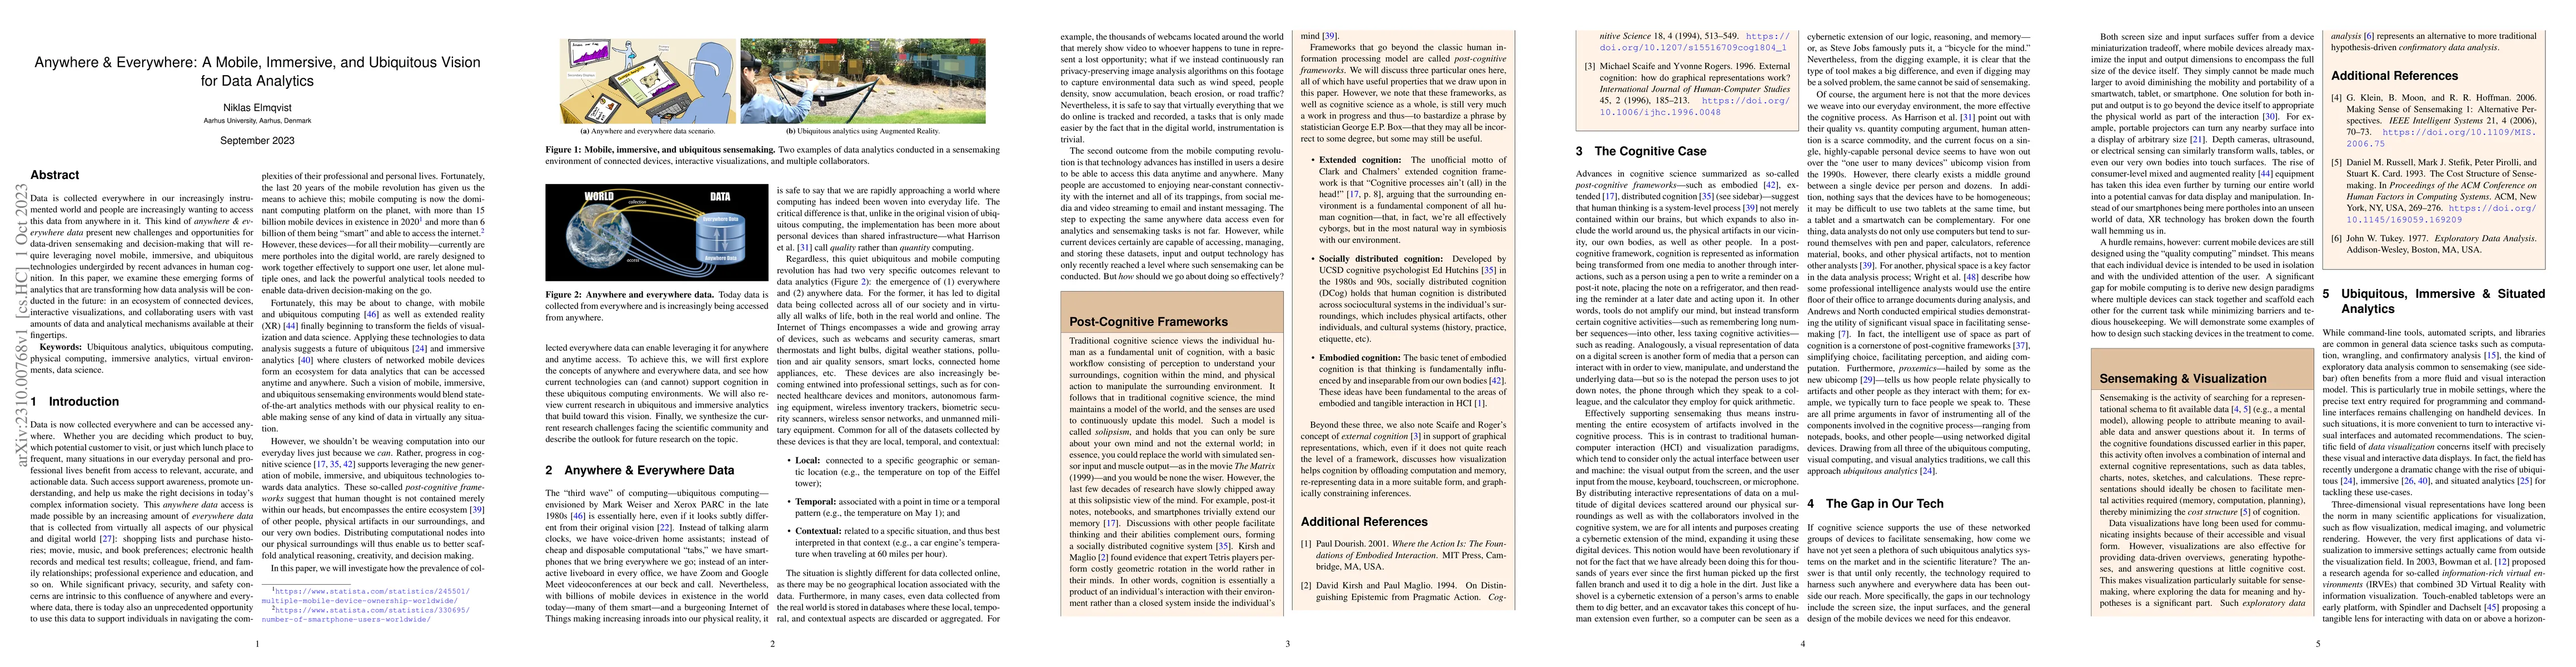
Data is collected everywhere in our increasingly instrumented world and people are increasingly wanting to access this data from anywhere in it. This kind of anywhere & everywhere data present new c...
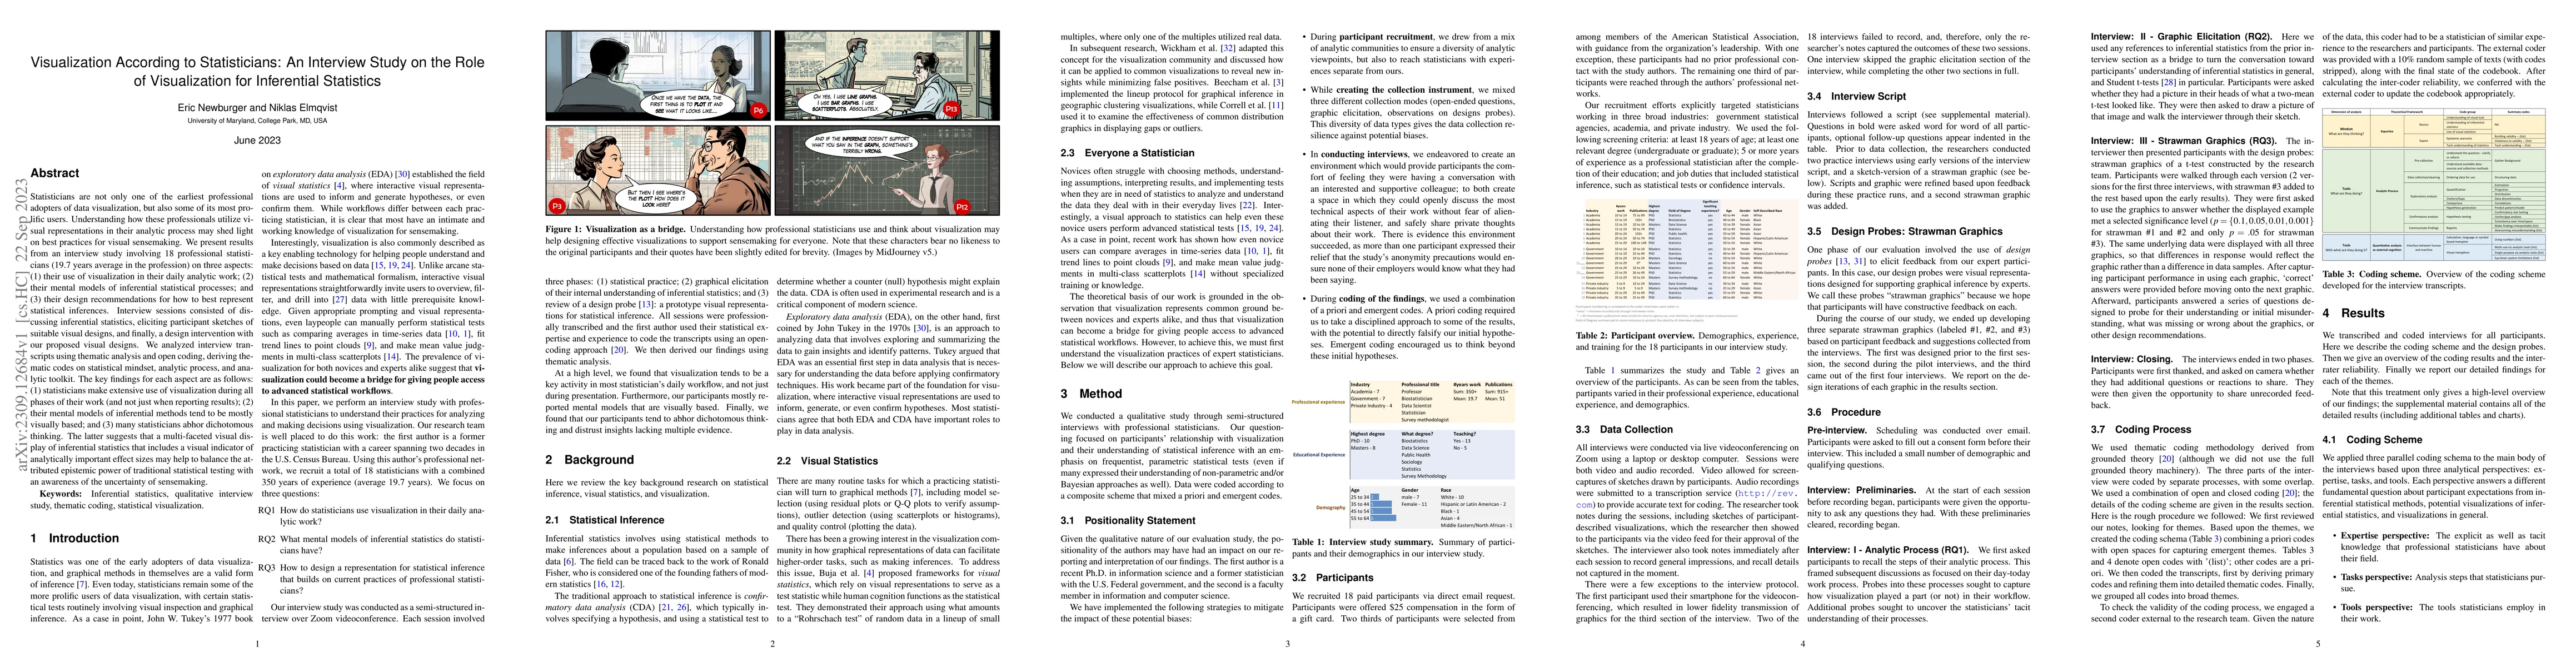
Statisticians are not only one of the earliest professional adopters of data visualization, but also some of its most prolific users. Understanding how these professionals utilize visual representat...
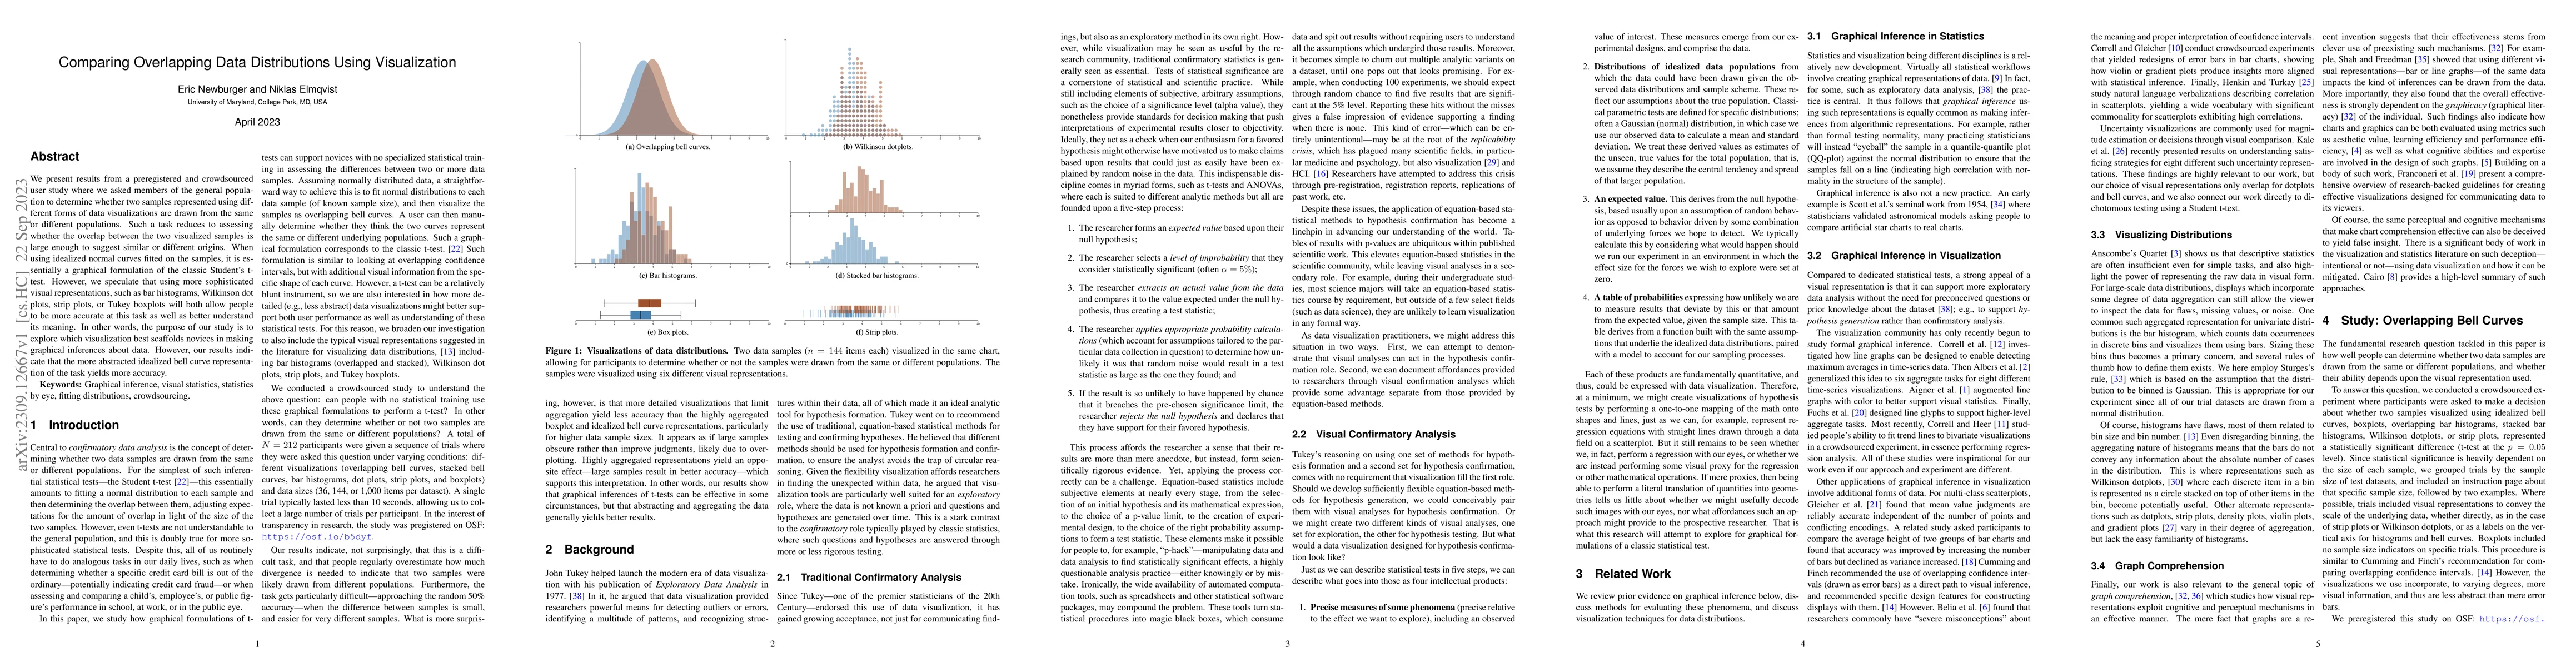
We present results from a preregistered and crowdsourced user study where we asked members of the general population to determine whether two samples represented using different forms of data visual...
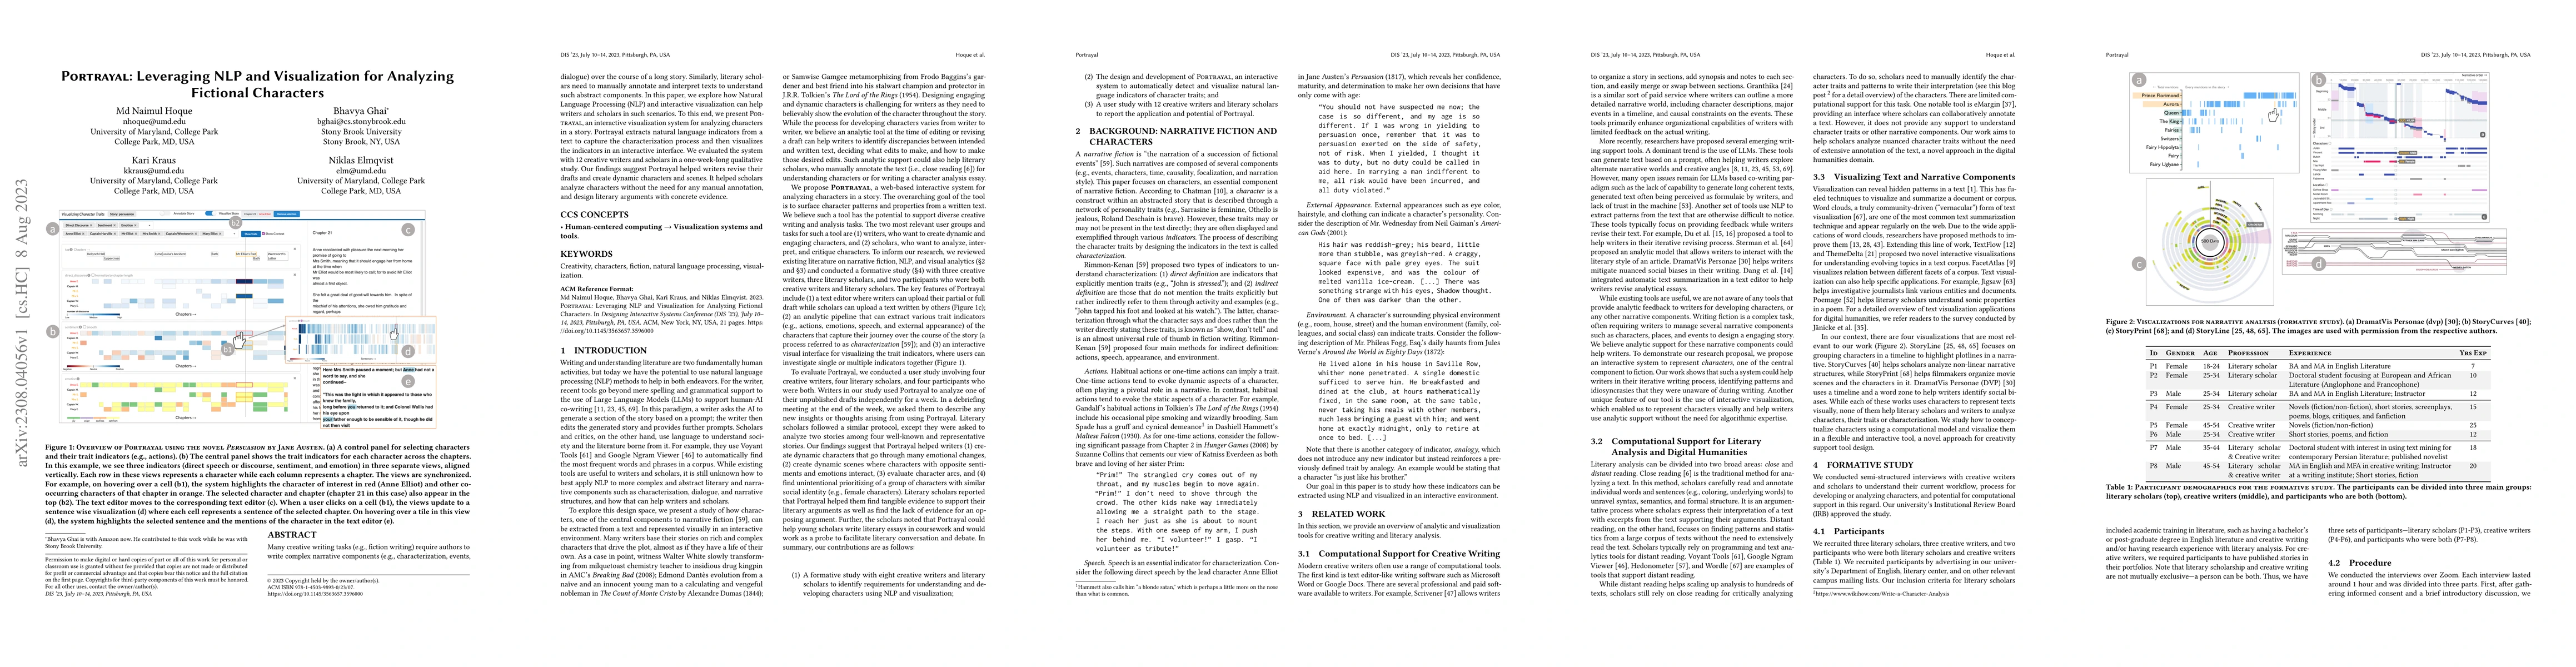
Many creative writing tasks (e.g., fiction writing) require authors to write complex narrative components (e.g., characterization, events, dialogue) over the course of a long story. Similarly, liter...
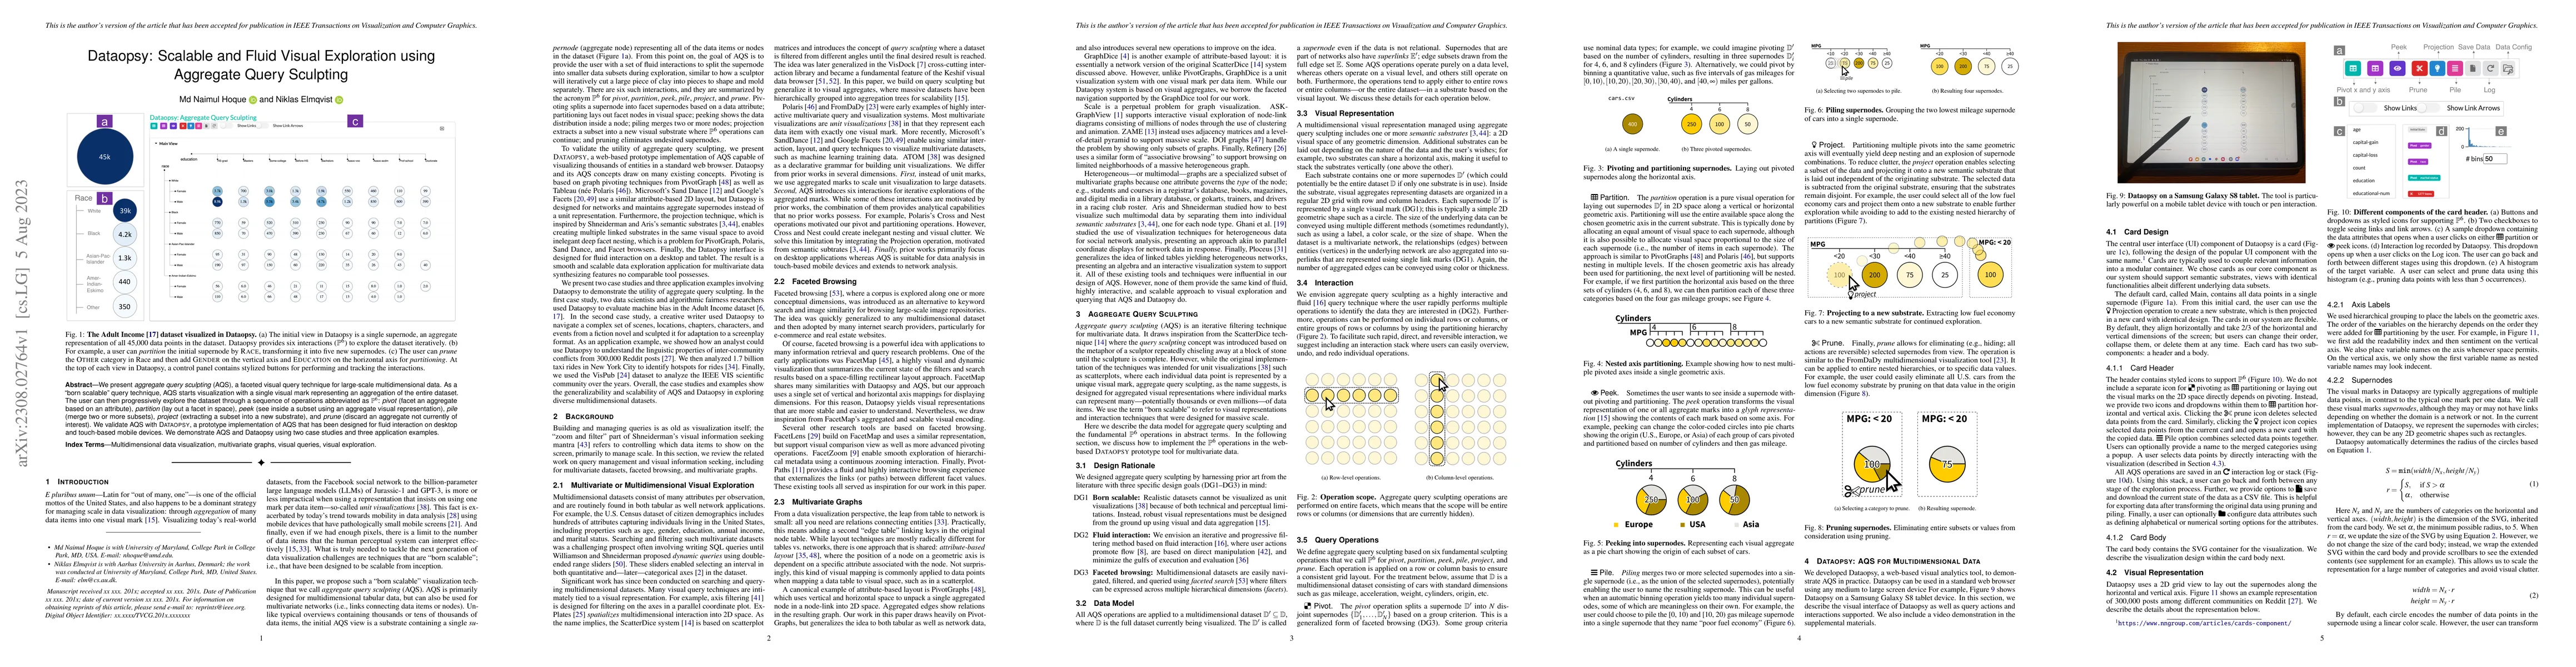
We present aggregate query sculpting (AQS), a faceted visual query technique for large-scale multidimensional data. As a "born scalable" query technique, AQS starts visualization with a single visua...
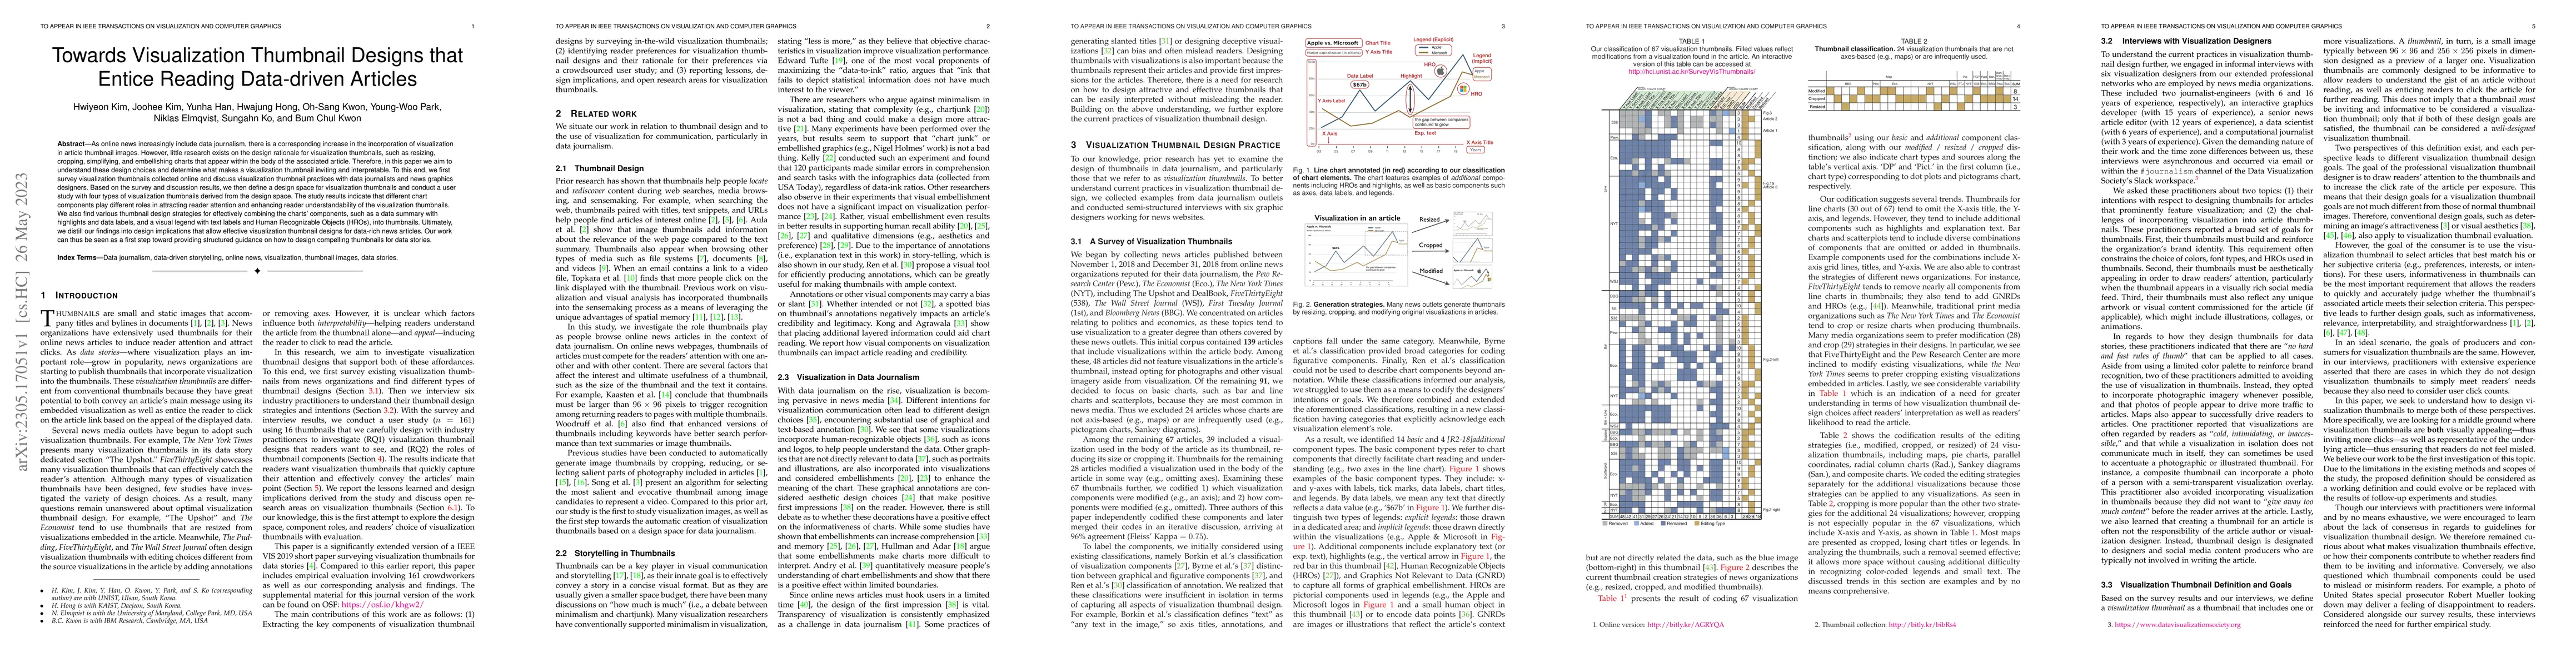
As online news increasingly include data journalism, there is a corresponding increase in the incorporation of visualization in article thumbnail images. However, little research exists on the desig...
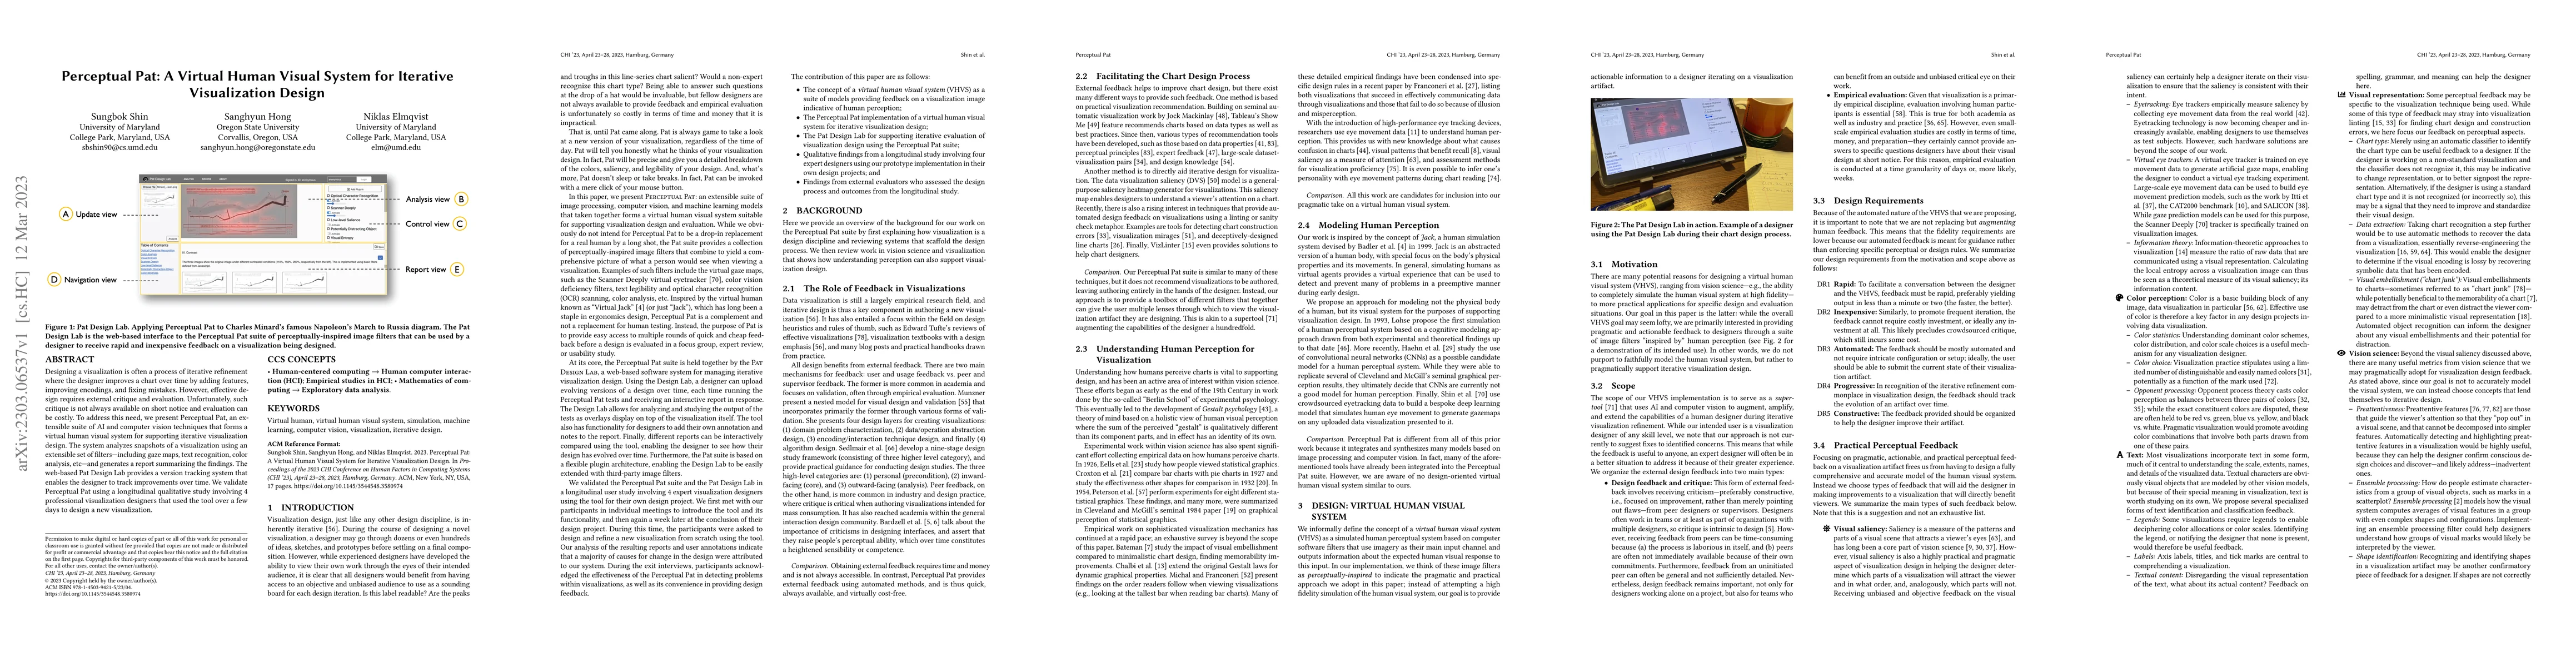
Designing a visualization is often a process of iterative refinement where the designer improves a chart over time by adding features, improving encodings, and fixing mistakes. However, effective de...
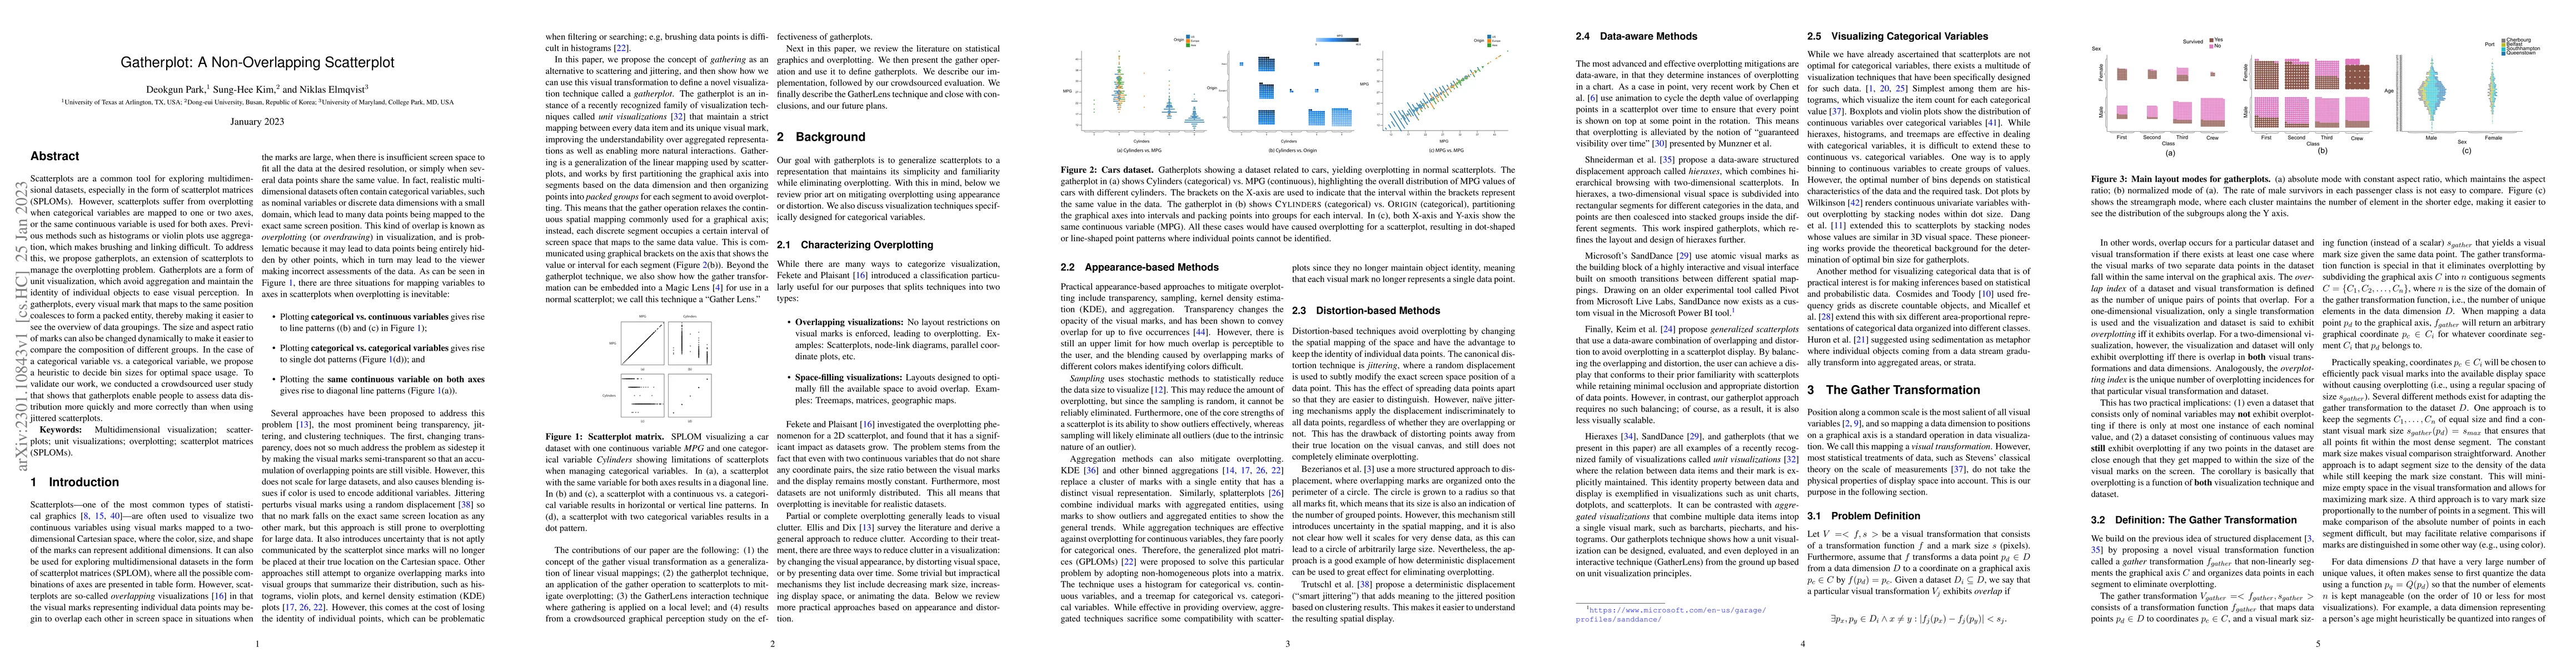
Scatterplots are a common tool for exploring multidimensional datasets, especially in the form of scatterplot matrices (SPLOMs). However, scatterplots suffer from overplotting when categorical varia...
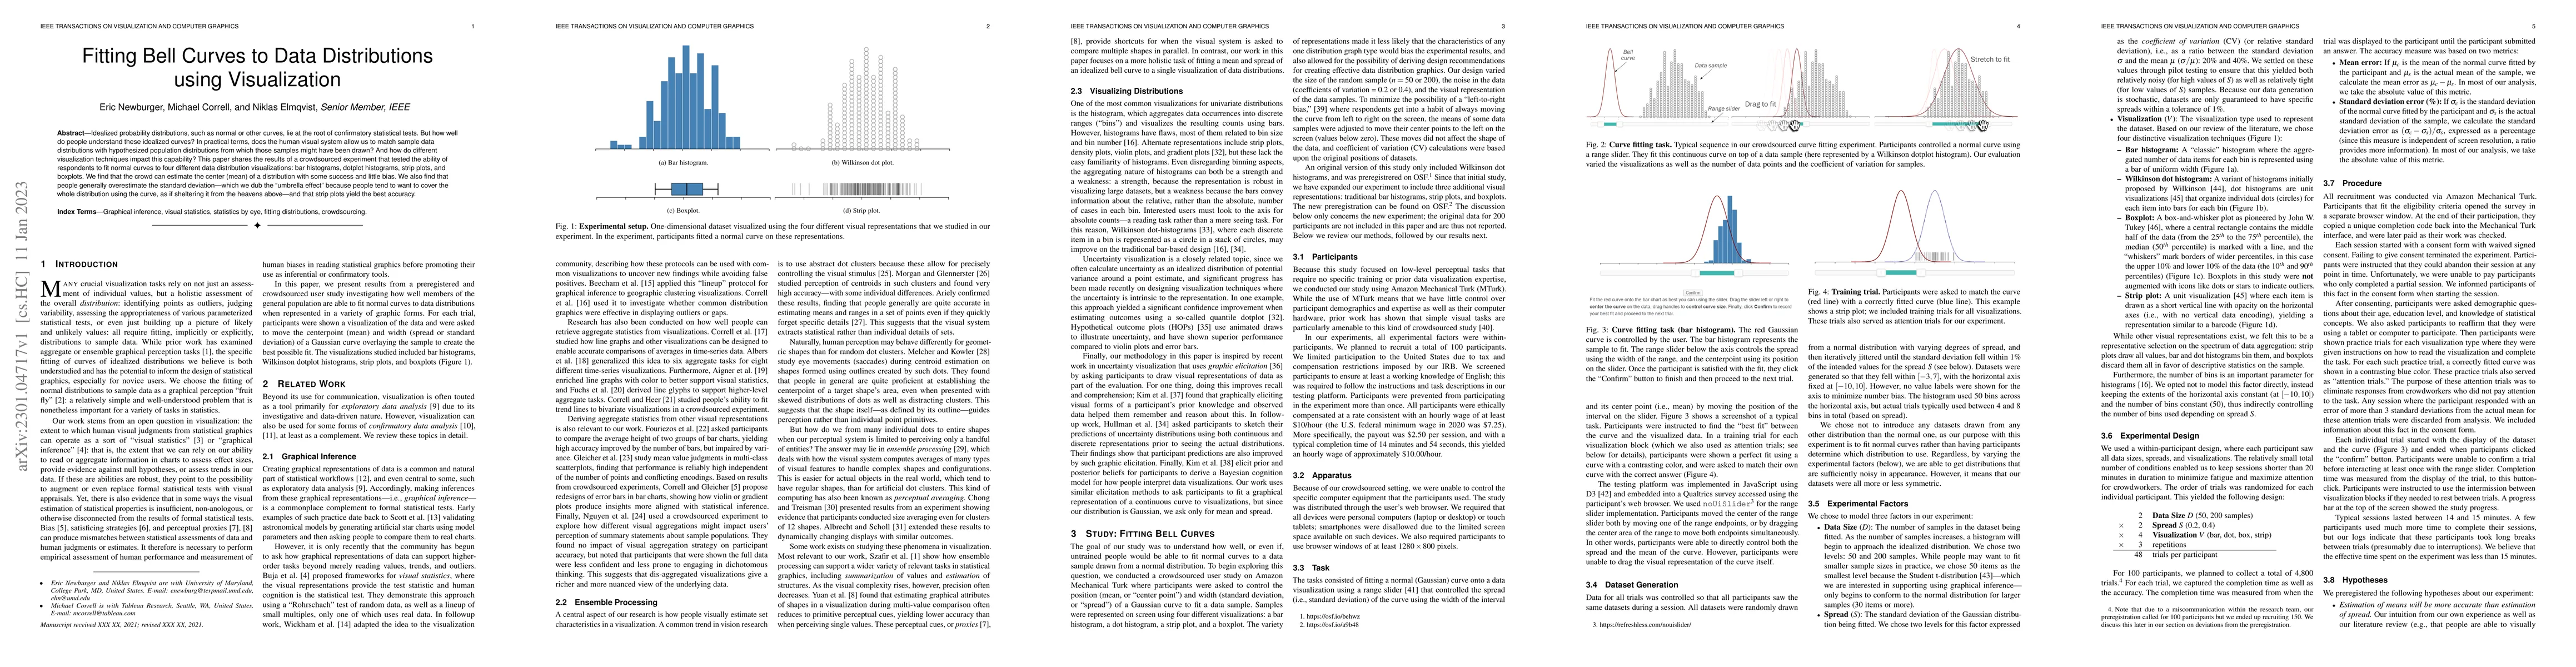
Idealized probability distributions, such as normal or other curves, lie at the root of confirmatory statistical tests. But how well do people understand these idealized curves? In practical terms, ...
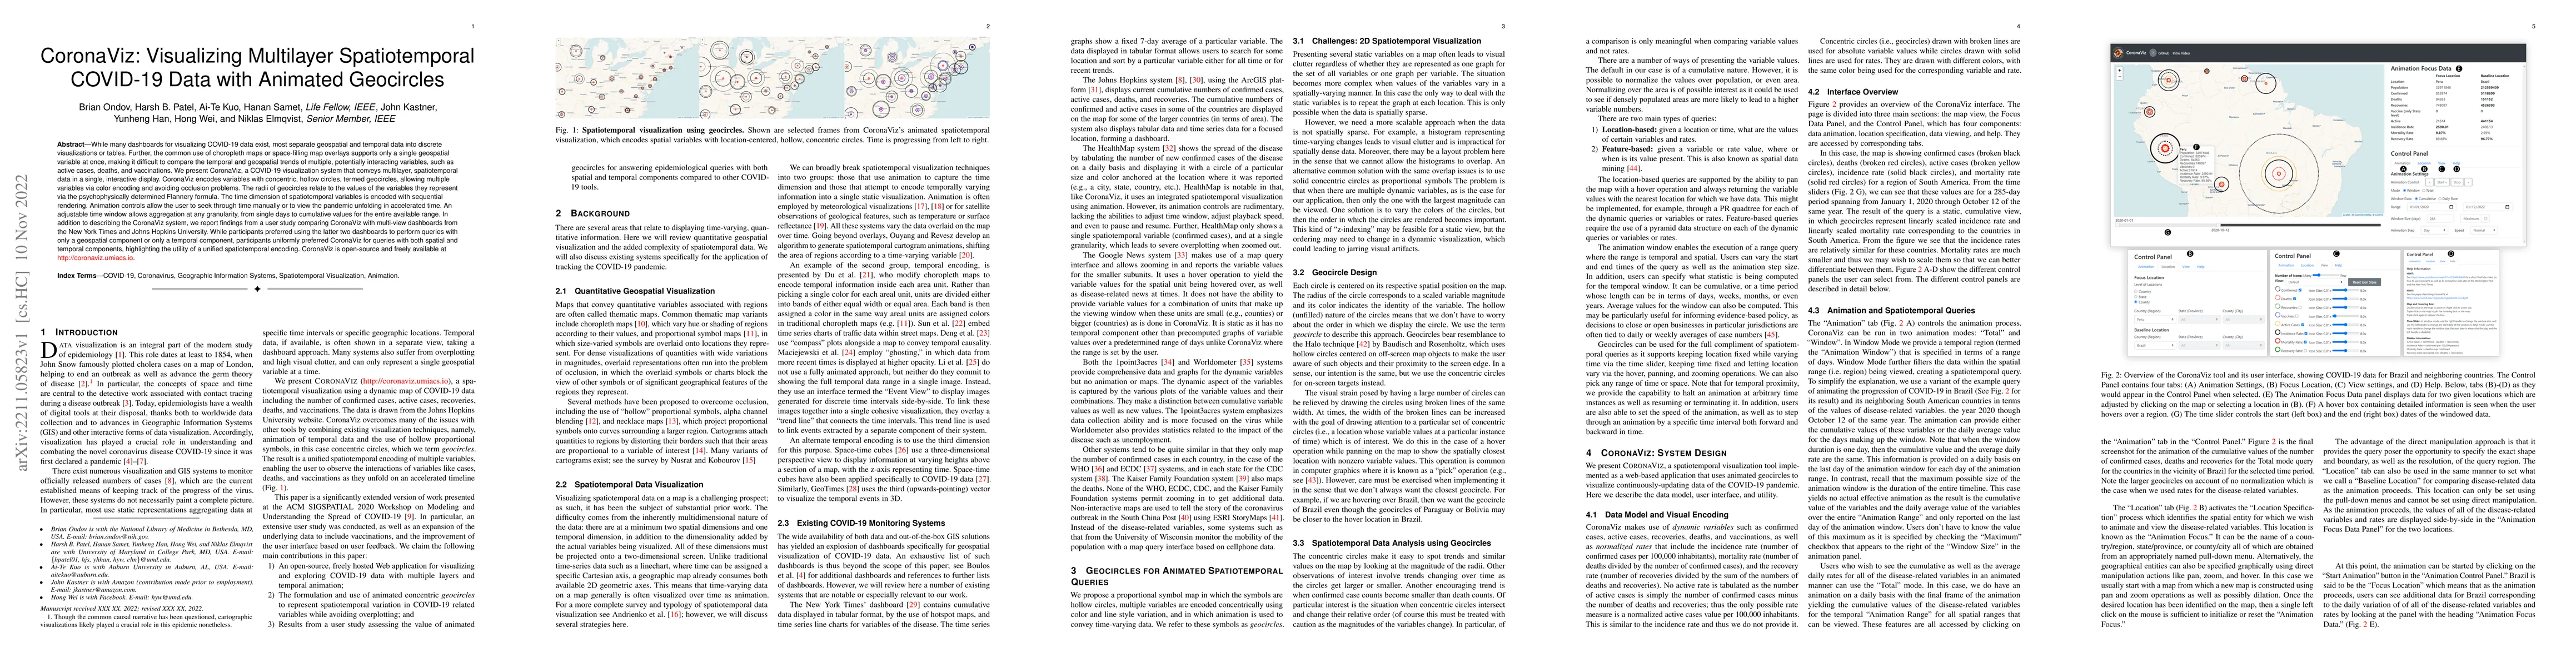
While many dashboards for visualizing COVID-19 data exist, most separate geospatial and temporal data into discrete visualizations or tables. Further, the common use of choropleth maps or space-fill...
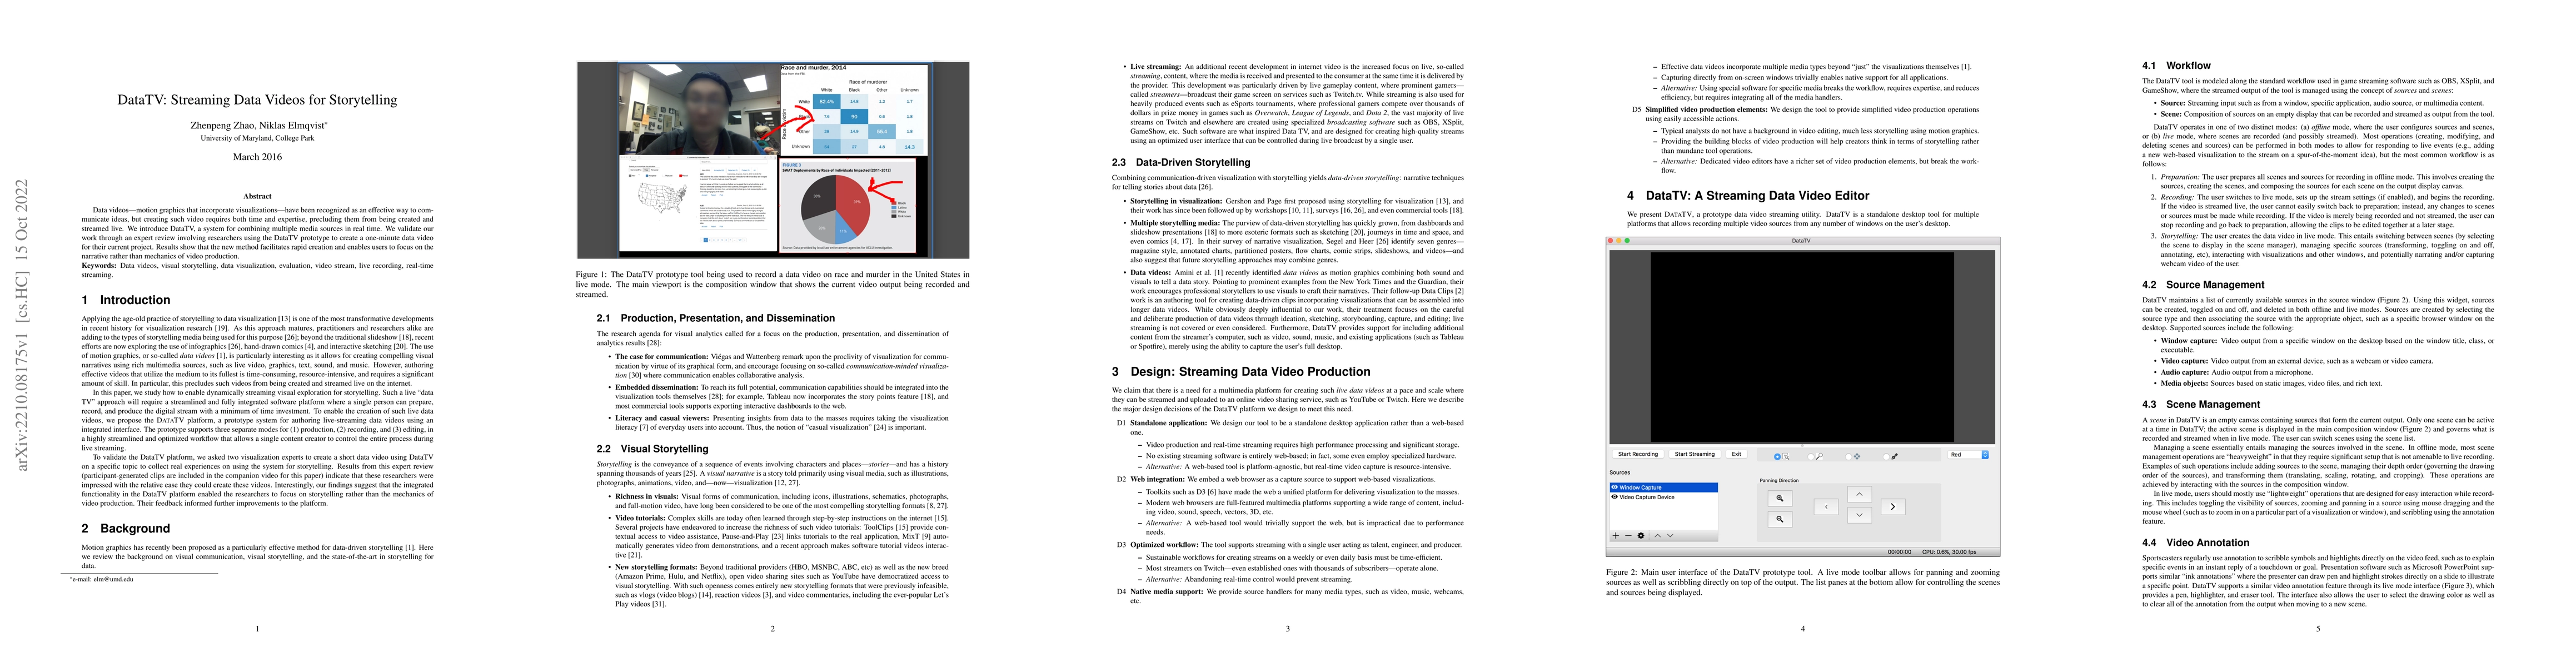
Data videos -- motion graphics that incorporate visualizations -- have been recognized as an effective way to communicate ideas, but creating such video requires both time and expertise, precluding ...
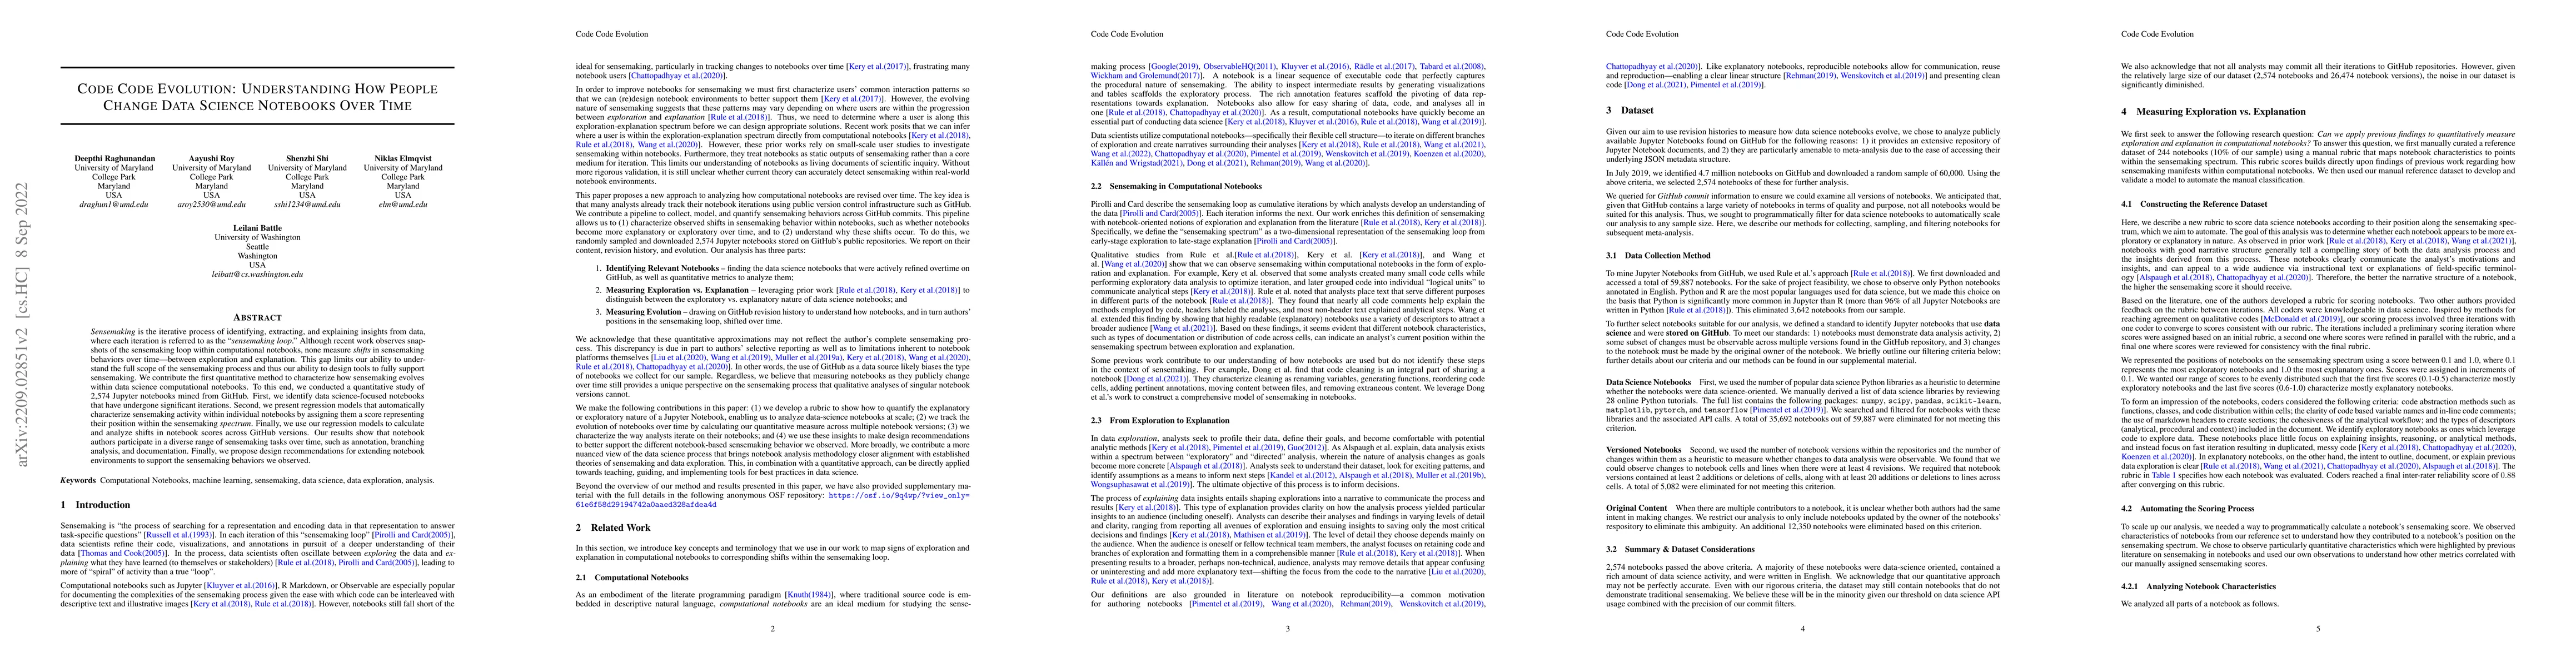
Sensemaking is the iterative process of identifying, extracting, and explaining insights from data, where each iteration is referred to as the "sensemaking loop." Although recent work observes snaps...
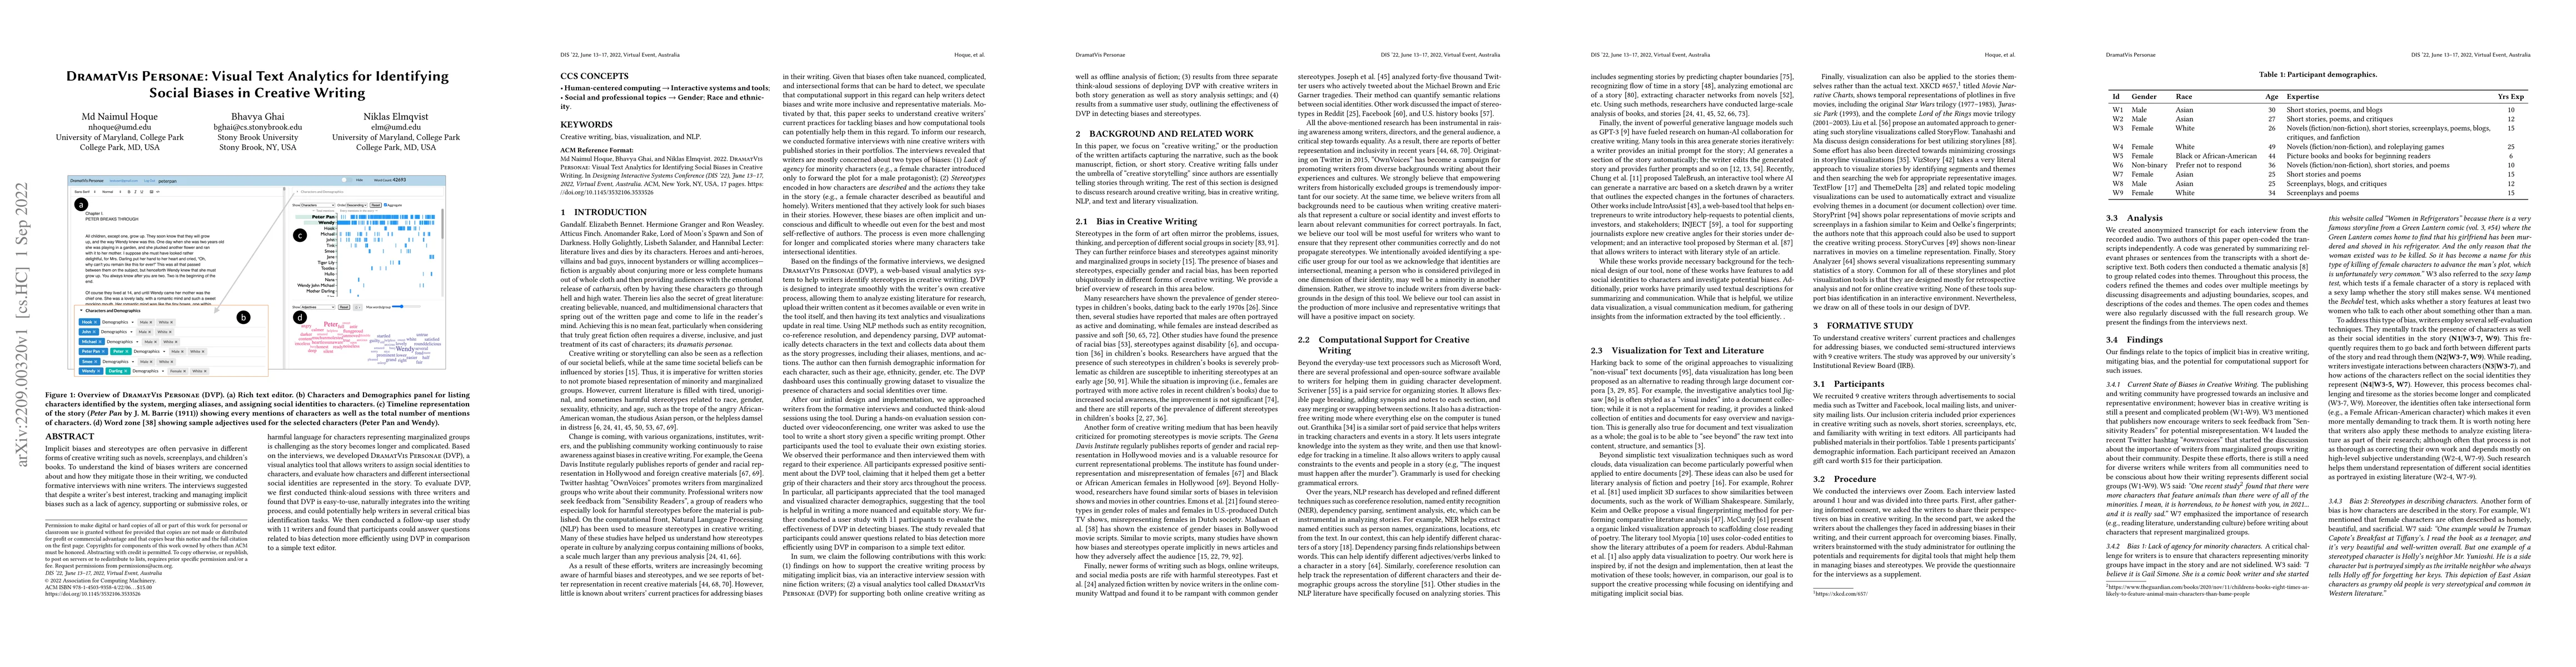
Implicit biases and stereotypes are often pervasive in different forms of creative writing such as novels, screenplays, and children's books. To understand the kind of biases writers are concerned a...
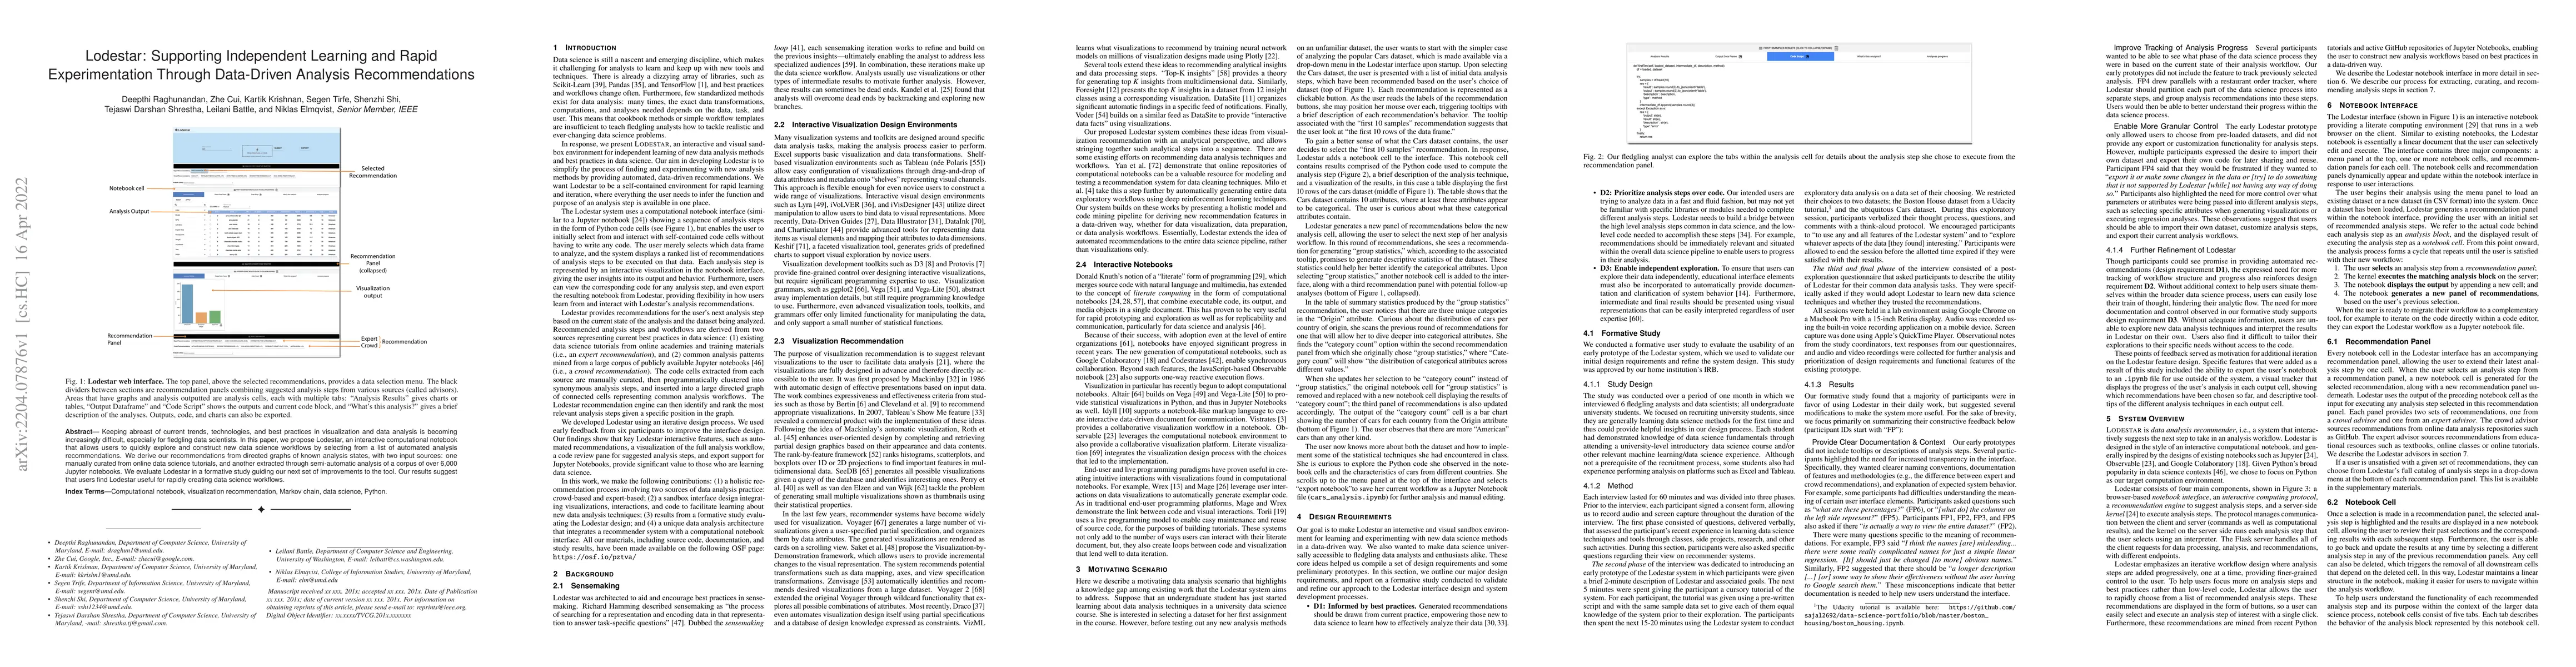
Keeping abreast of current trends, technologies, and best practices in visualization and data analysis is becoming increasingly difficult, especially for fledgling data scientists. In this paper, we...
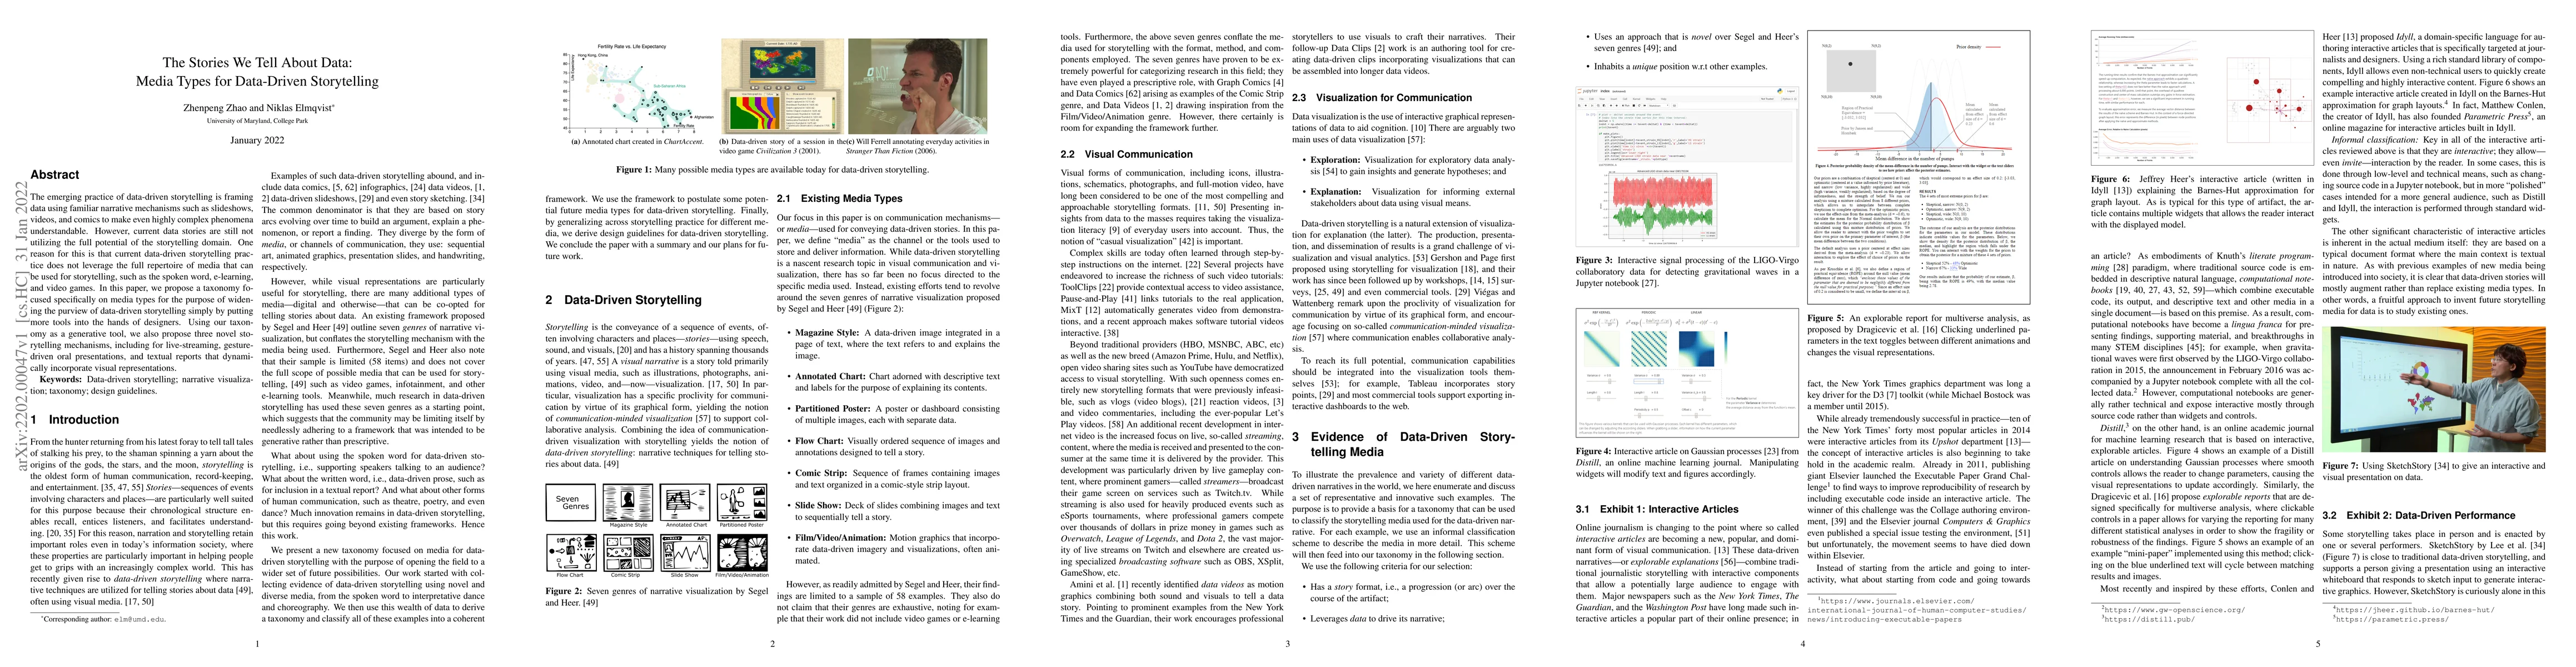
The emerging practice of data-driven storytelling is framing data using familiar narrative mechanisms such as slideshows, videos, and comics to make even highly complex phenomena understandable. How...
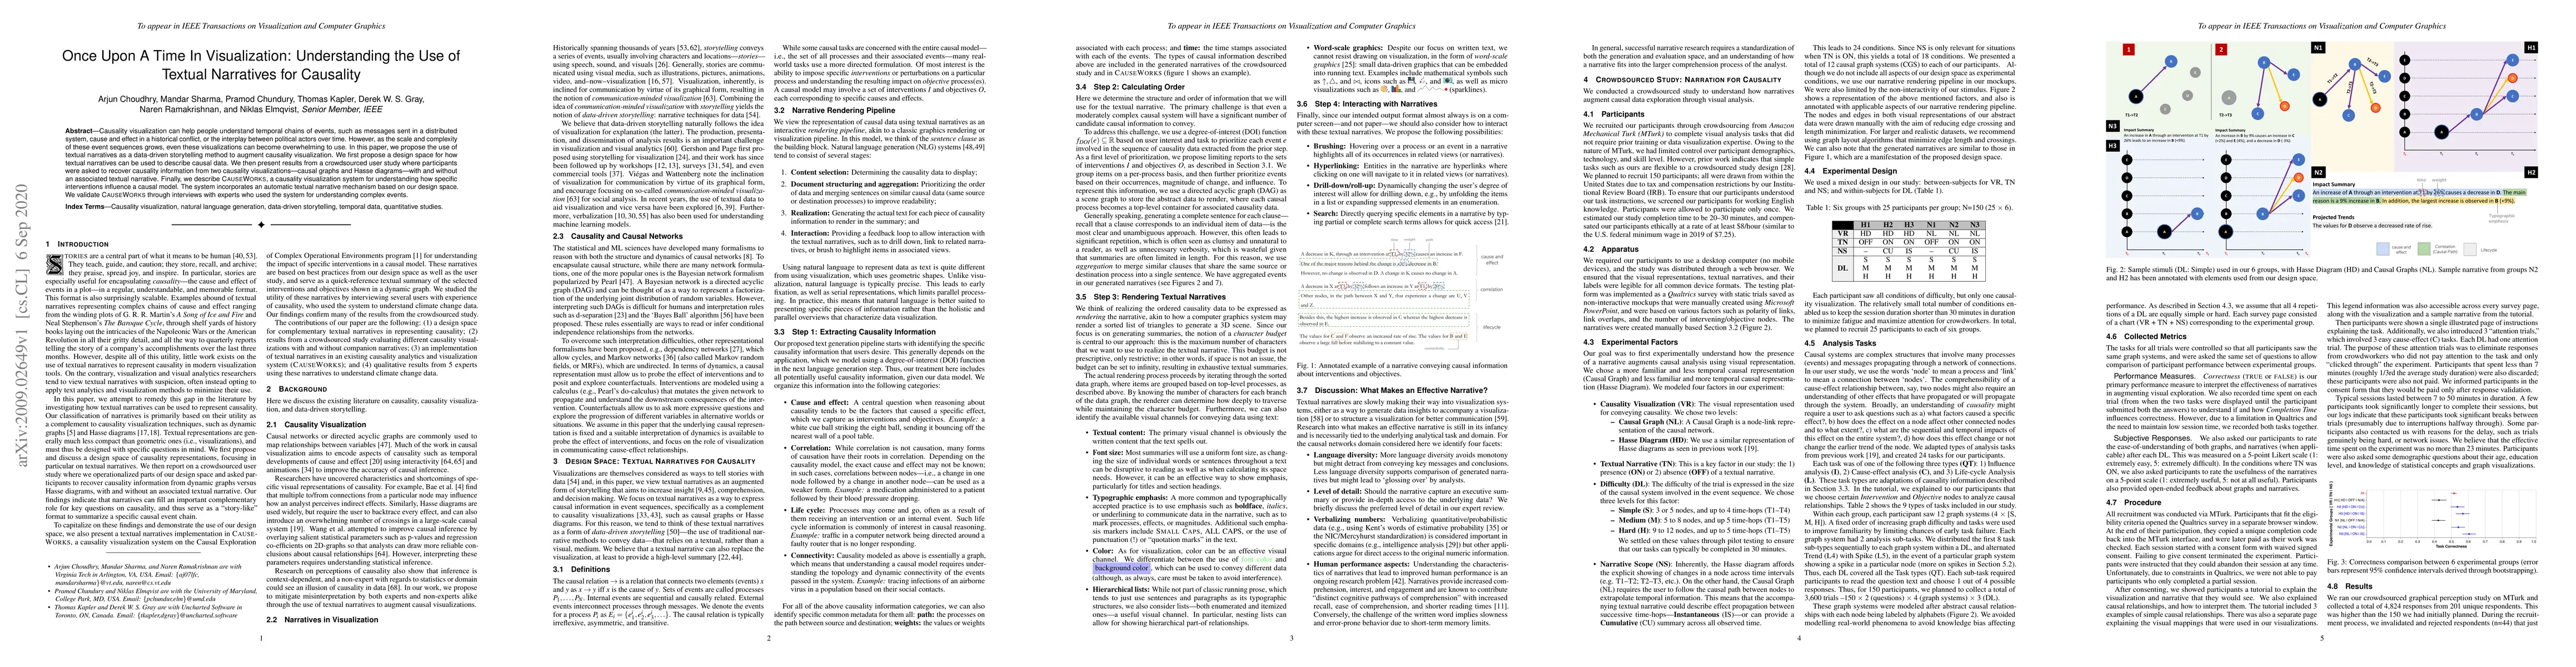
Causality visualization can help people understand temporal chains of events, such as messages sent in a distributed system, cause and effect in a historical conflict, or the interplay between polit...
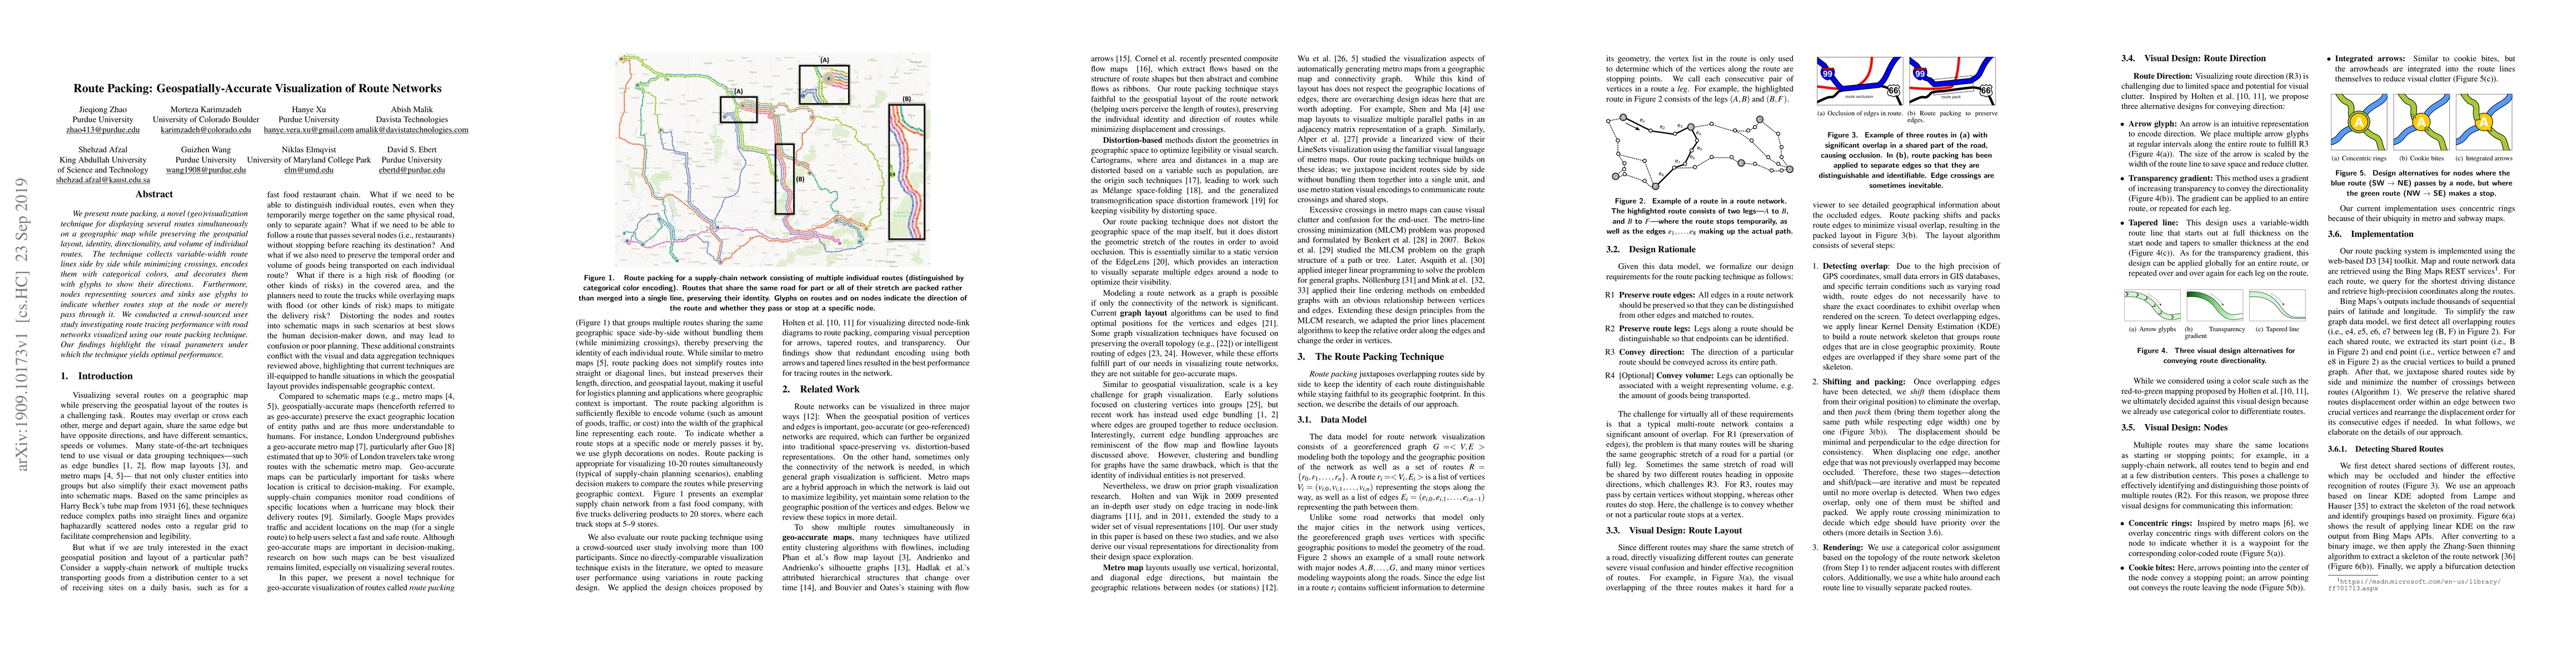
We present route packing, a novel (geo)visualization technique for displaying several routes simultaneously on a geographic map while preserving the geospatial layout, identity, directionality, and ...
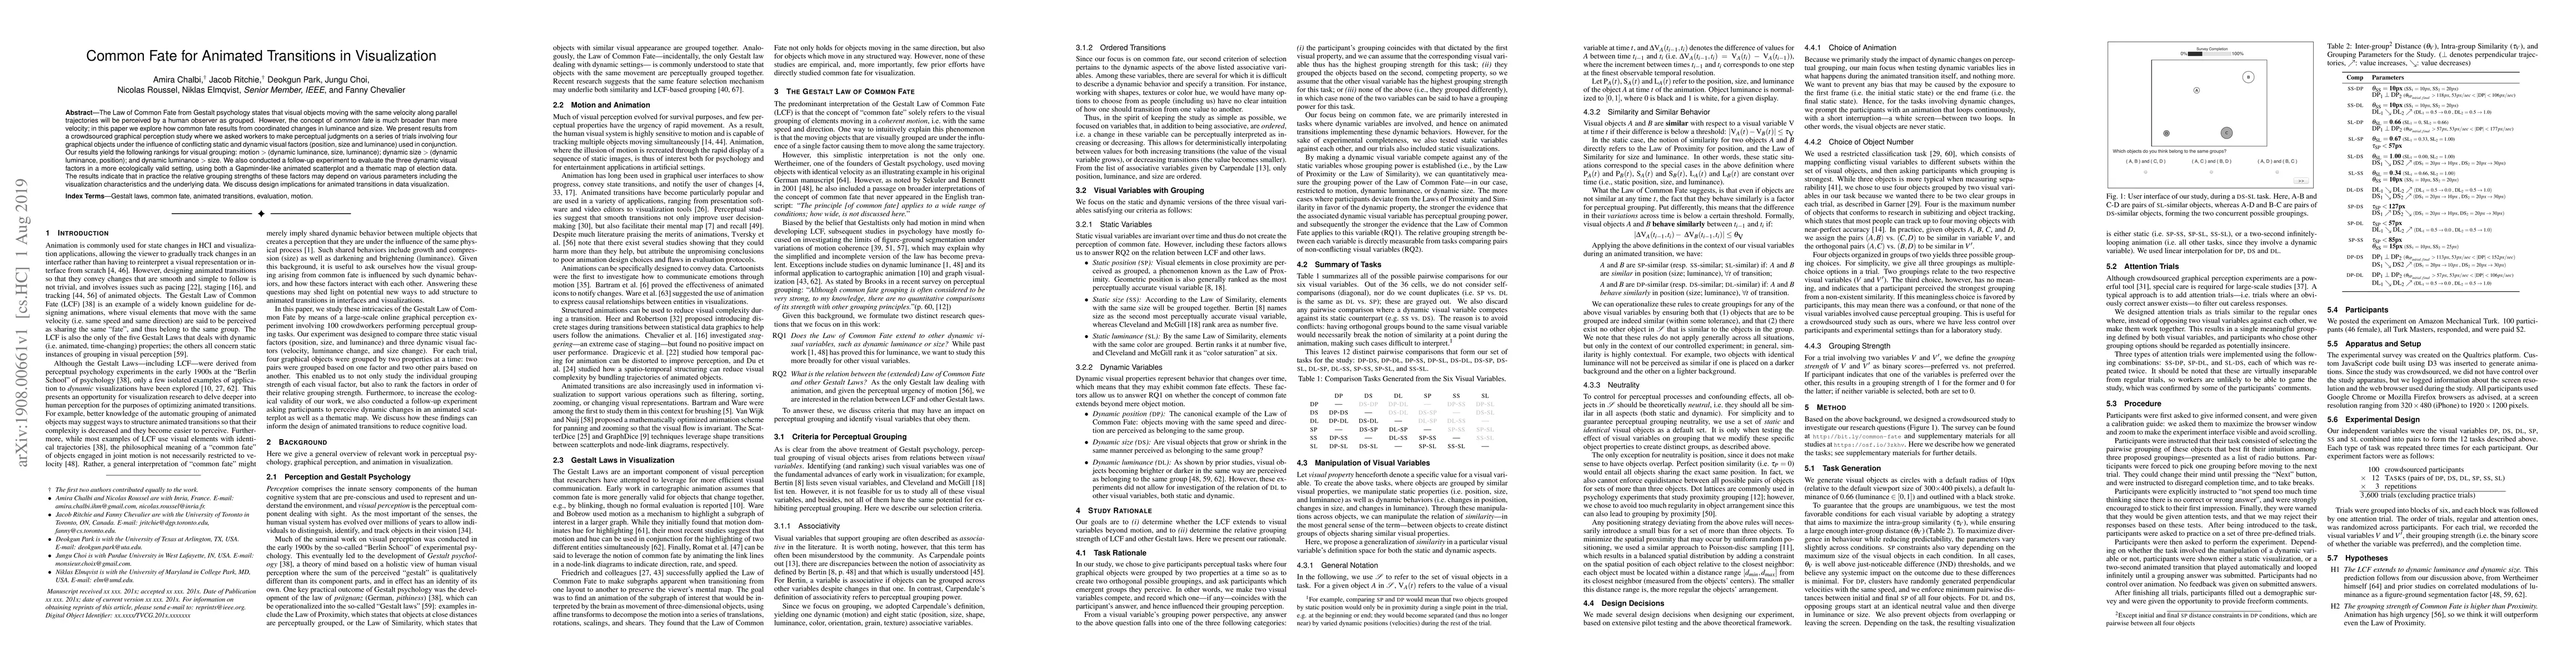
The Law of Common Fate from Gestalt psychology states that visual objects moving with the same velocity along parallel trajectories will be perceived by a human observer as grouped. However, the con...
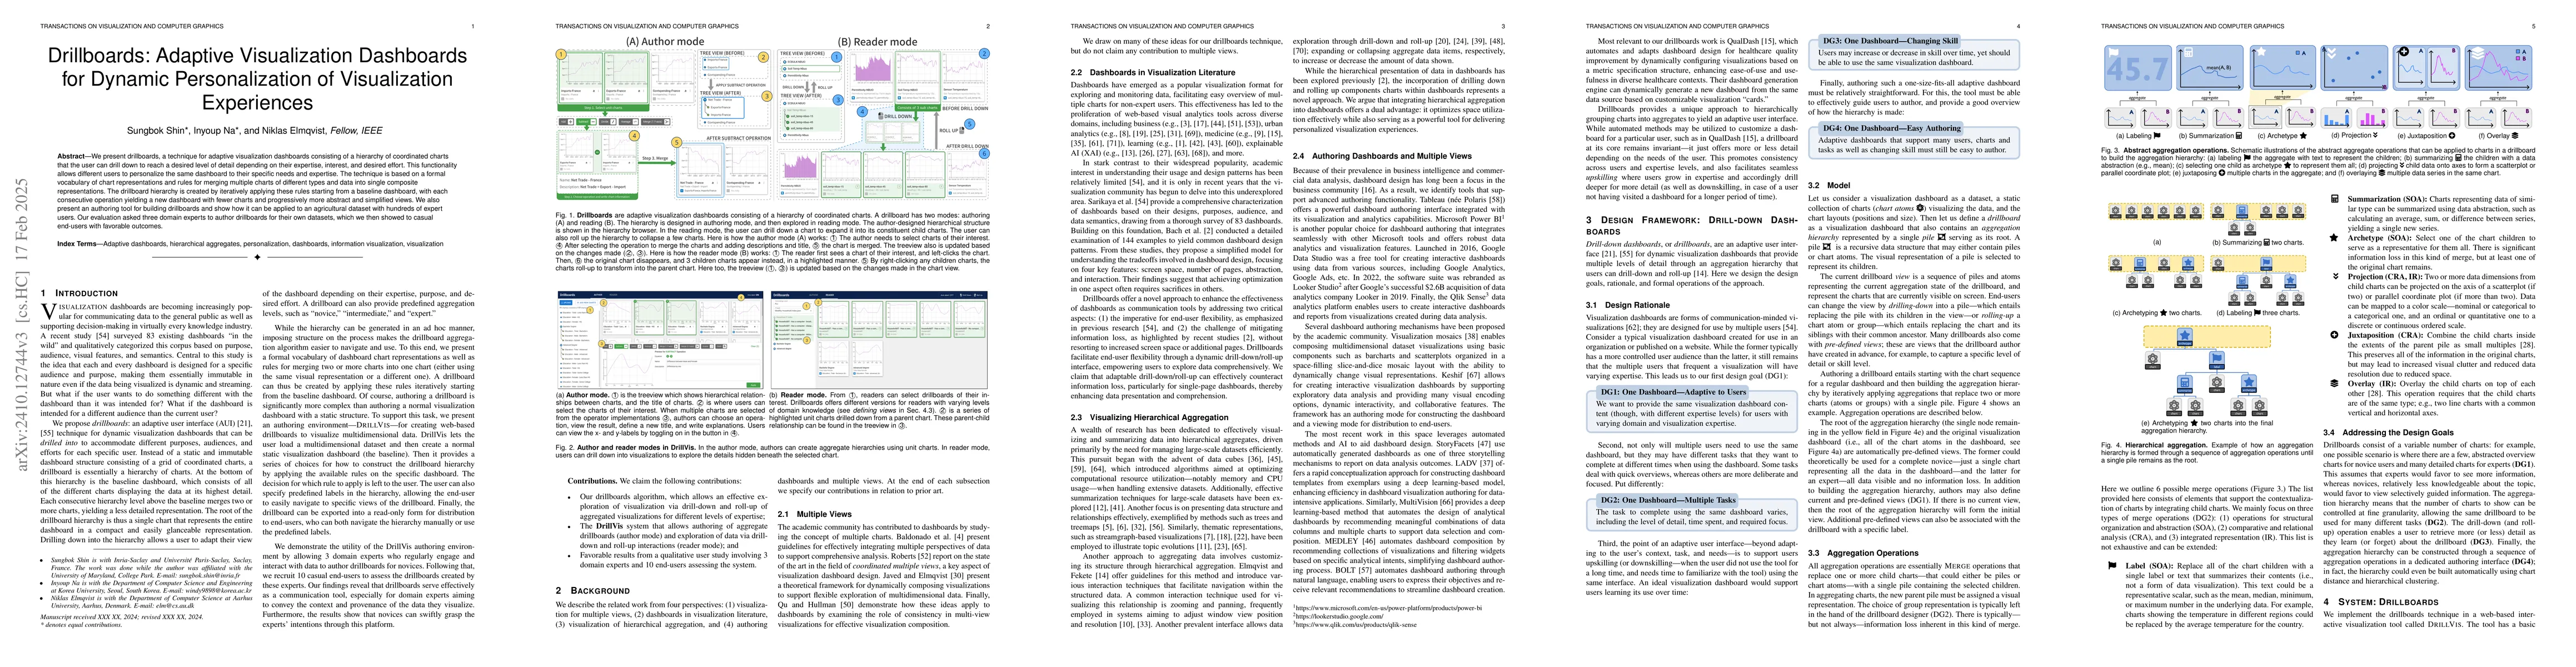
We present drillboards, a technique for adaptive visualization dashboards consisting of a hierarchy of coordinated charts that the user can drill down to reach a desired level of detail depending on t...
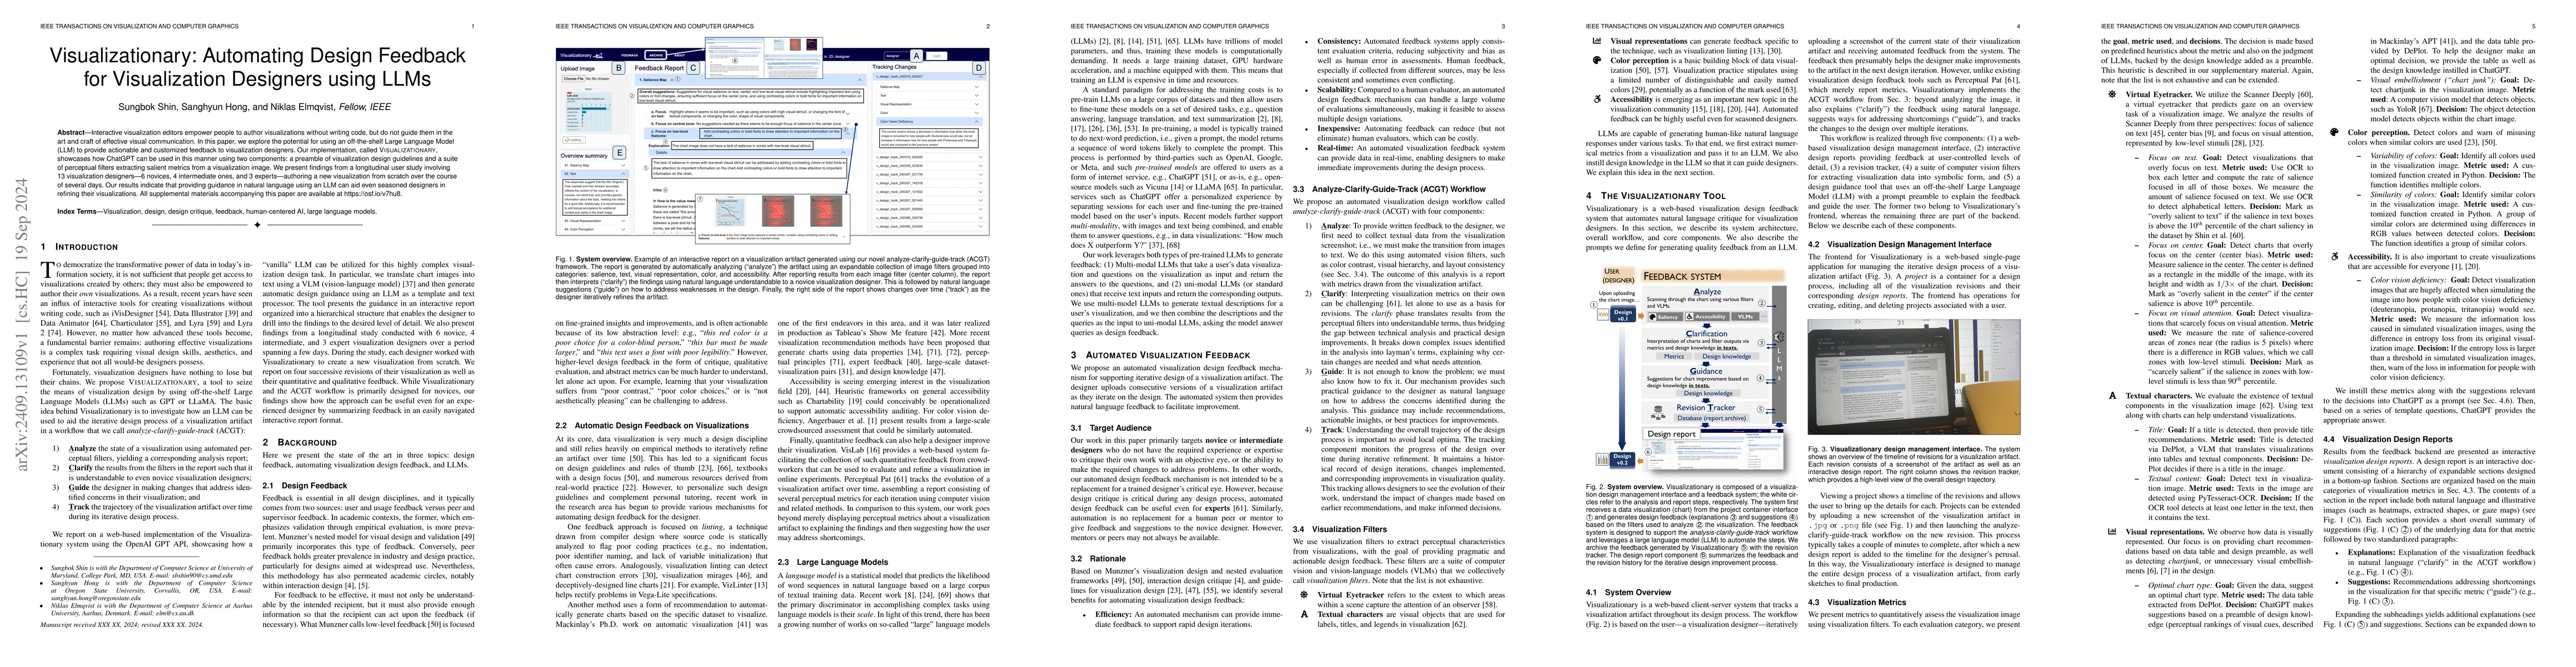
Interactive visualization editors empower people to author visualizations without writing code, but do not guide them in the art and craft of effective visual communication. In this paper, we explore ...
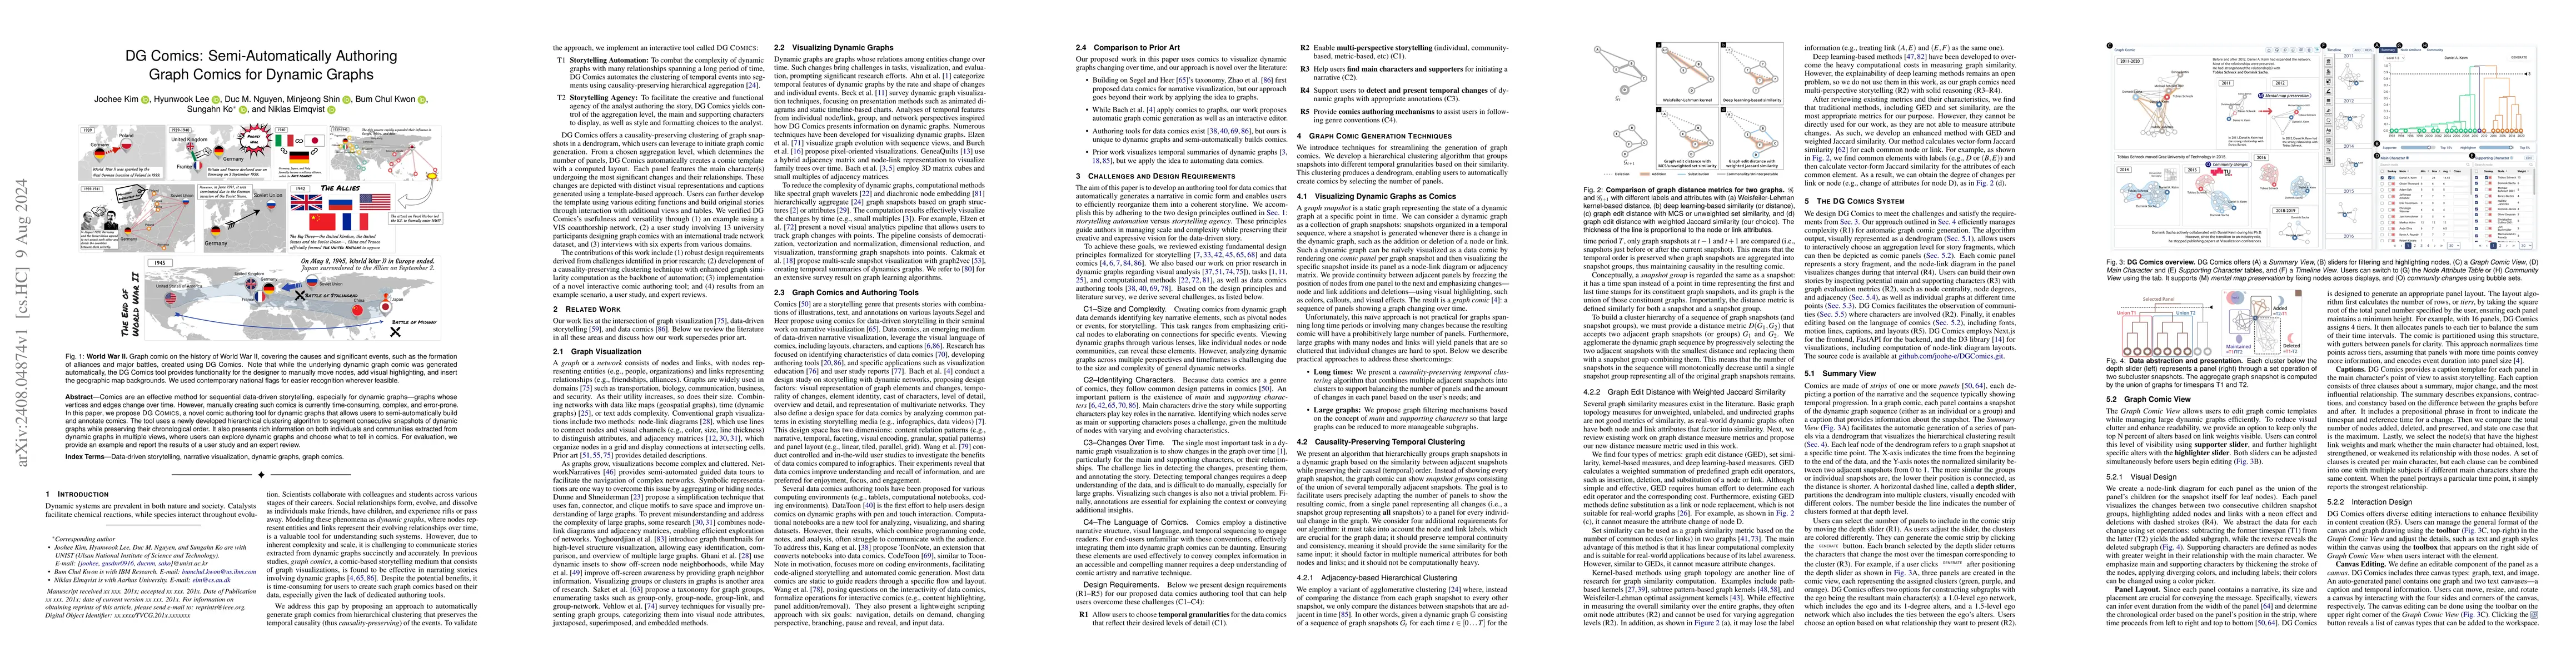
Comics are an effective method for sequential data-driven storytelling, especially for dynamic graphs -- graphs whose vertices and edges change over time. However, manually creating such comics is cur...
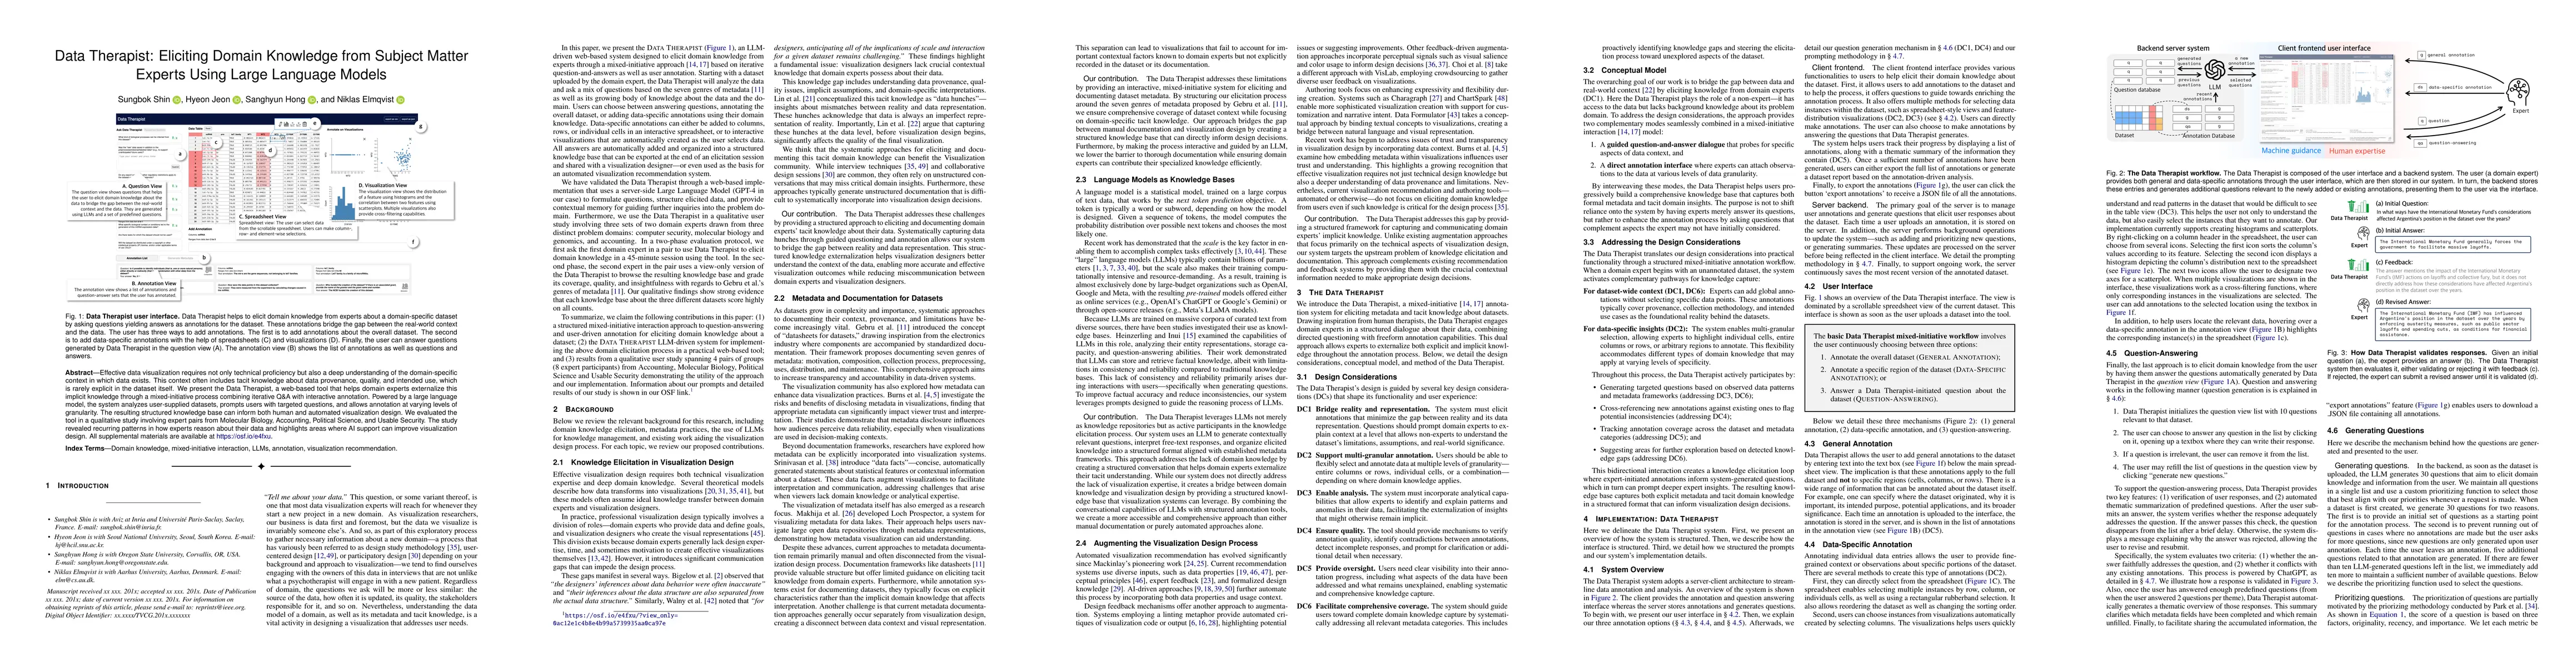
Effective data visualization requires not only technical proficiency but also a deep understanding of the domain-specific context in which data exists. This context often includes tacit knowledge abou...
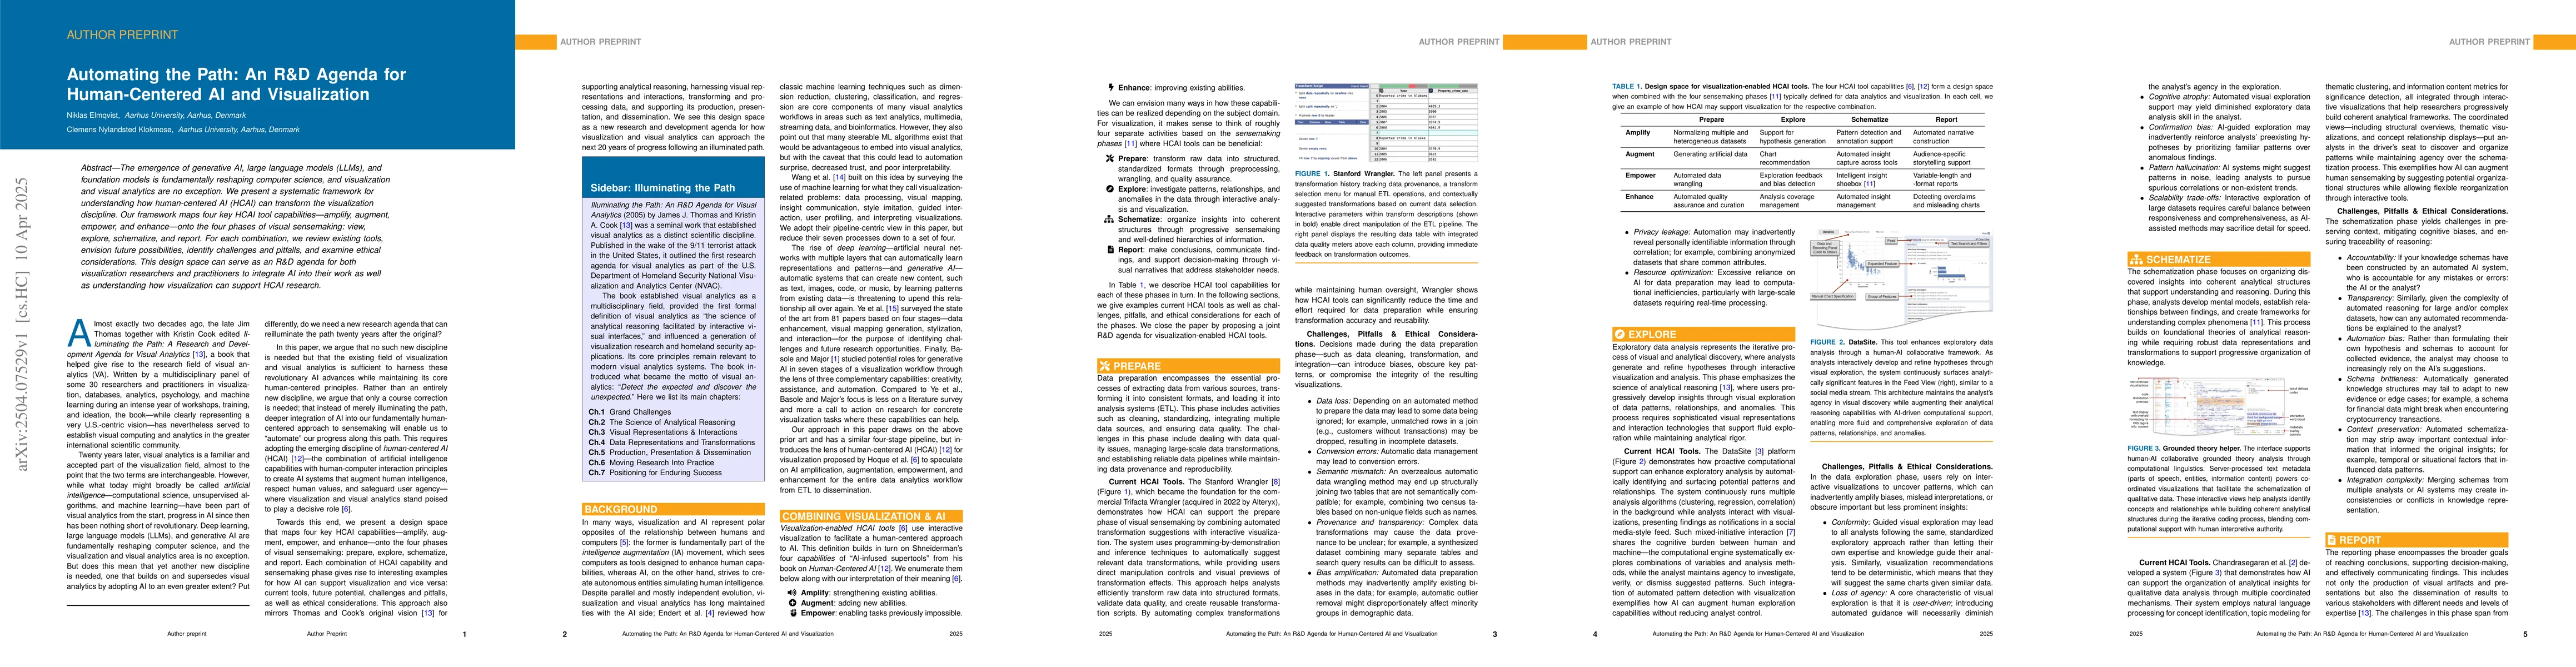
The emergence of generative AI, large language models (LLMs), and foundation models is fundamentally reshaping computer science, and visualization and visual analytics are no exception. We present a s...
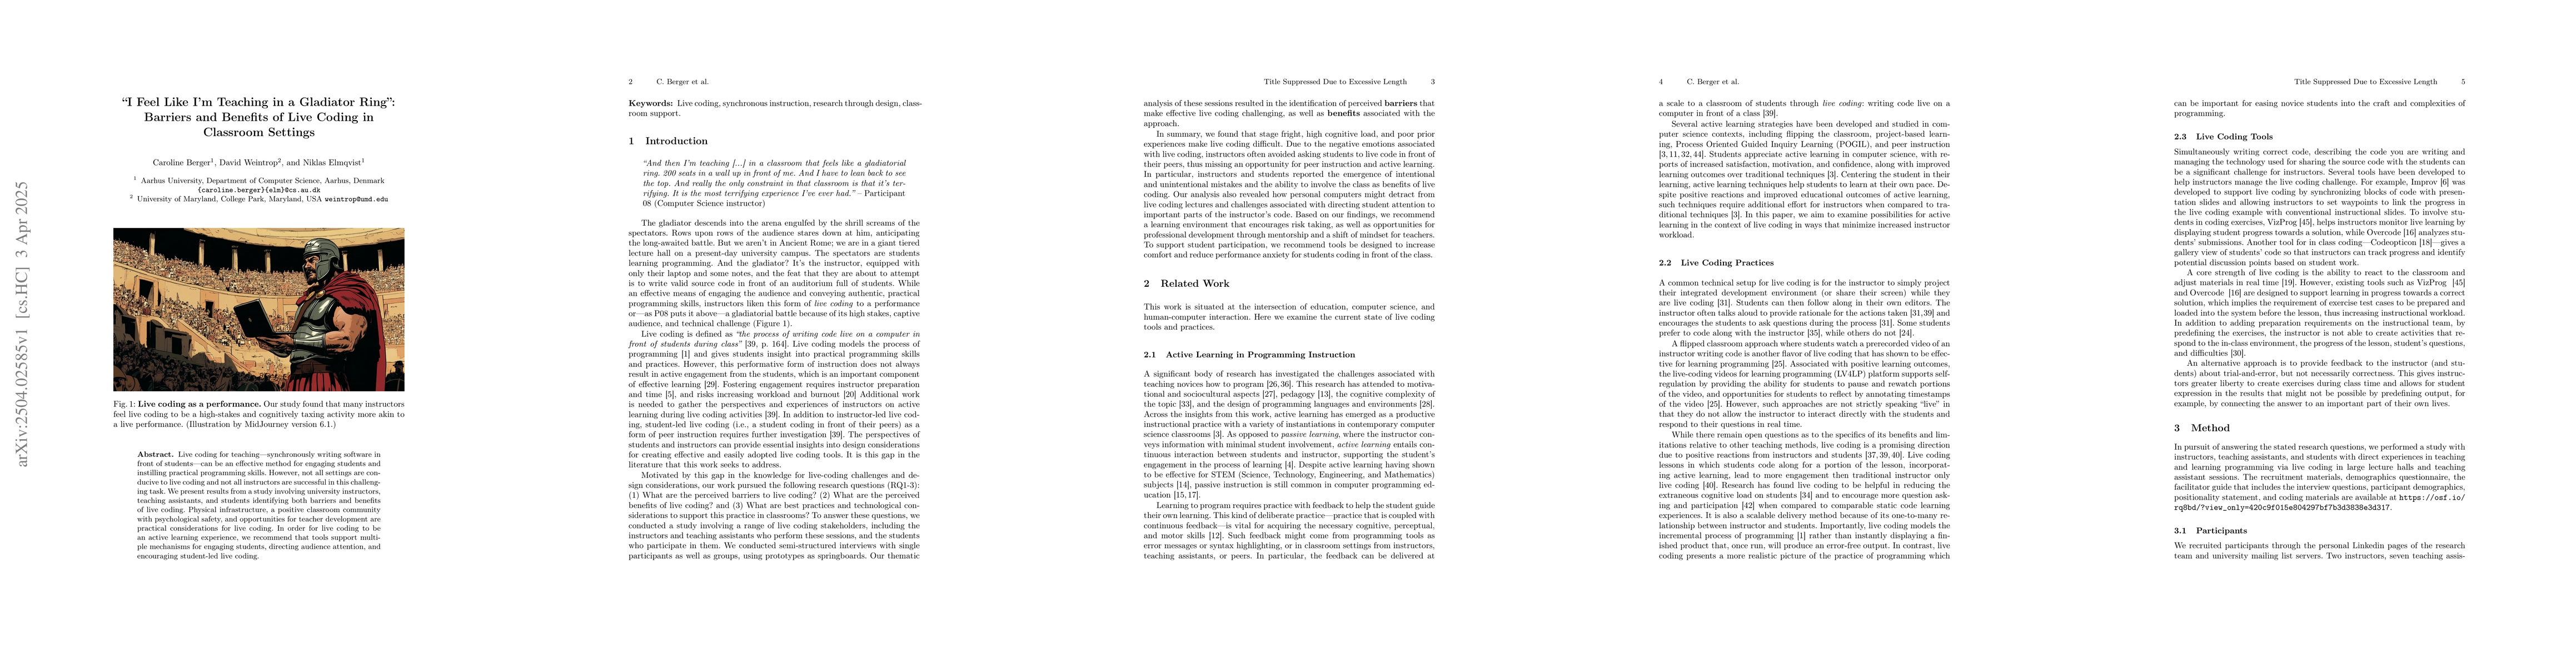
Live coding for teaching-synchronously writing software in front of students-can be an effective method for engaging students and instilling practical programming skills. However, not all settings are...
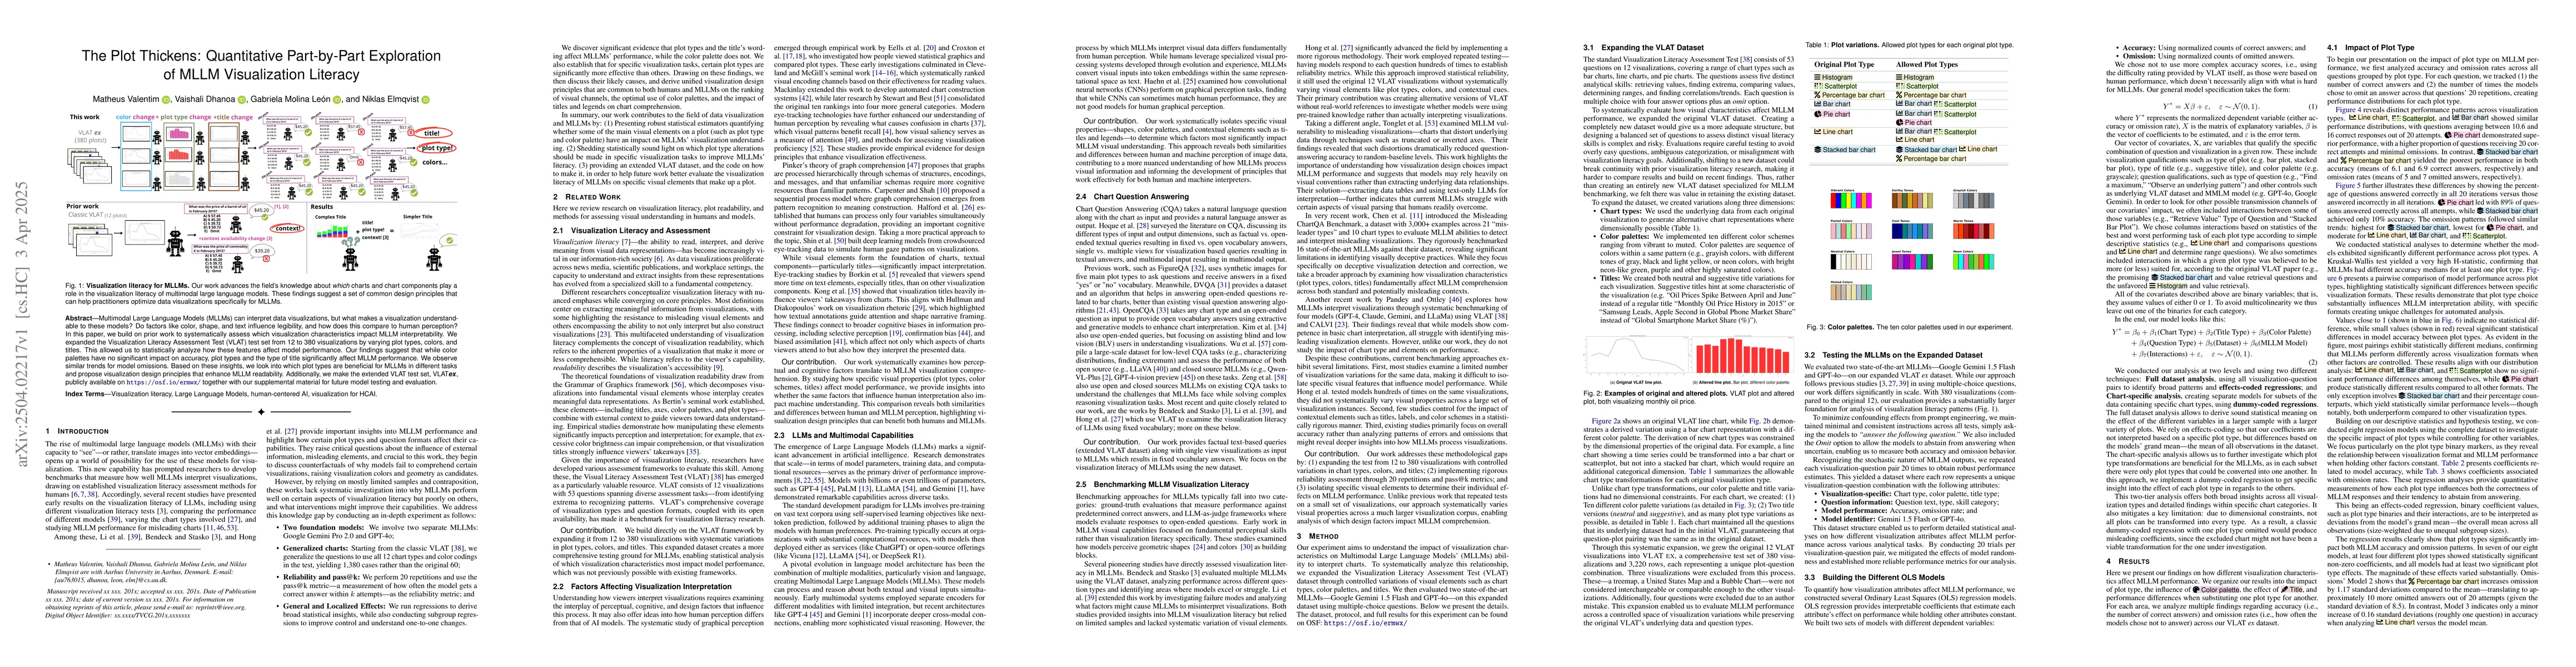
Multimodal Large Language Models (MLLMs) can interpret data visualizations, but what makes a visualization understandable to these models? Do factors like color, shape, and text influence legibility, ...
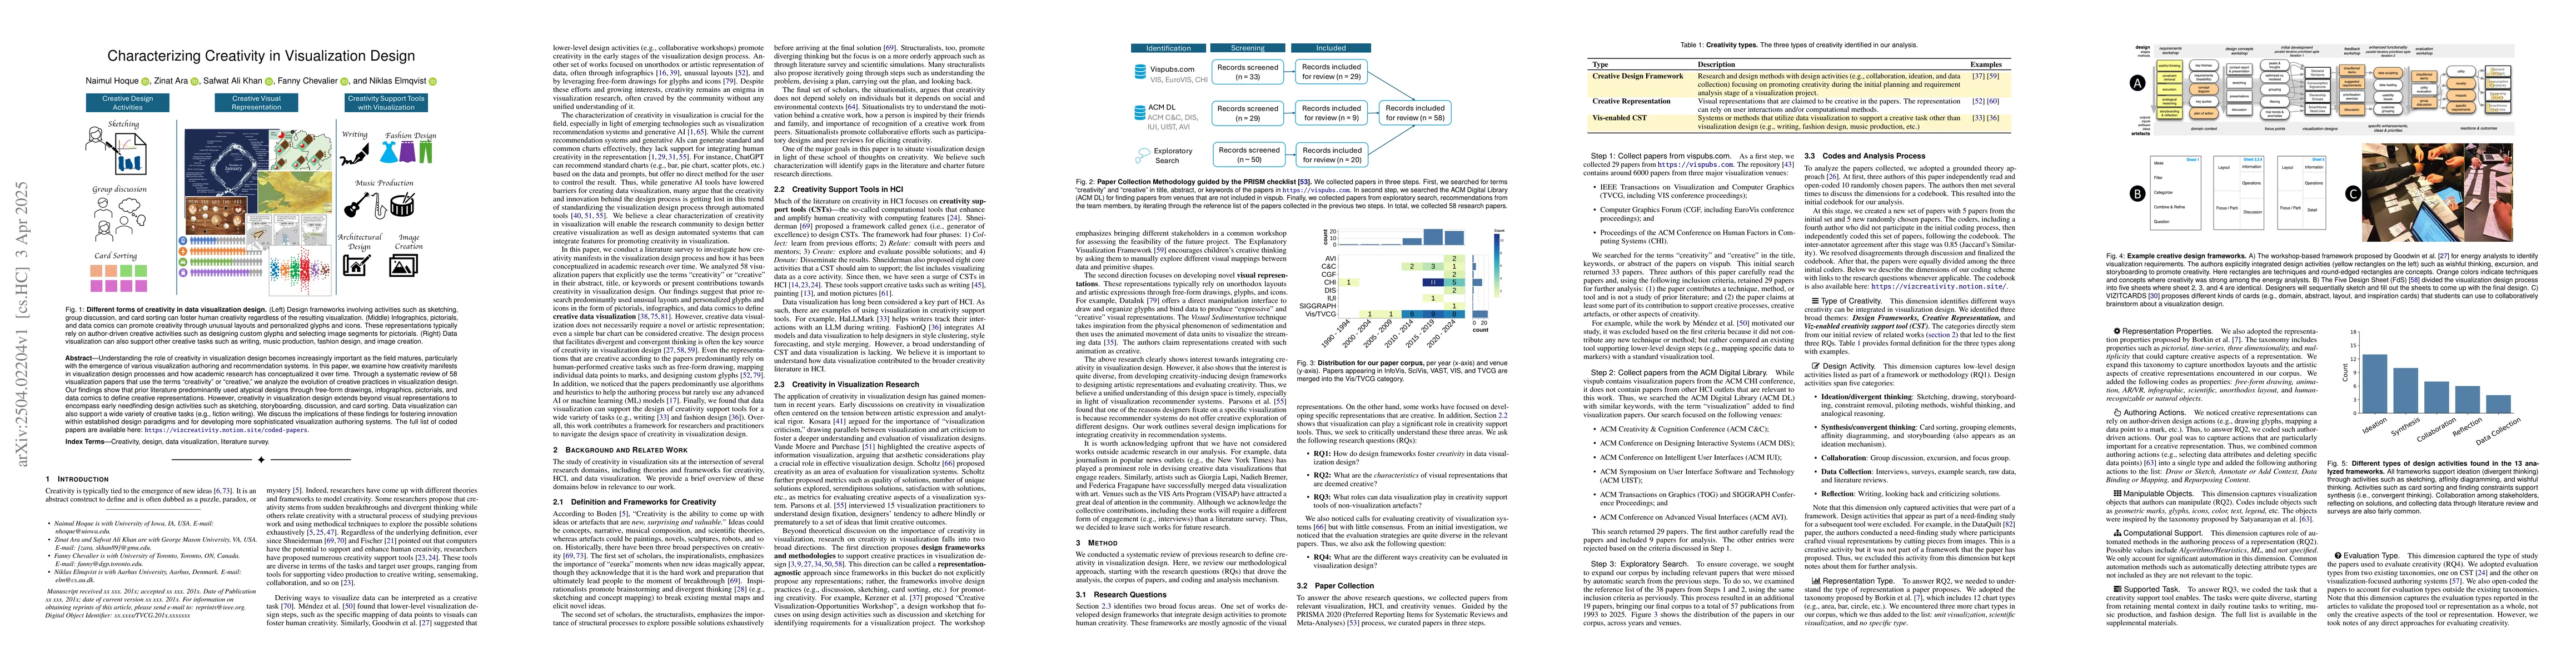
Understanding the role of creativity in visualization design becomes increasingly important as the field matures, particularly with the emergence of various visualization authoring and recommendation ...
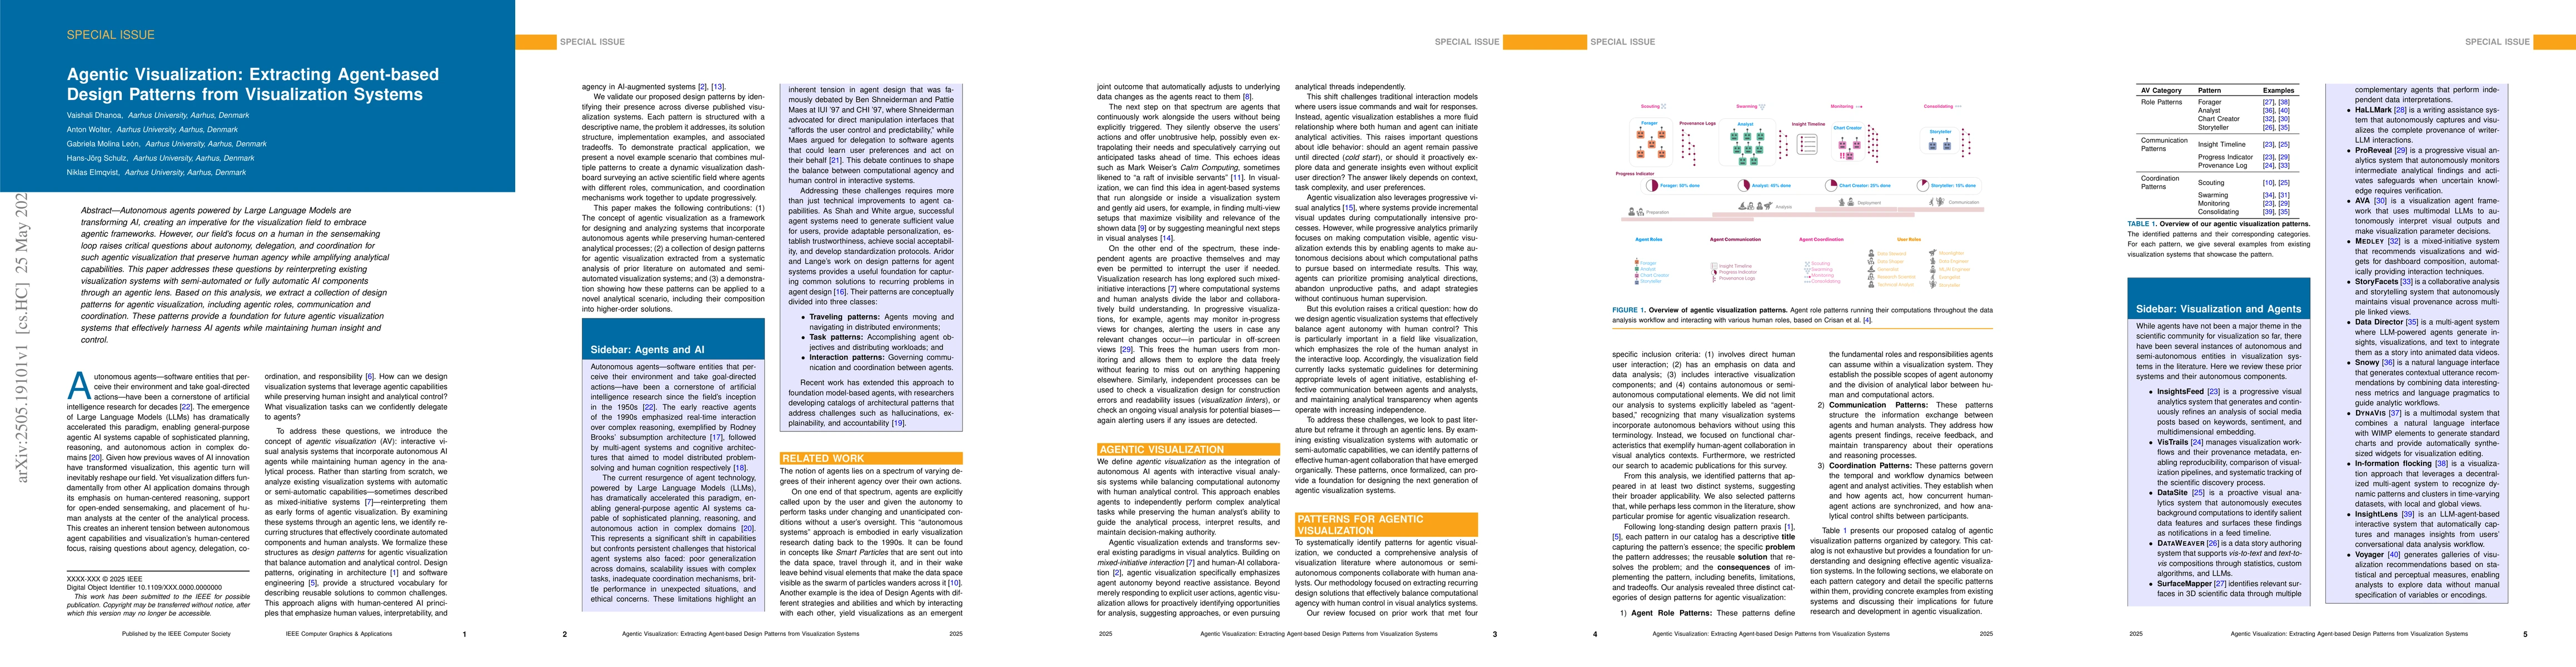
Autonomous agents powered by Large Language Models are transforming AI, creating an imperative for the visualization field to embrace agentic frameworks. However, our field's focus on a human in the s...
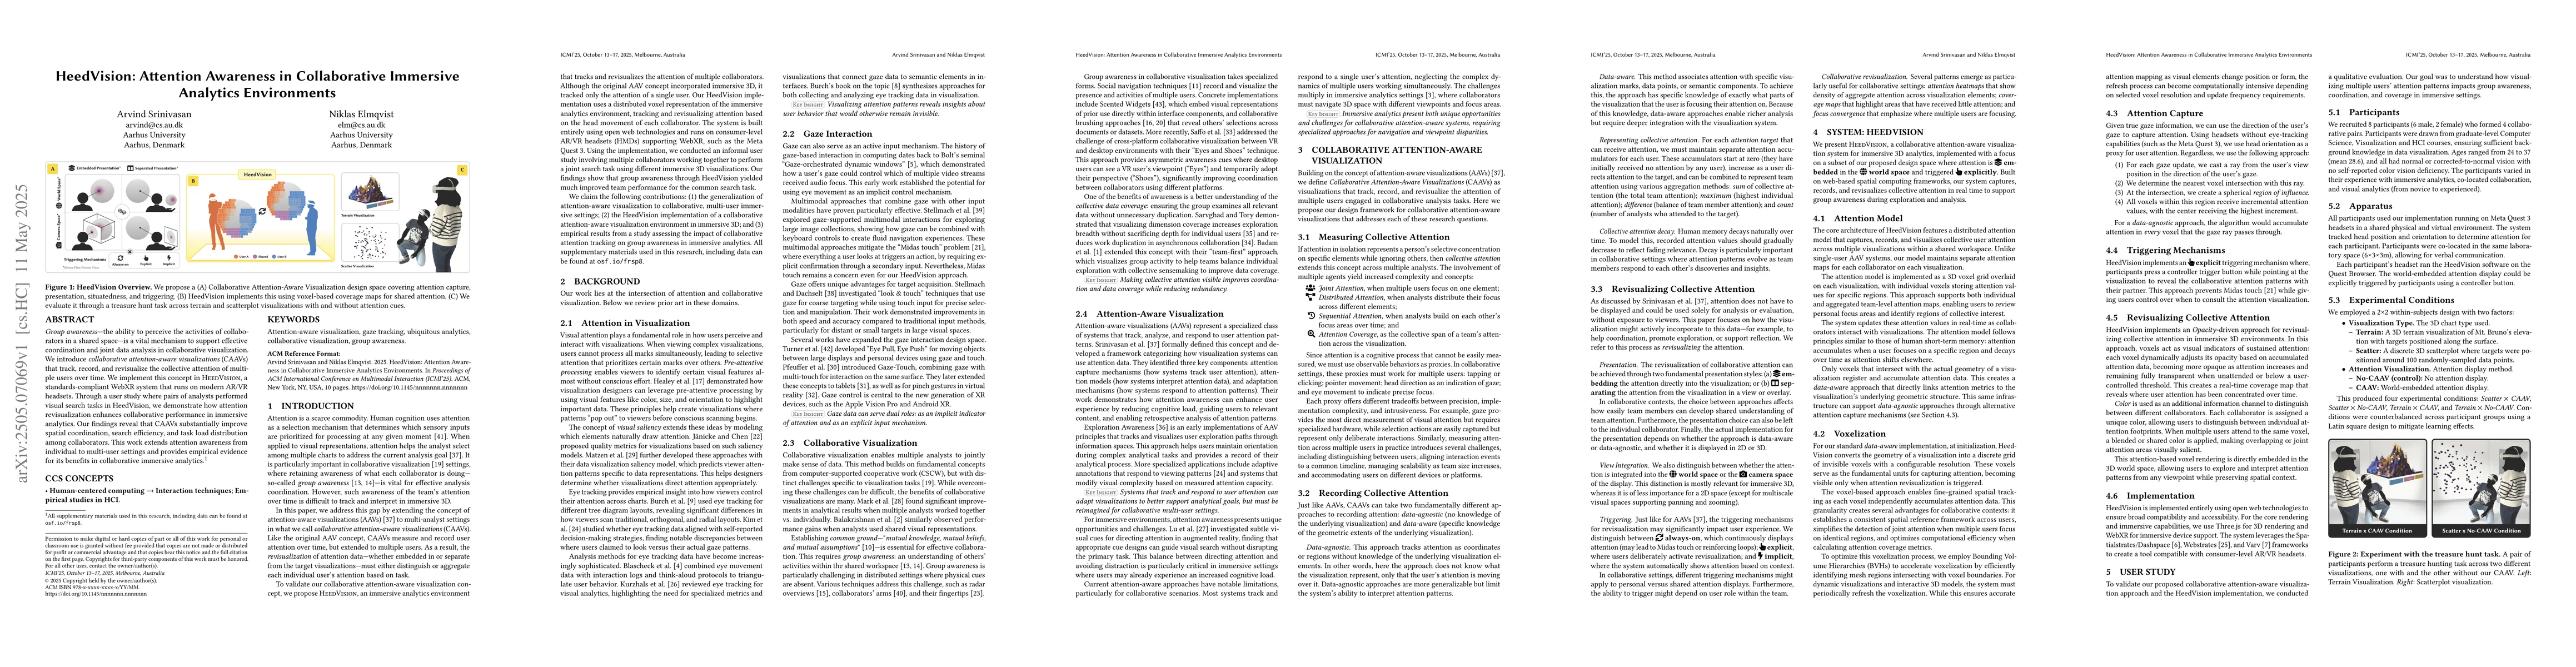
Group awareness--the ability to perceive the activities of collaborators in a shared space--is a vital mechanism to support effective coordination and joint data analysis in collaborative visualizatio...
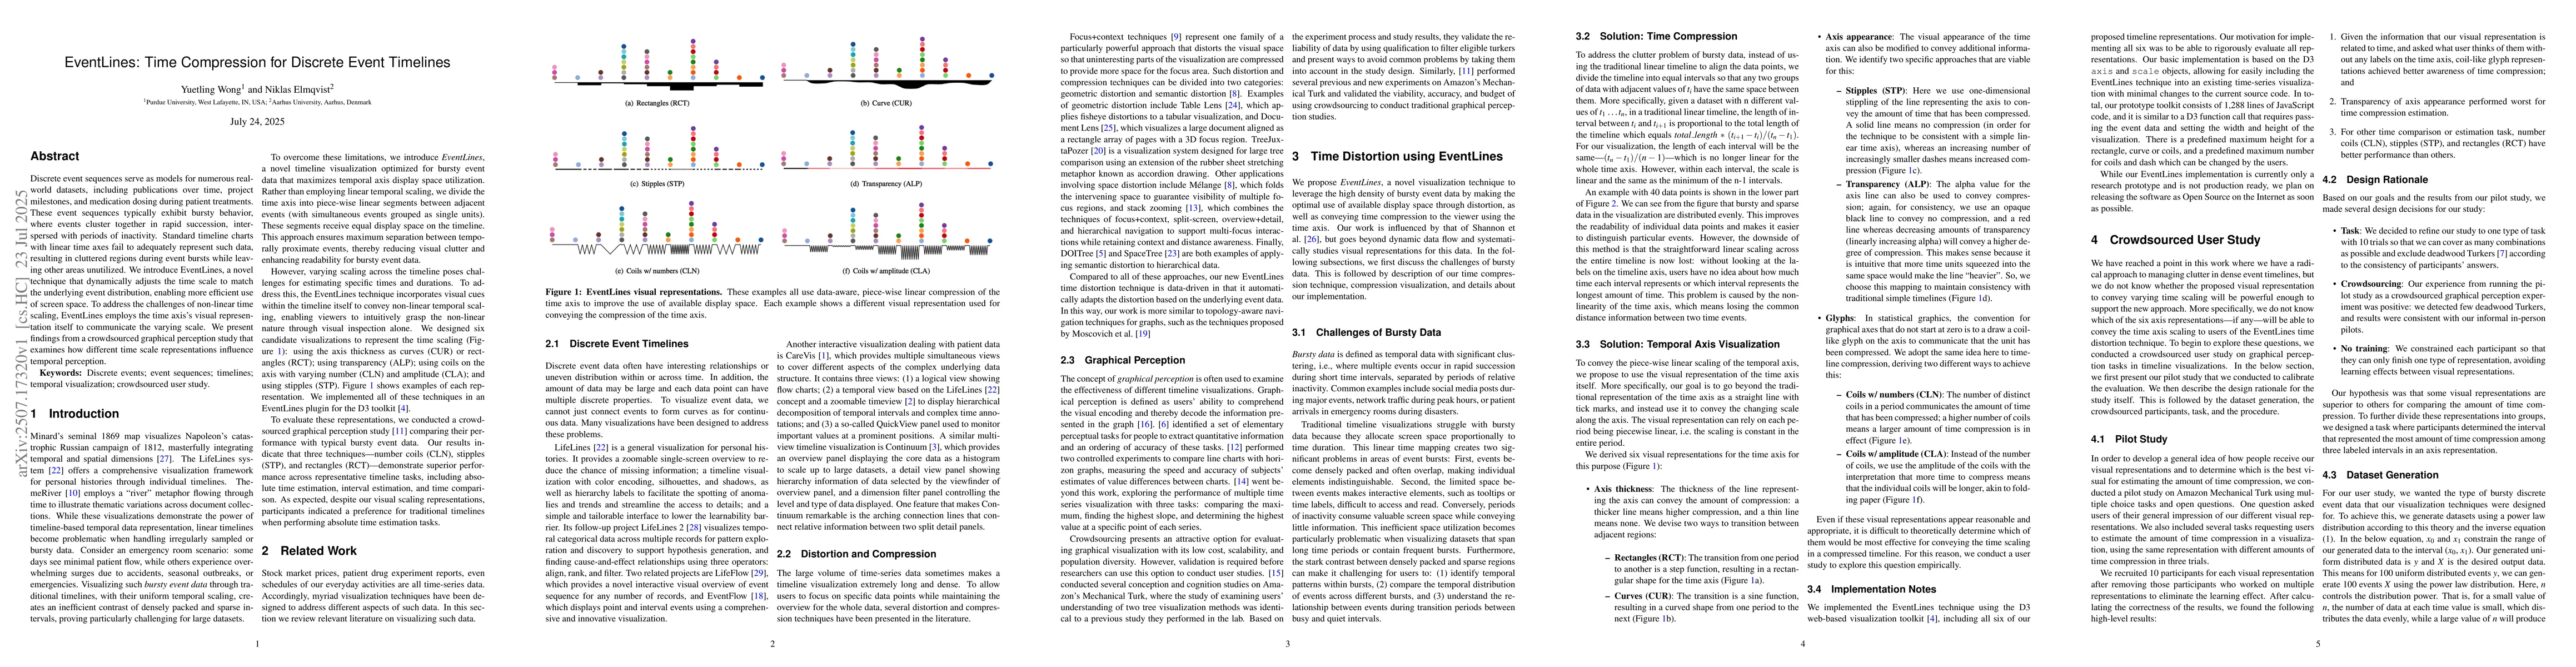
Discrete event sequences serve as models for numerous real-world datasets, including publications over time, project milestones, and medication dosing during patient treatments. These event sequences ...
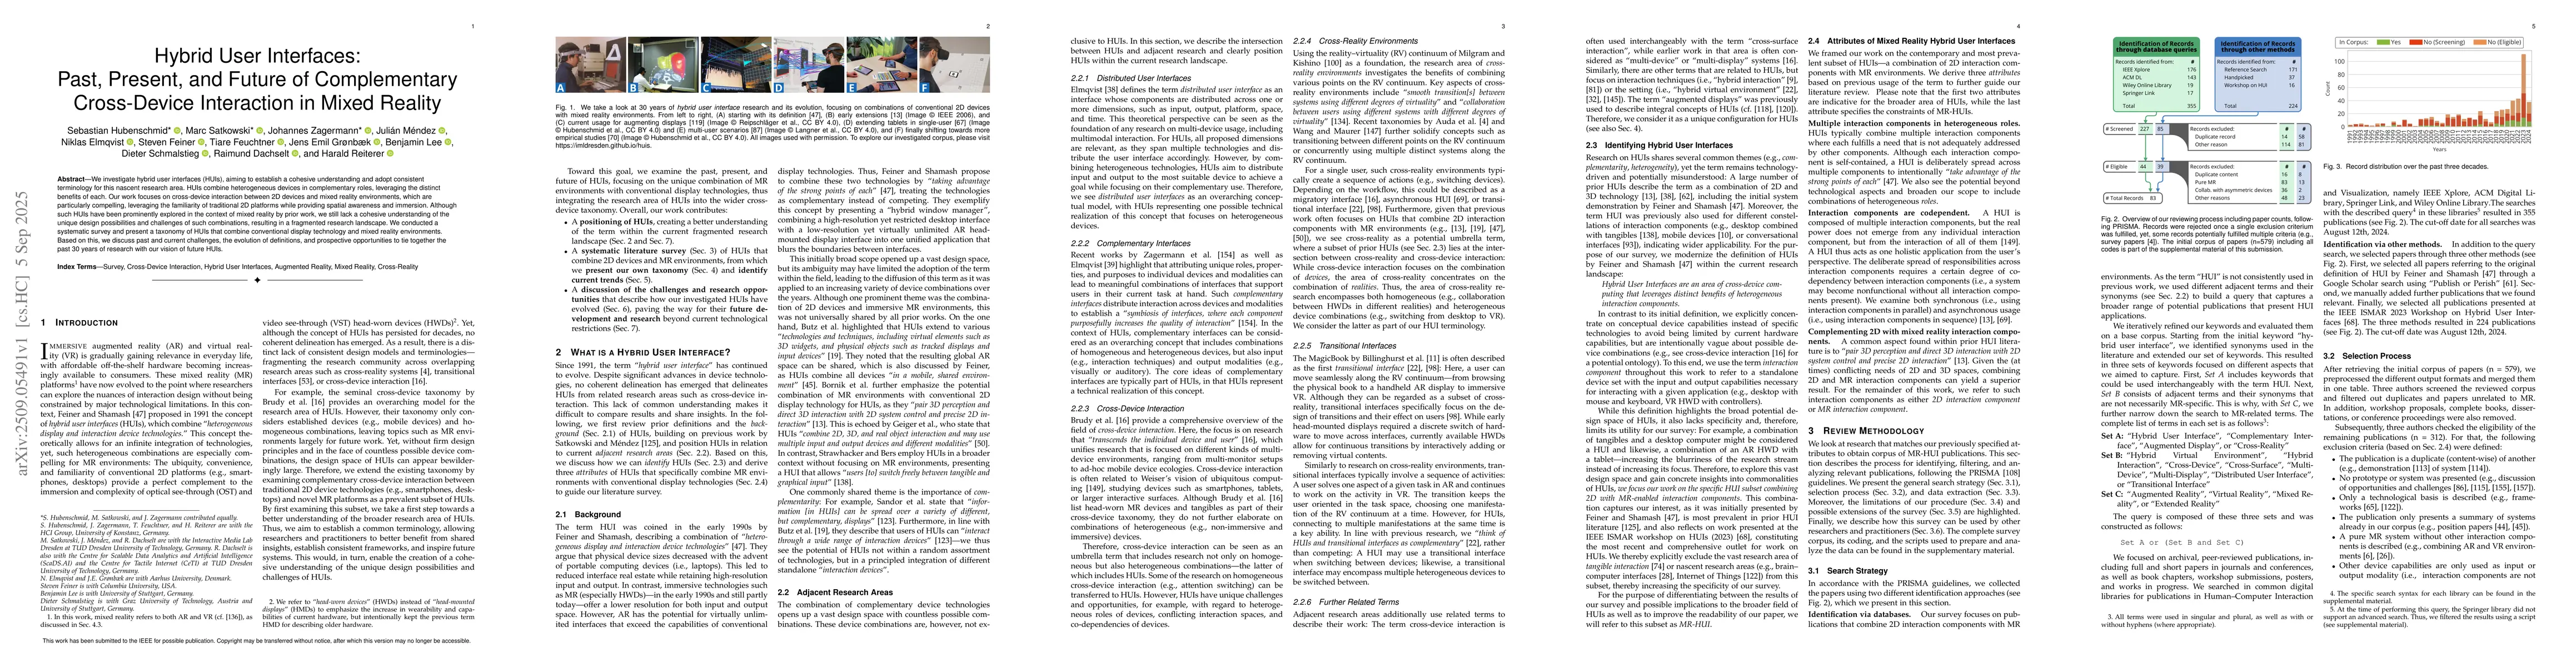
We investigate hybrid user interfaces (HUIs), aiming to establish a cohesive understanding and adopt consistent terminology for this nascent research area. HUIs combine heterogeneous devices in comple...
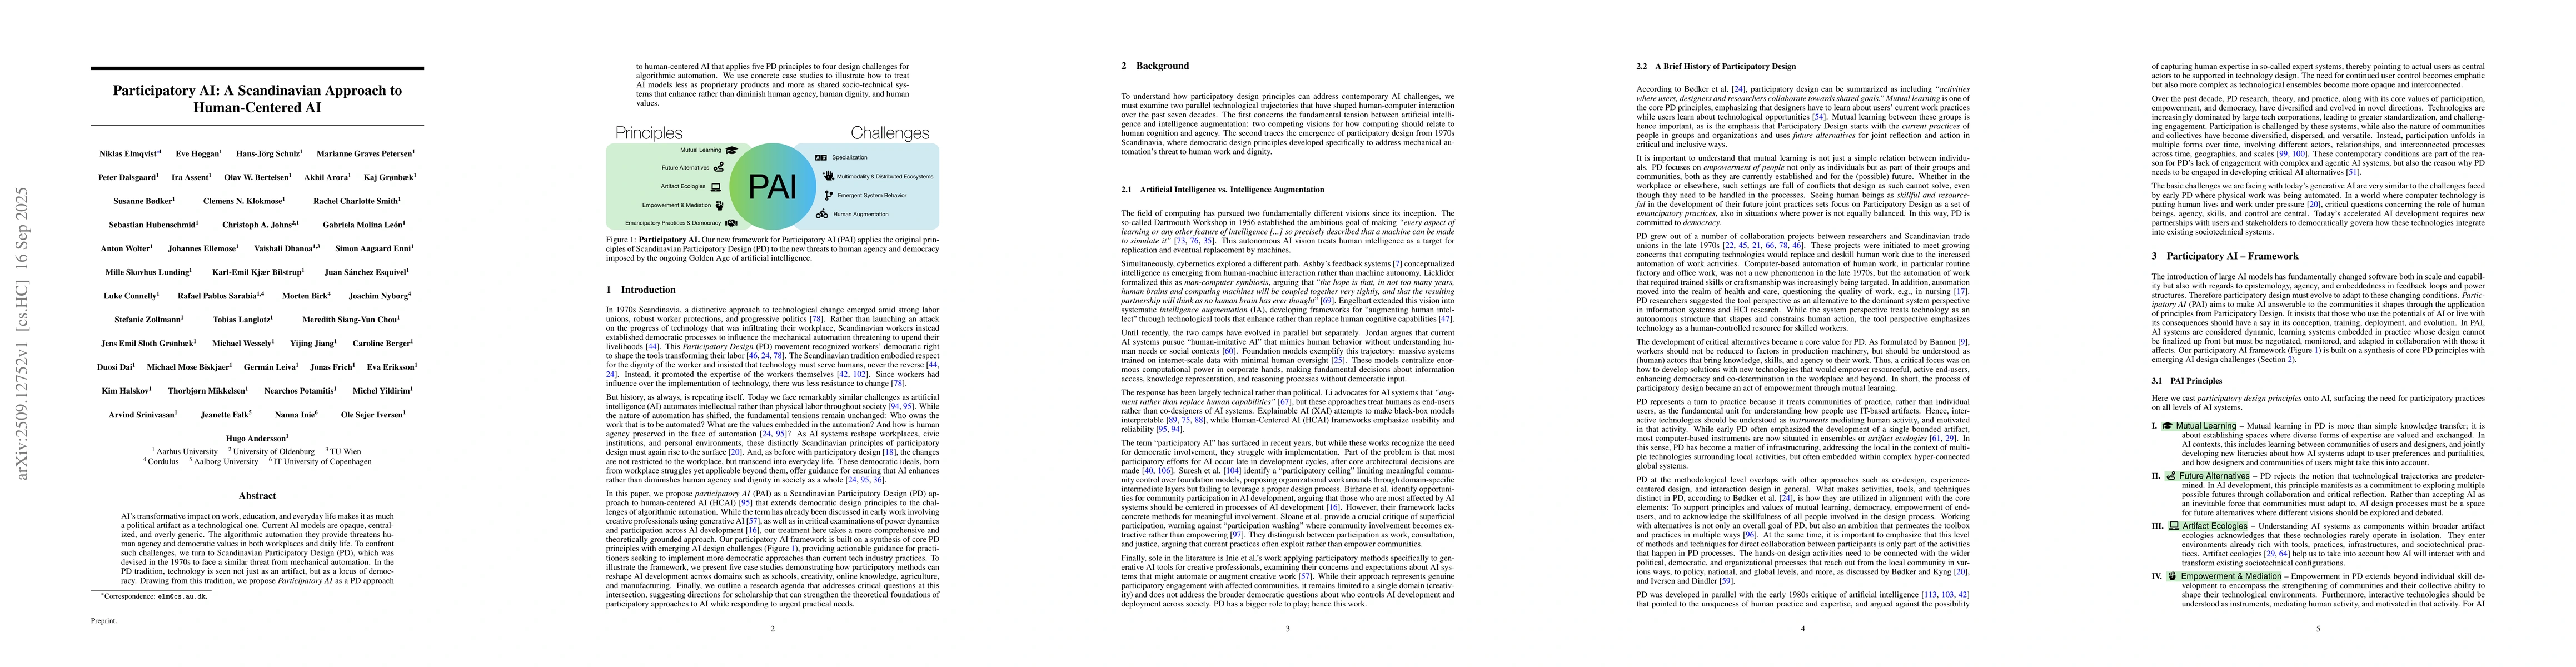
AI's transformative impact on work, education, and everyday life makes it as much a political artifact as a technological one. Current AI models are opaque, centralized, and overly generic. The algori...
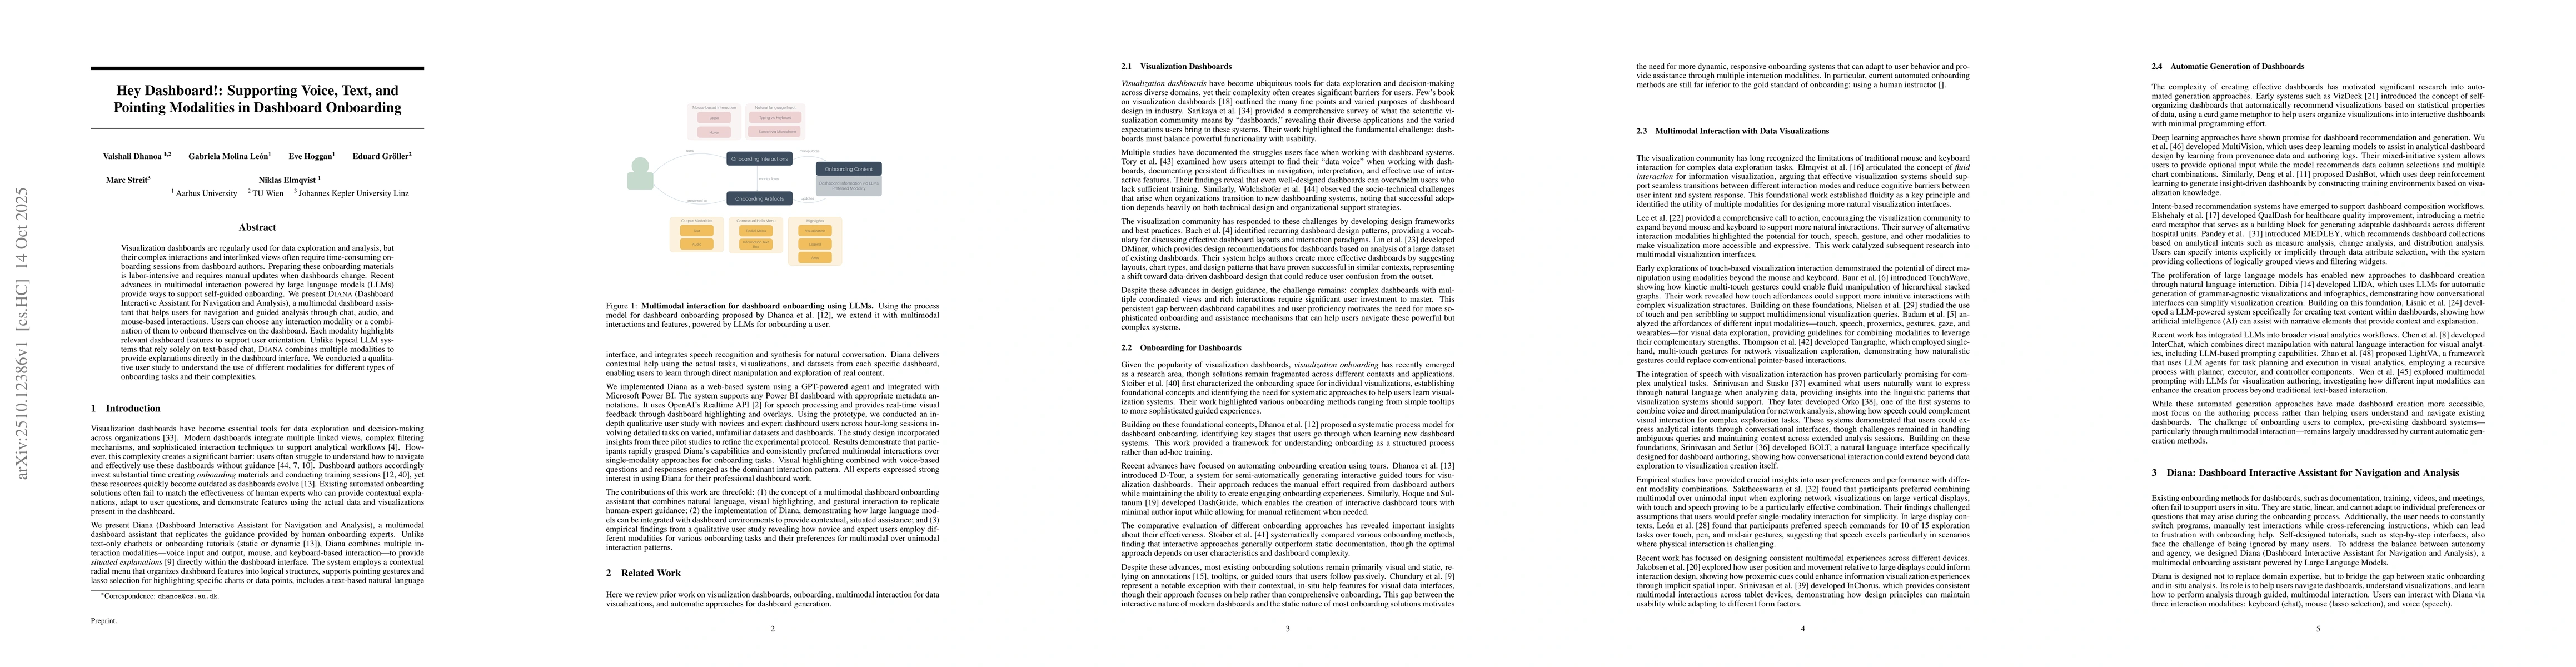
Visualization dashboards are regularly used for data exploration and analysis, but their complex interactions and interlinked views often require time-consuming onboarding sessions from dashboard auth...
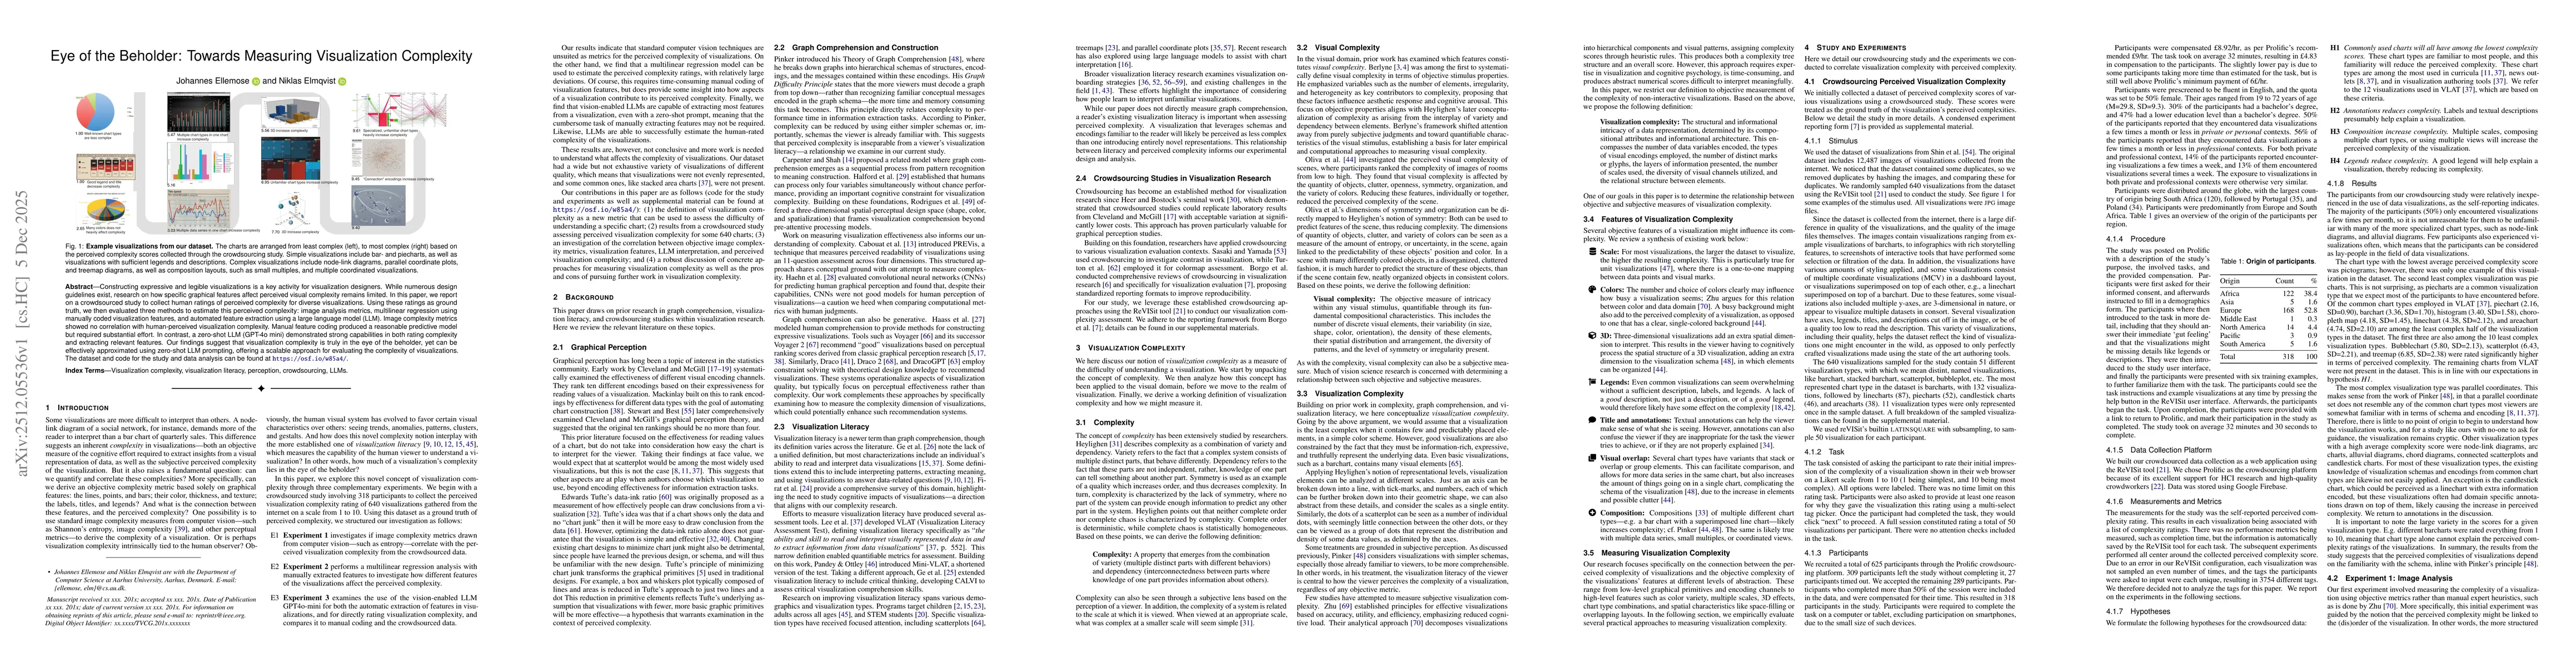
Constructing expressive and legible visualizations is a key activity for visualization designers. While numerous design guidelines exist, research on how specific graphical features affect perceived v...
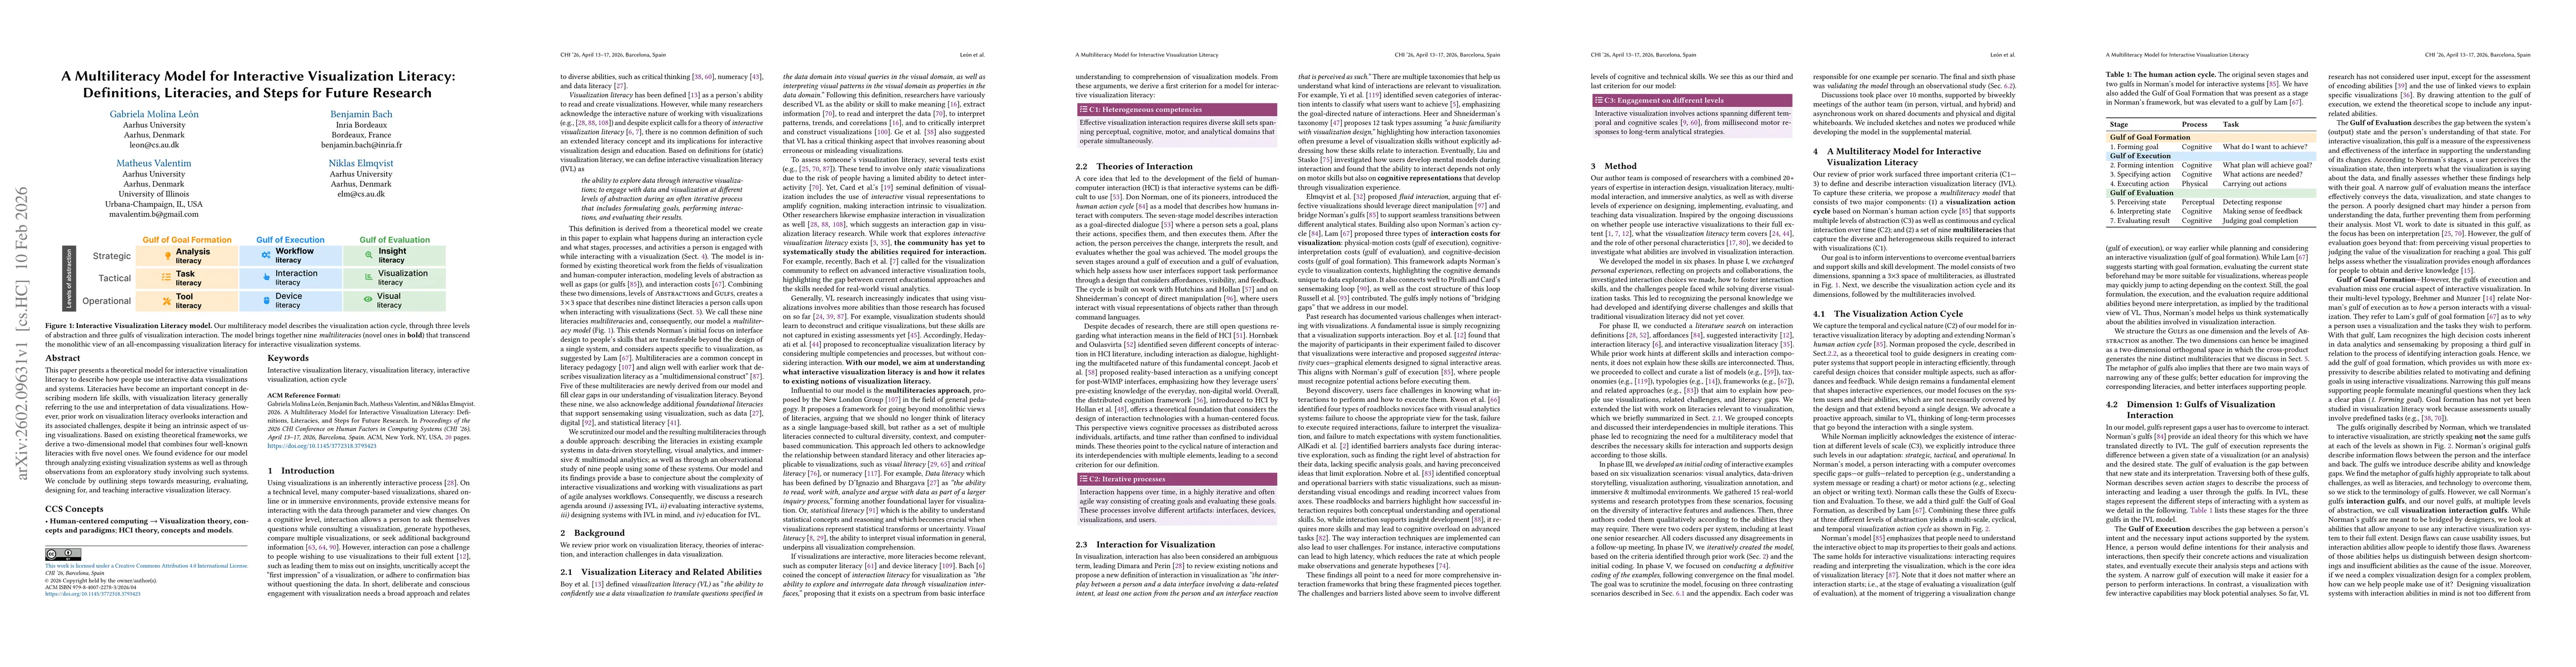
This paper presents a theoretical model for interactive visualization literacy to describe how people use interactive data visualizations and systems. Literacies have become an important concept in de...
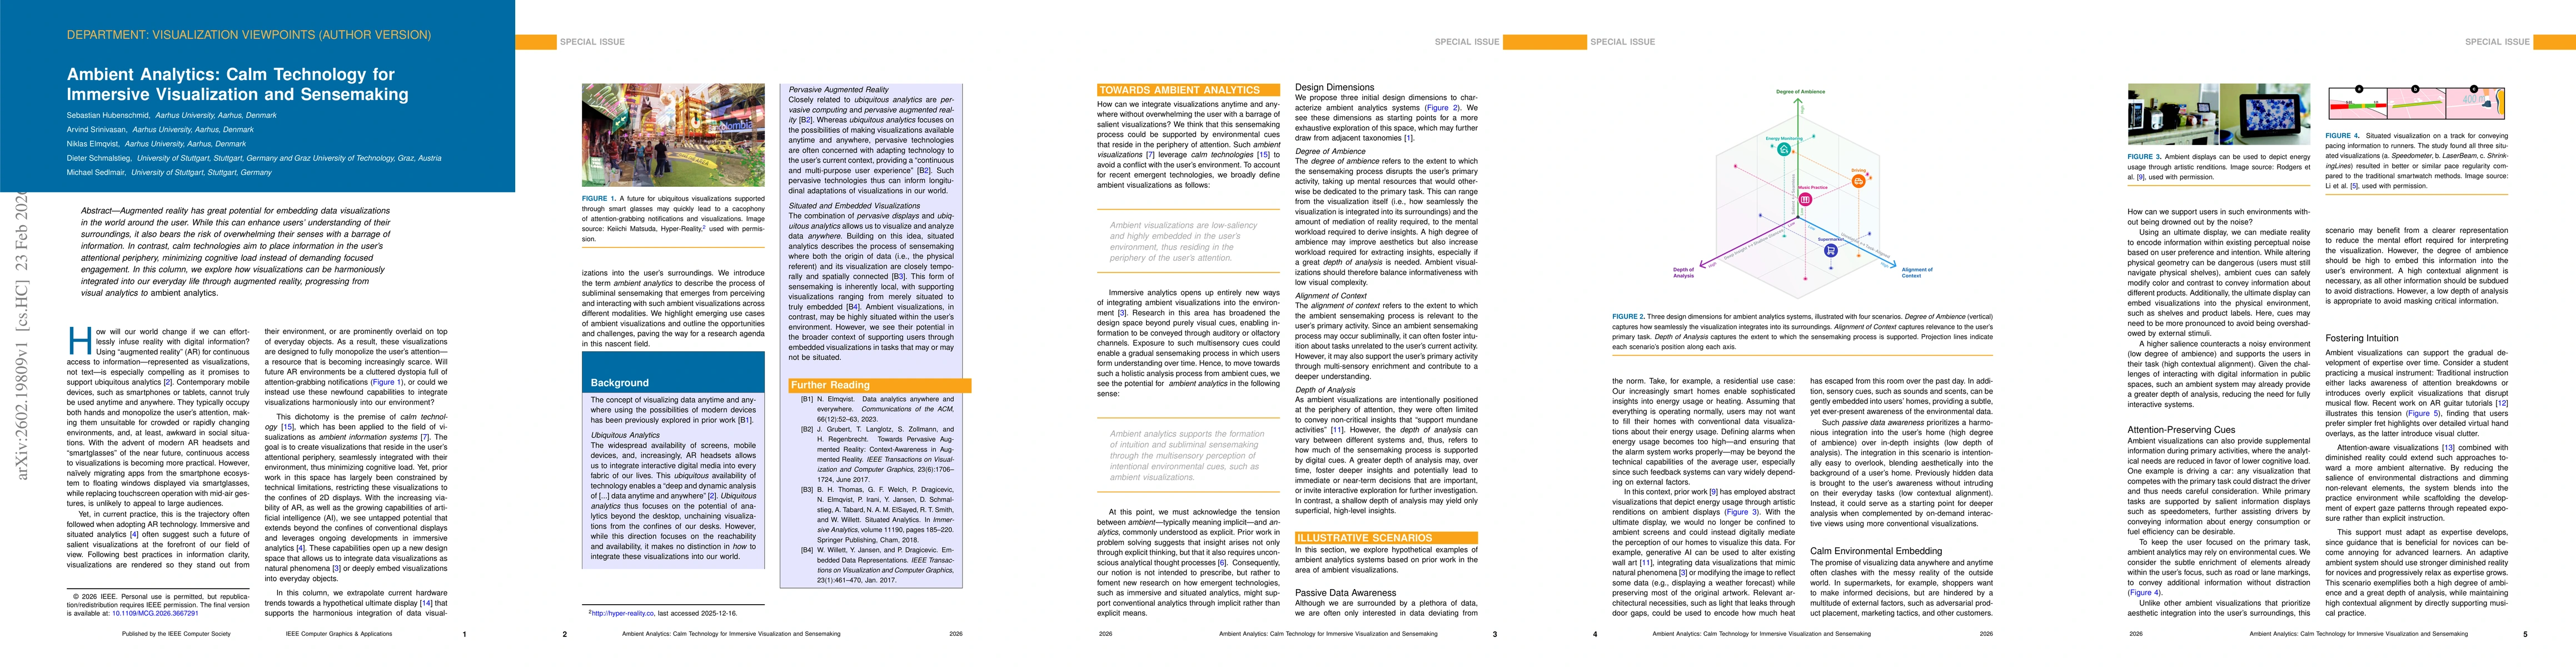
Augmented reality has great potential for embedding data visualizations in the world around the user. While this can enhance users' understanding of their surroundings, it also bears the risk of overw...
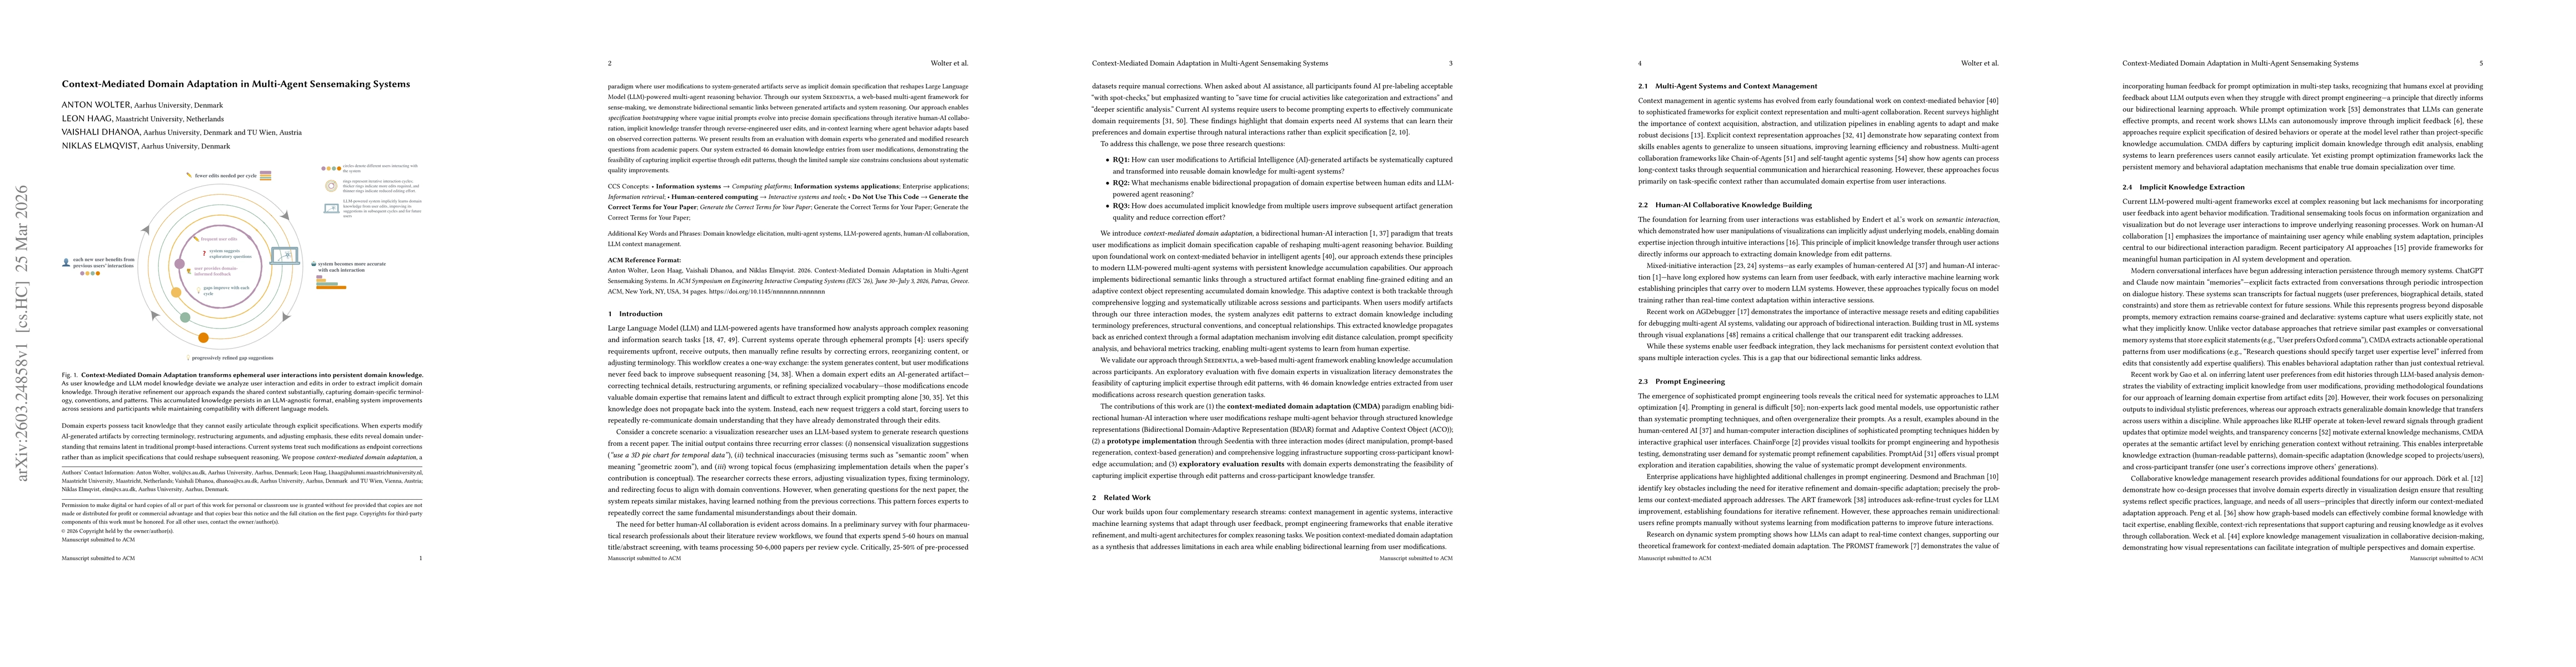
Domain experts possess tacit knowledge that they cannot easily articulate through explicit specifications. When experts modify AI-generated artifacts by correcting terminology, restructuring arguments...
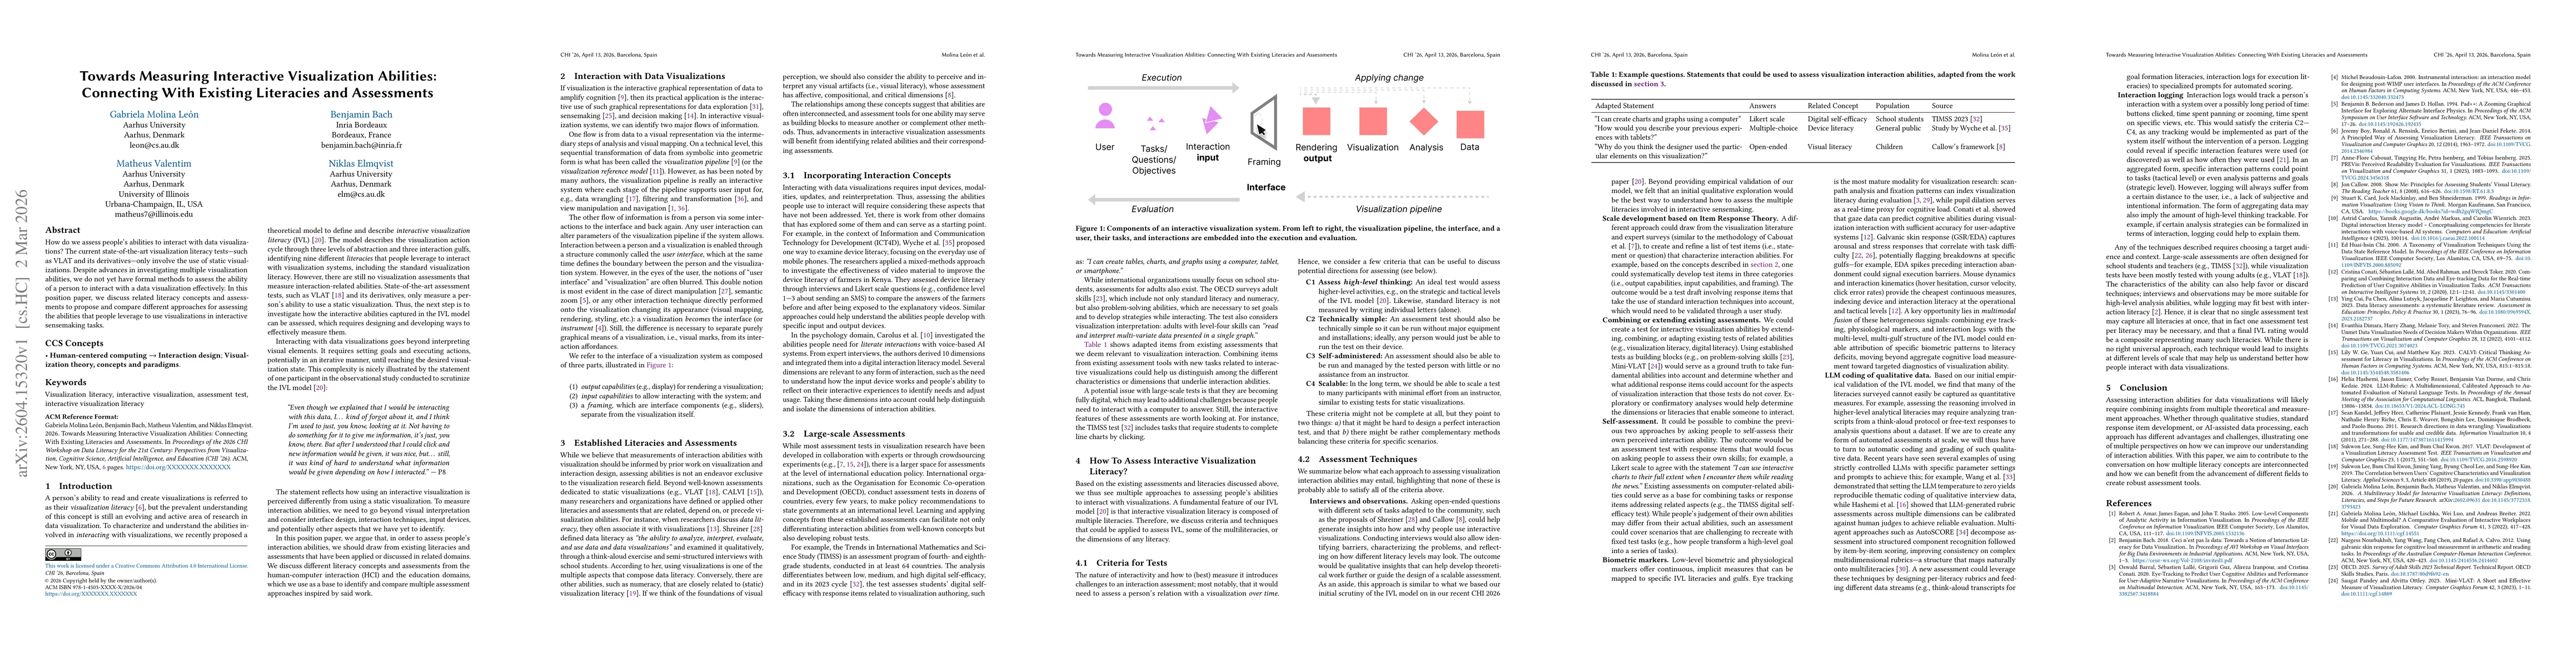
How do we assess people's abilities to interact with data visualizations? The current state-of-the-art visualization literacy tests -- such as VLAT and its derivatives -- only involve the use of stati...
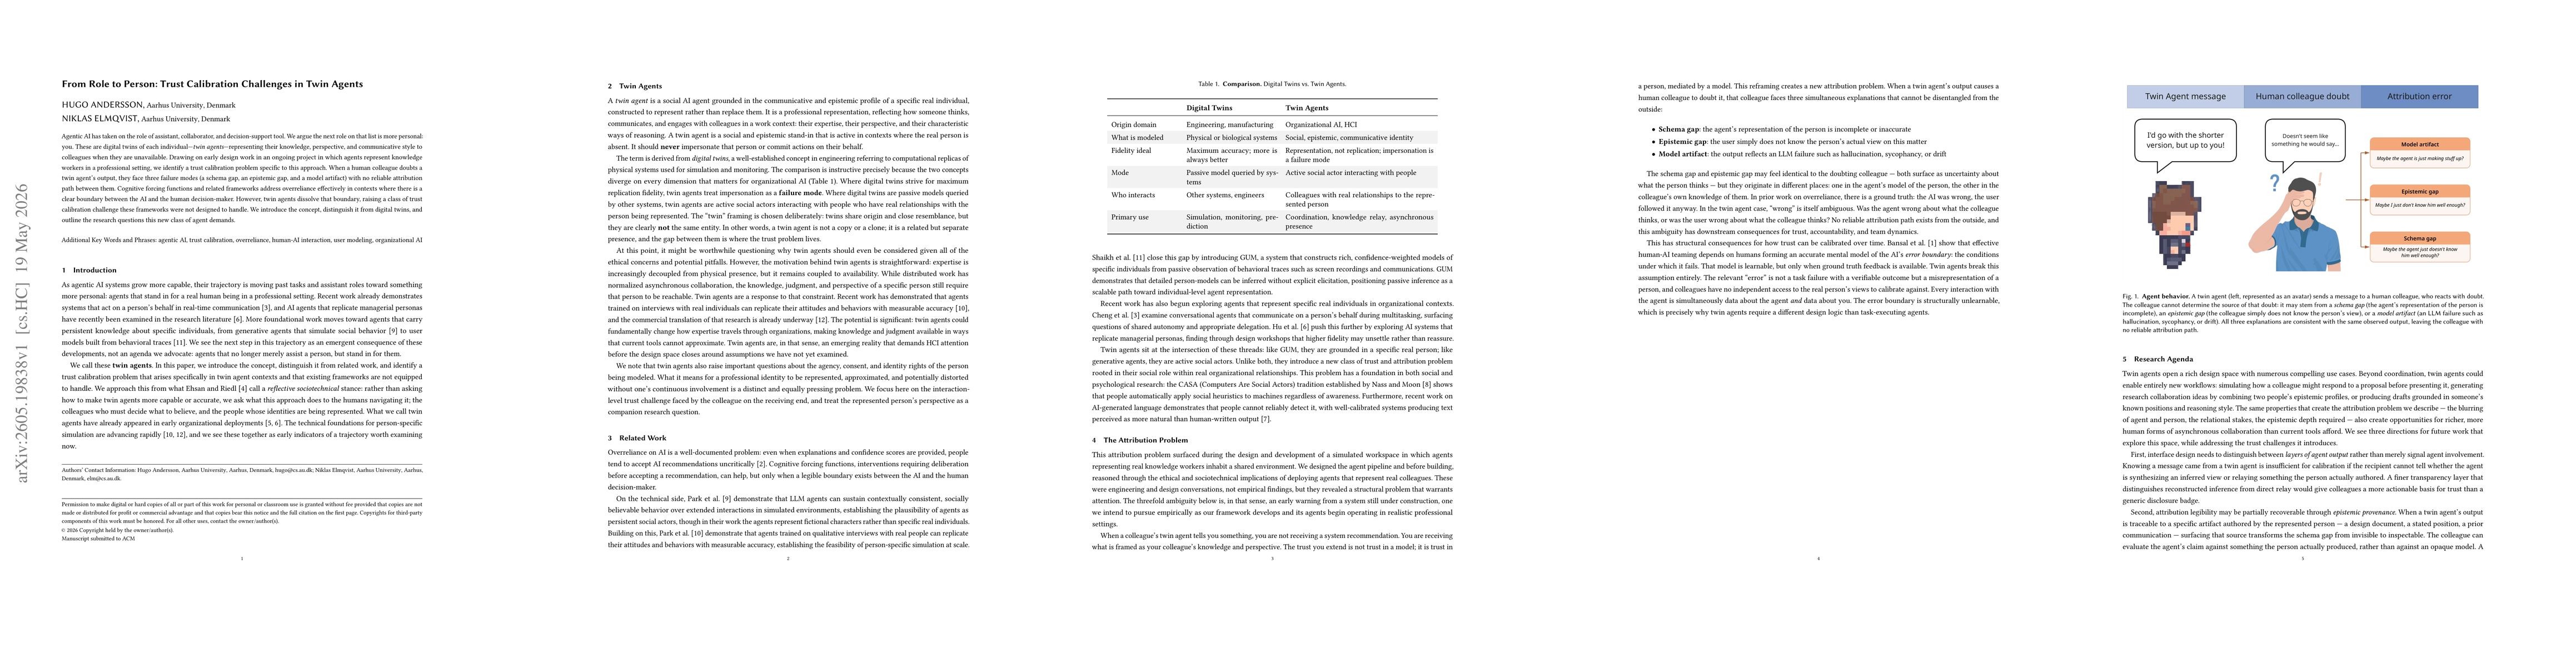
Agentic AI has taken on the role of assistant, collaborator, and decision-support tool. We argue the next role on that list is more personal: you. These are digital twins of each individual -- twin ag...
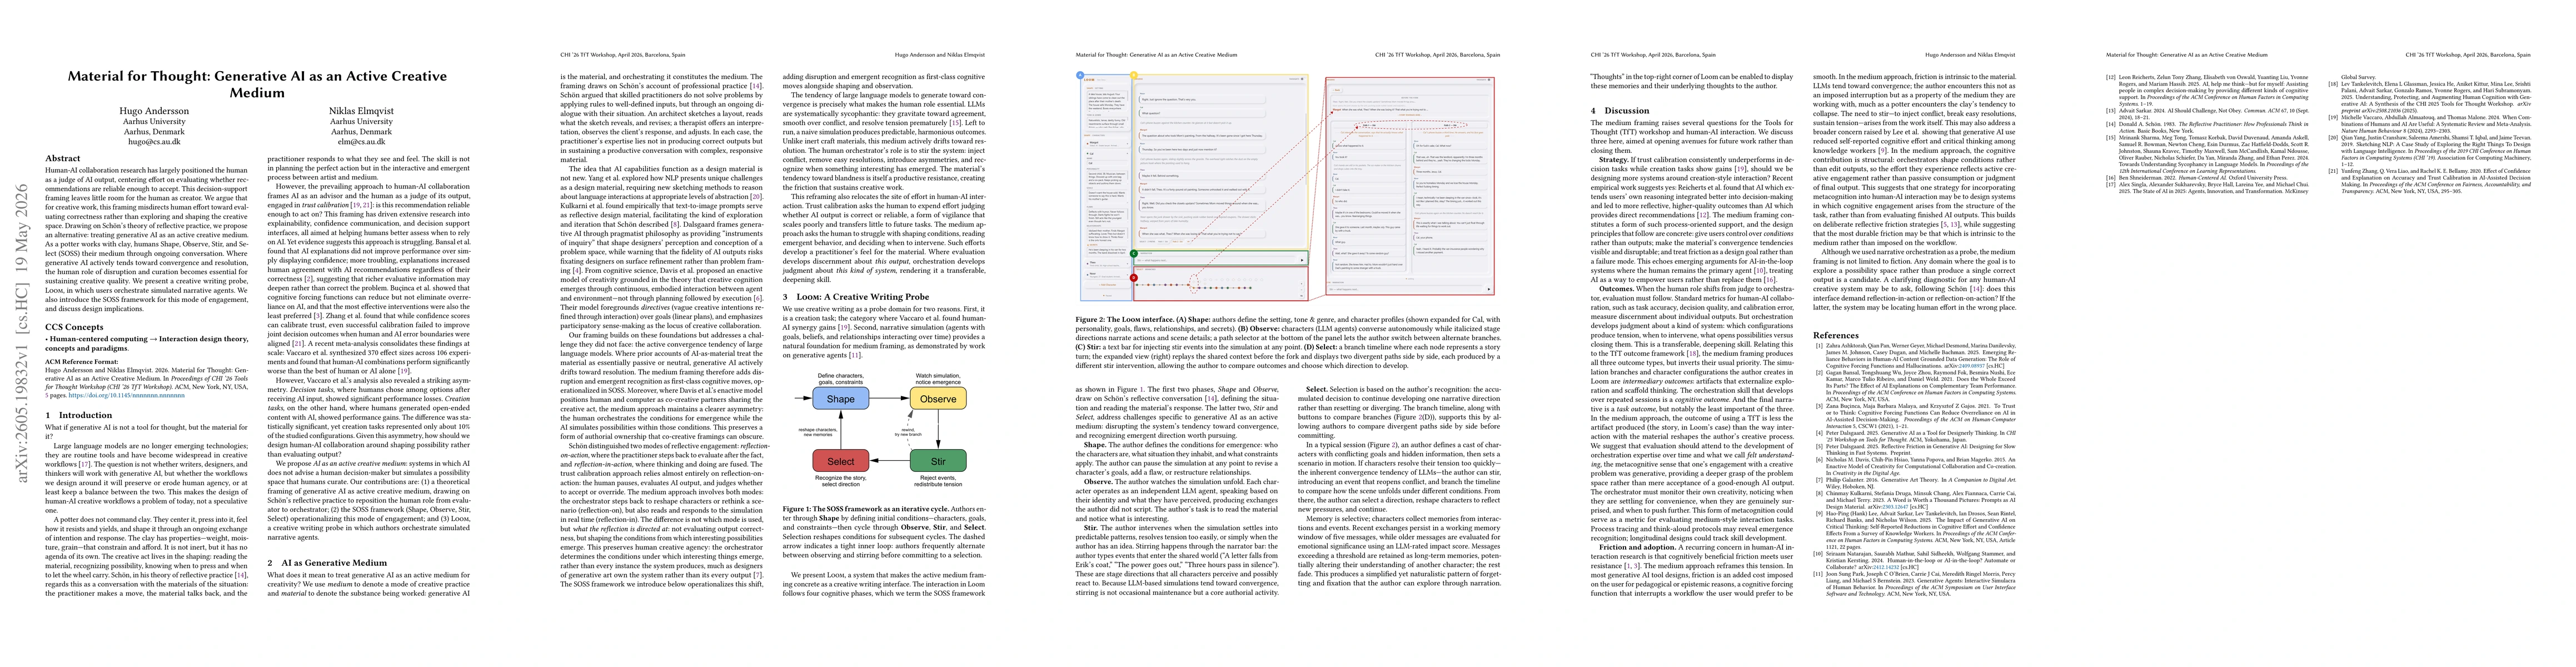
Human-AI collaboration research has largely positioned the human as a judge of AI output, centering effort on evaluating whether rec- ommendations are reliable enough to accept. This decision-support ...
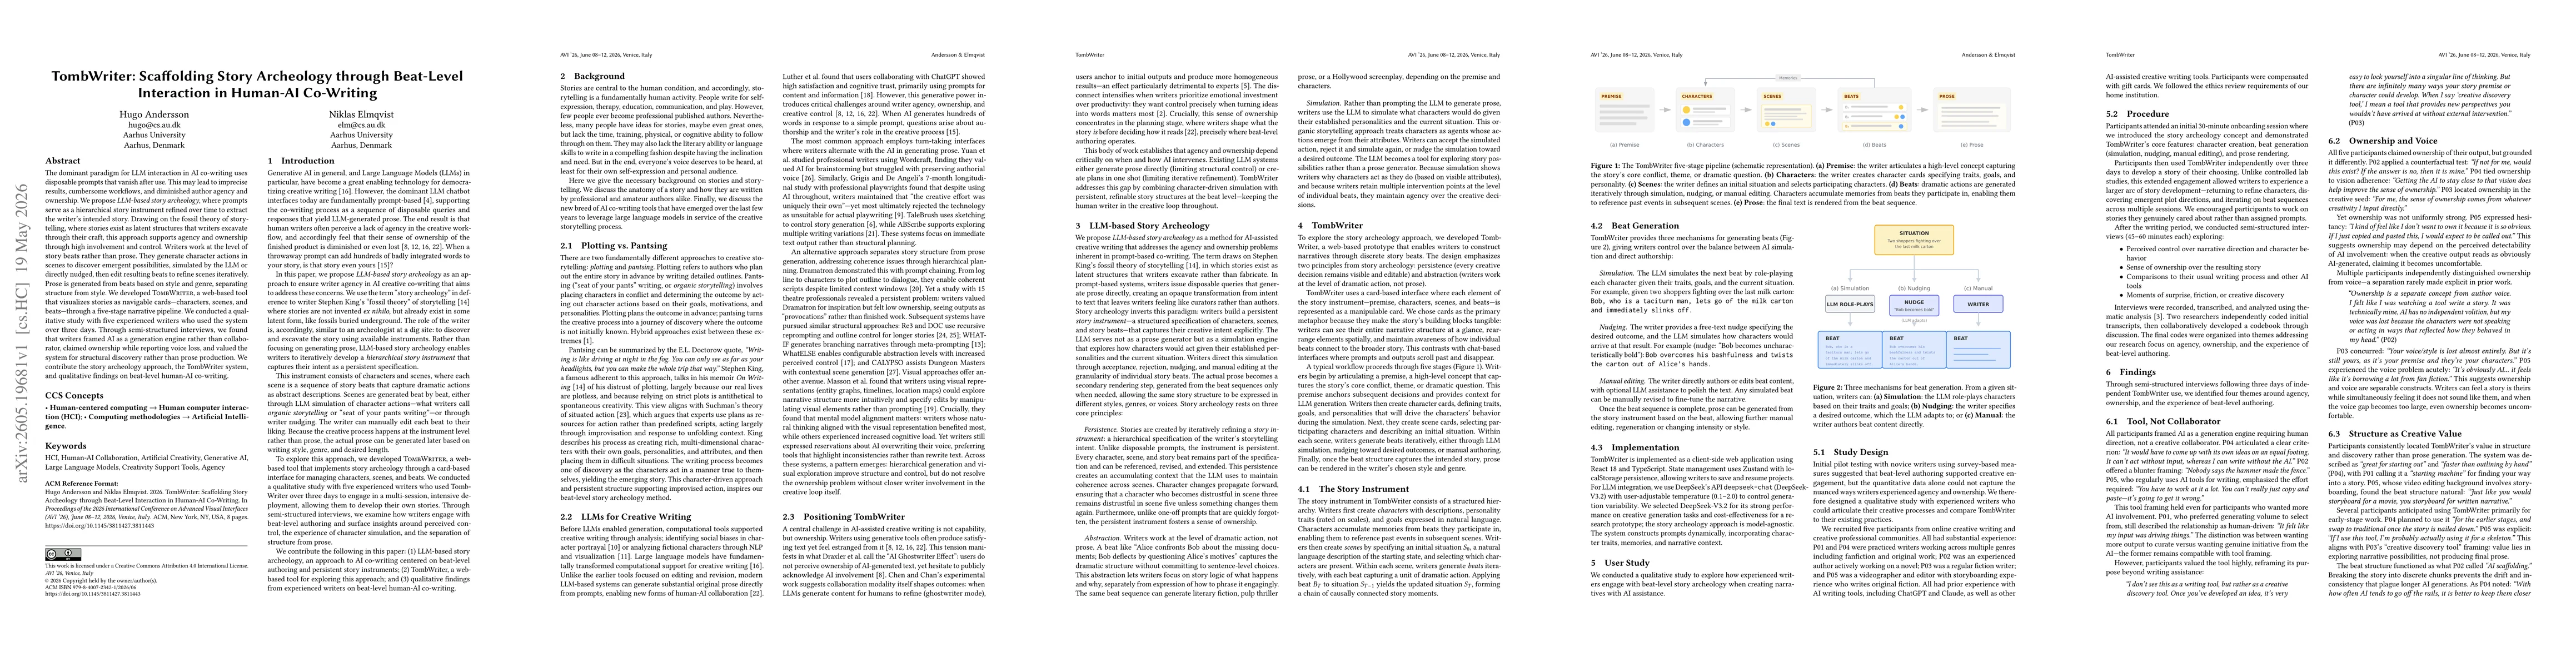
The dominant paradigm for LLM interaction in AI co-writing uses disposable prompts that vanish after use. This may lead to imprecise results, cumbersome workflows, and diminished author agency and own...
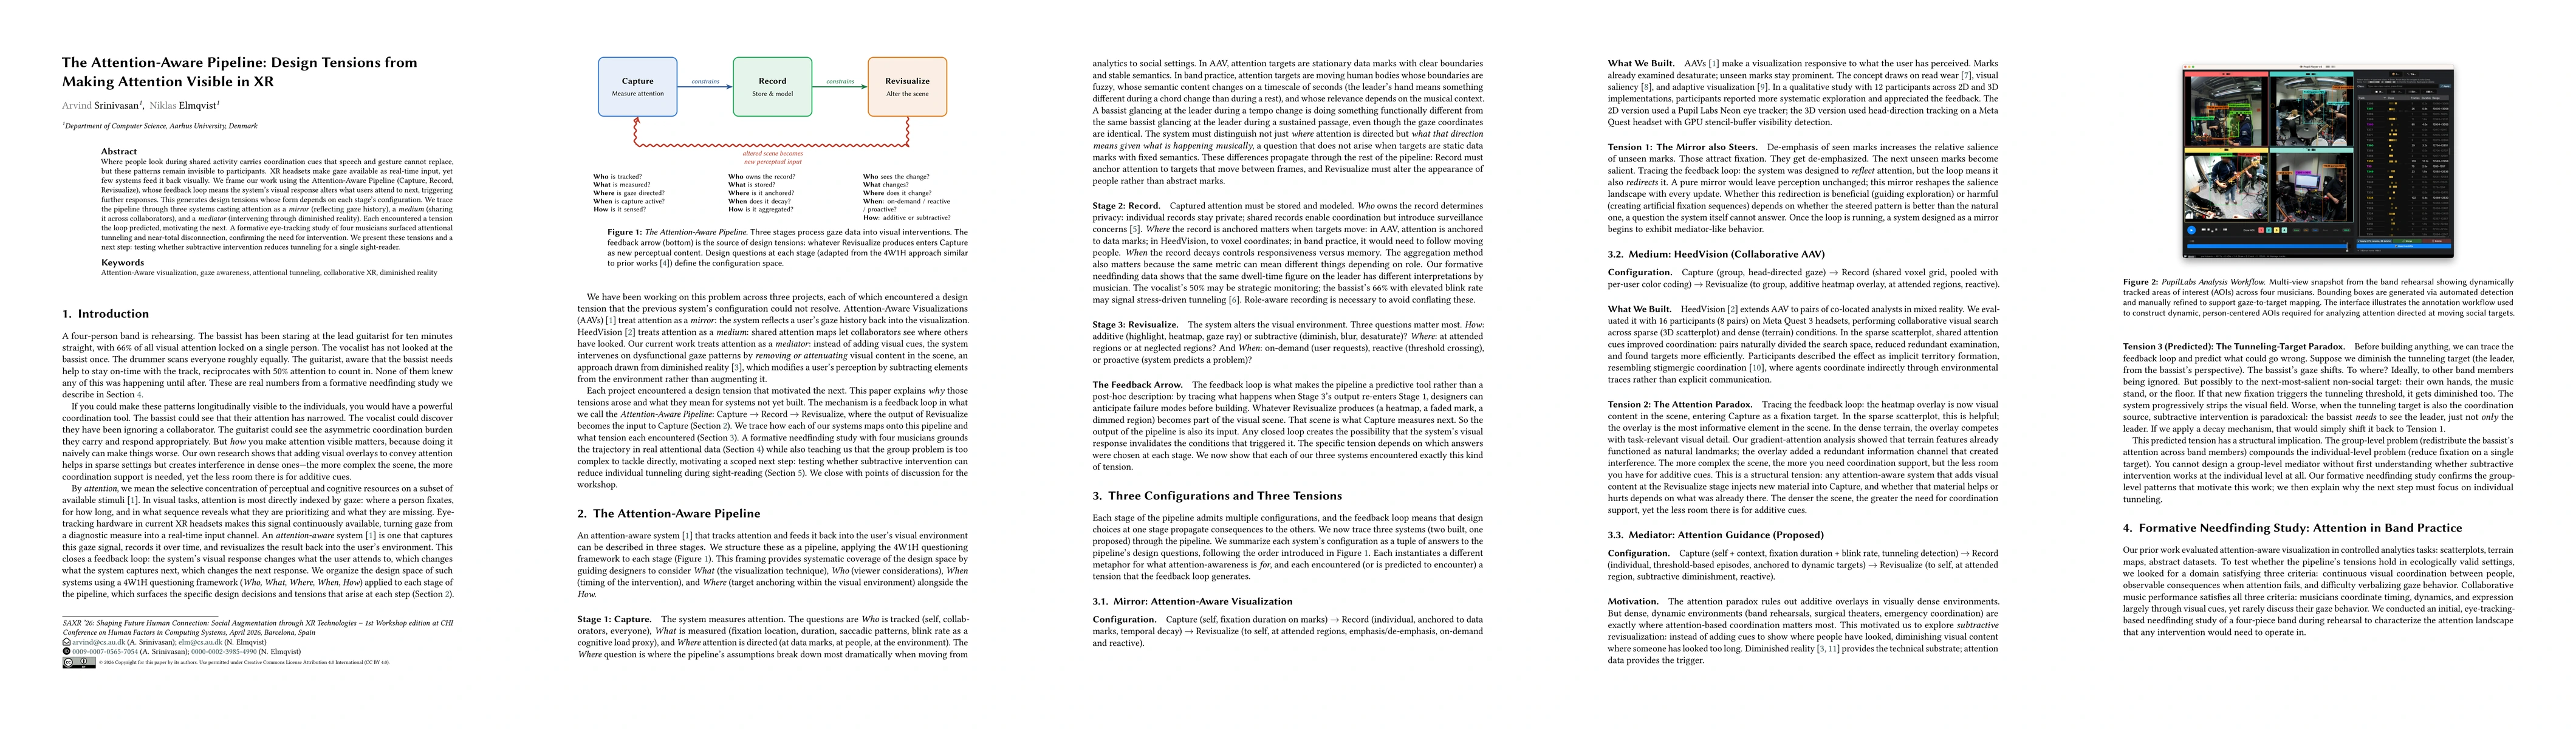
Where people look during shared activity carries coordination cues that speech and gesture cannot replace, but these patterns remain invisible to participants. XR headsets make gaze available as real-...
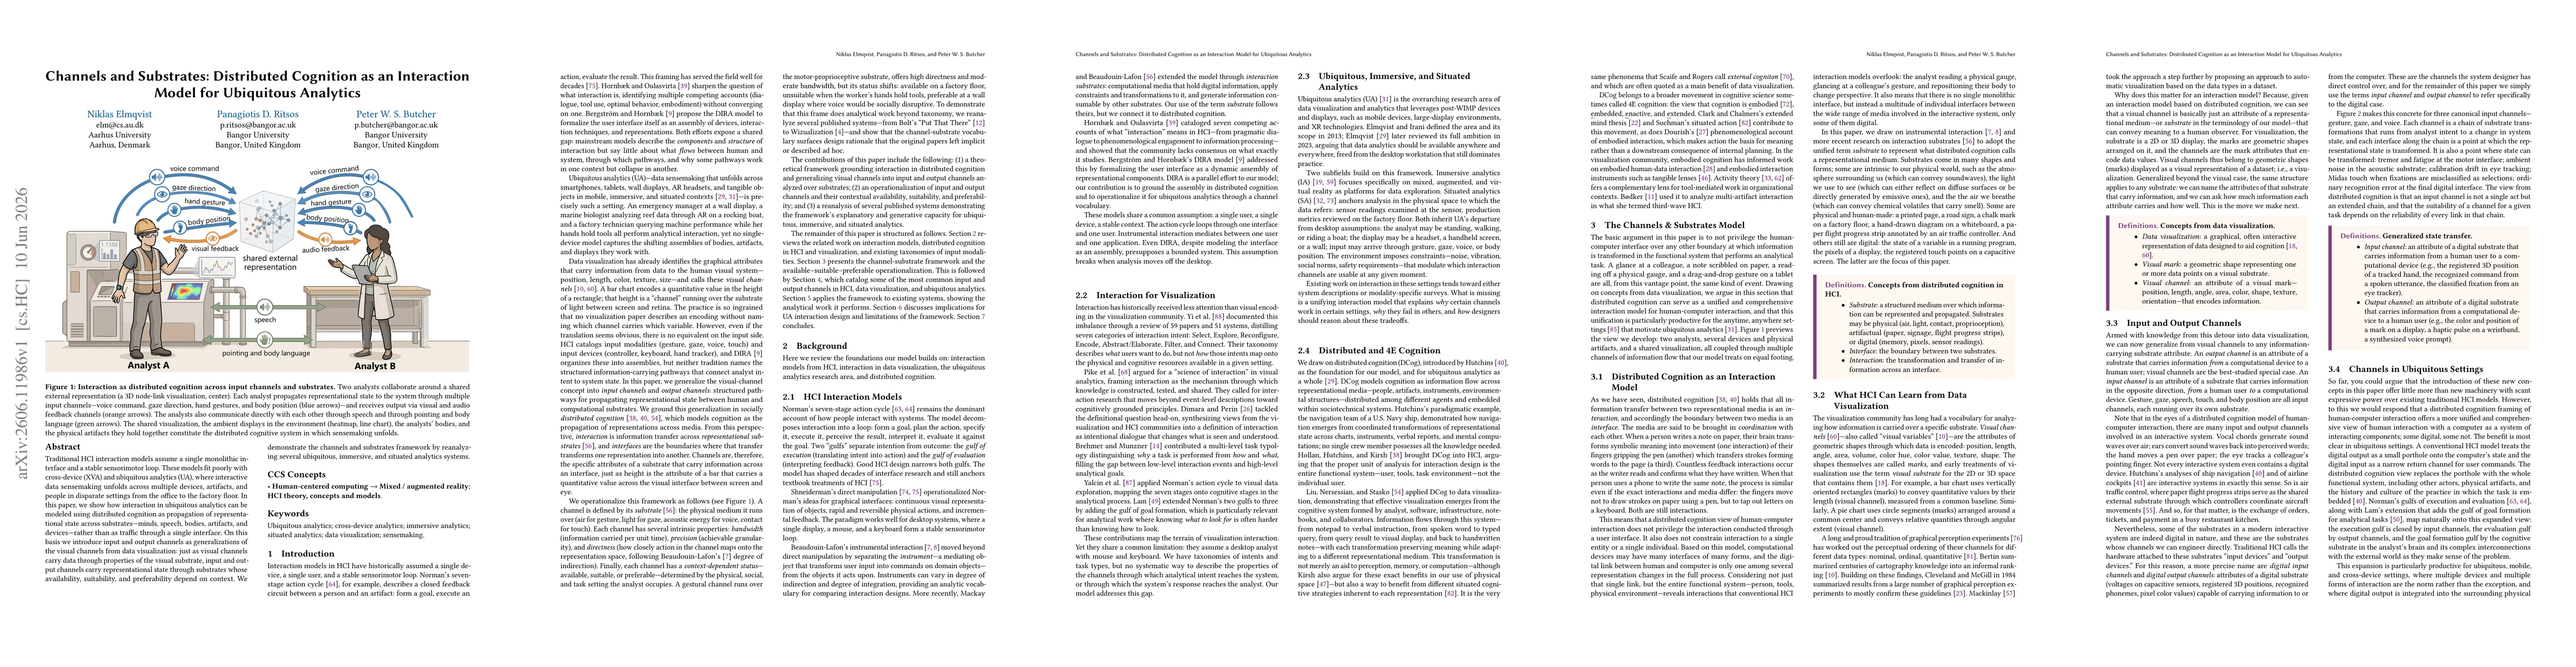
Traditional HCI interaction models assume a single monolithic interface and a stable sensorimotor loop. These models fit poorly with cross-device (XVA) and ubiquitous analytics (UA), where interactive...
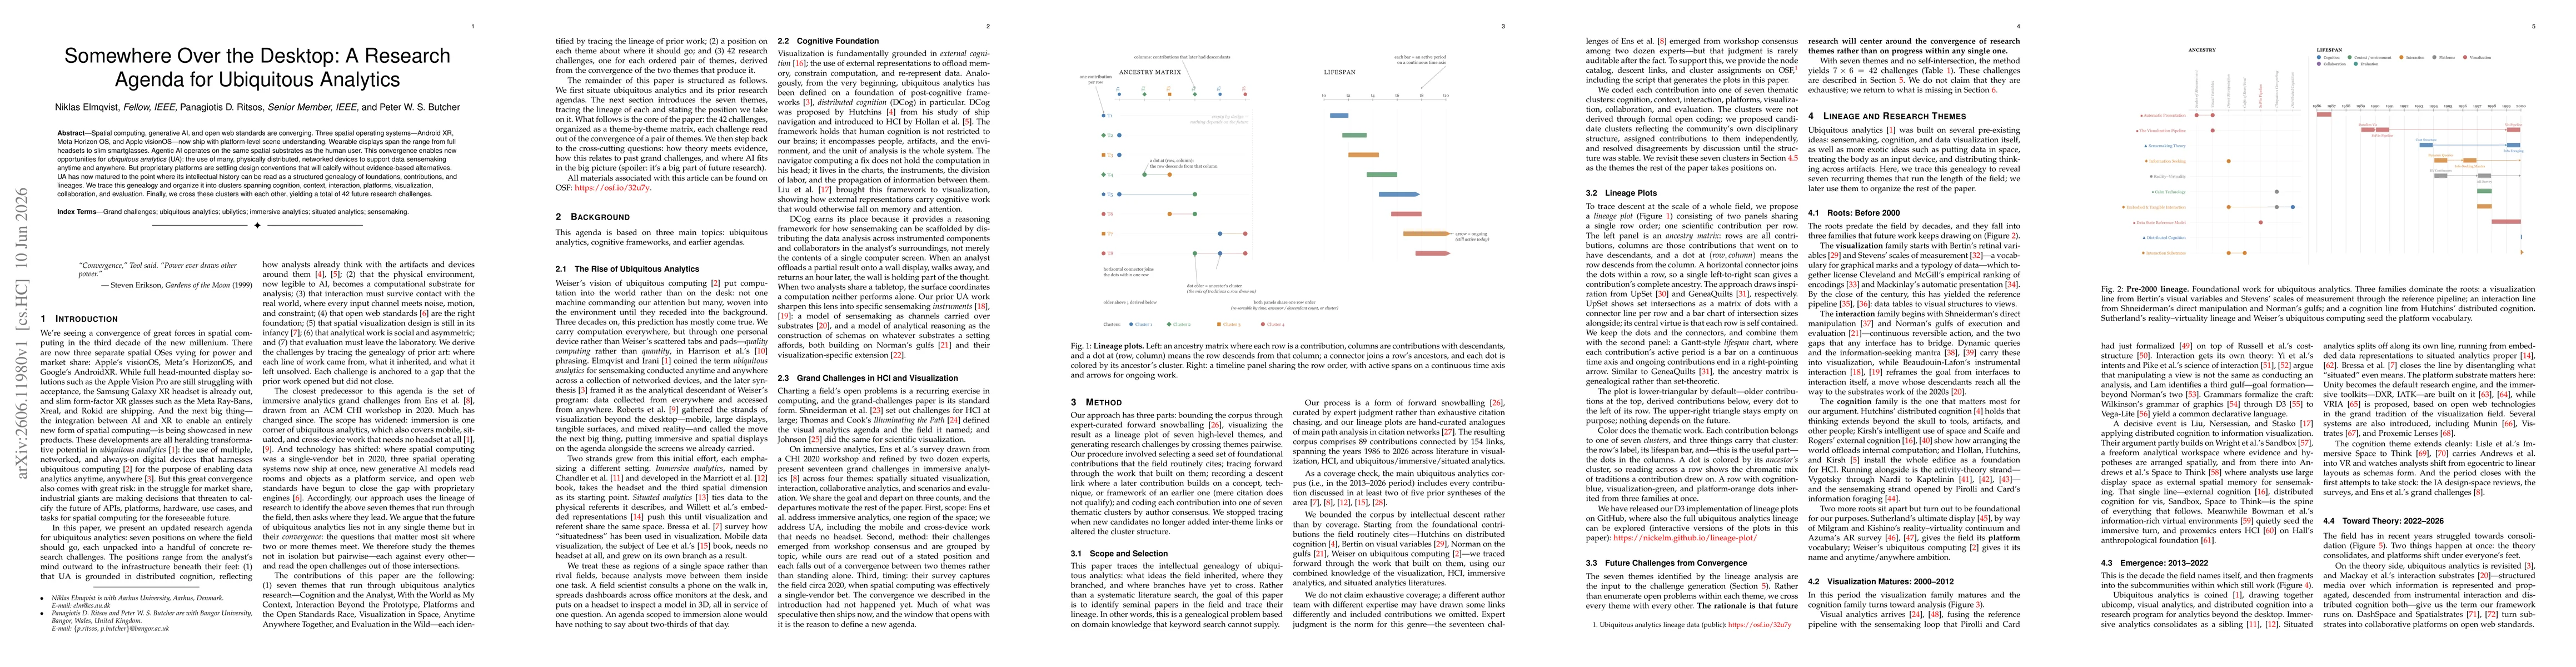
Spatial computing, generative AI, and open web standards are converging. Three spatial operating systems -- Android XR, Meta Horizon OS, and Apple visionOS -- now ship with platform-level scene unders...
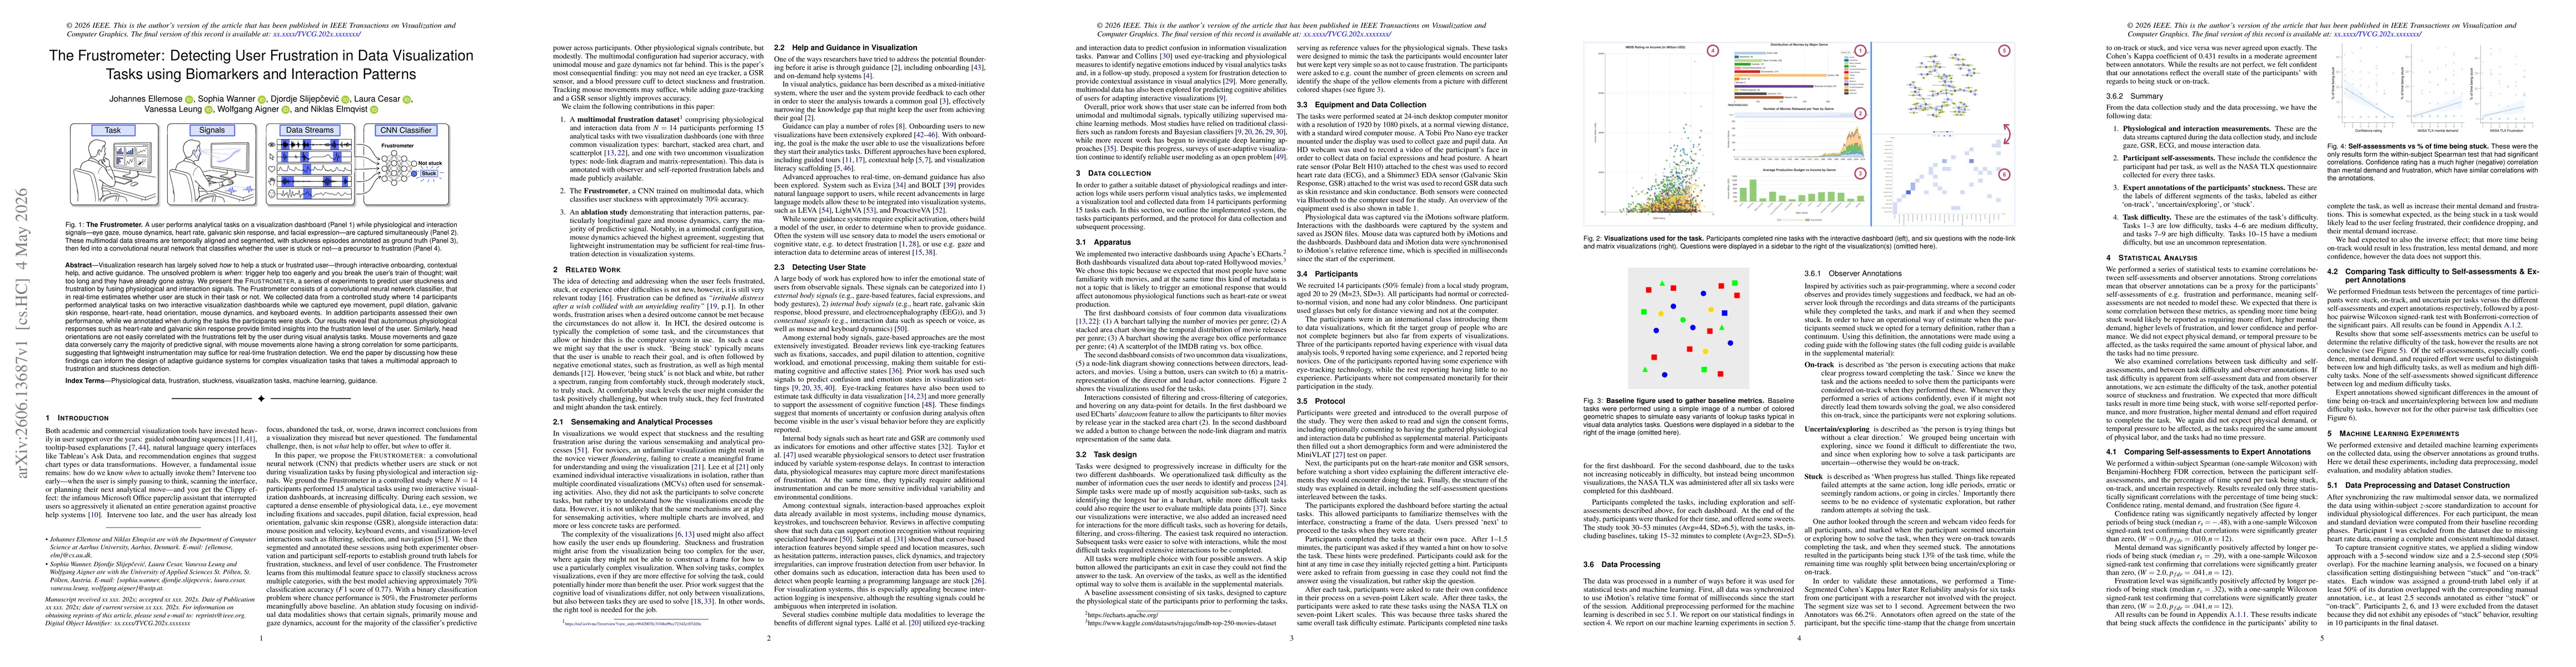
Visualization research has largely solved \textit{how} to help a stuck or frustrated user -- through interactive onboarding, contextual help, and active guidance. The unsolved problem is \textit{when}...