Publication
Metrics
AI Quick Summary
Gatherplots are a novel scatterplot extension designed to tackle overplotting issues in multidimensional data visualization, maintaining individual data point identities while forming packed entities to enhance visual perception. A crowdsourced study demonstrated that gatherplots allow for quicker and more accurate data distribution assessment compared to traditional jittered scatterplots.
Paper Preview
Abstract
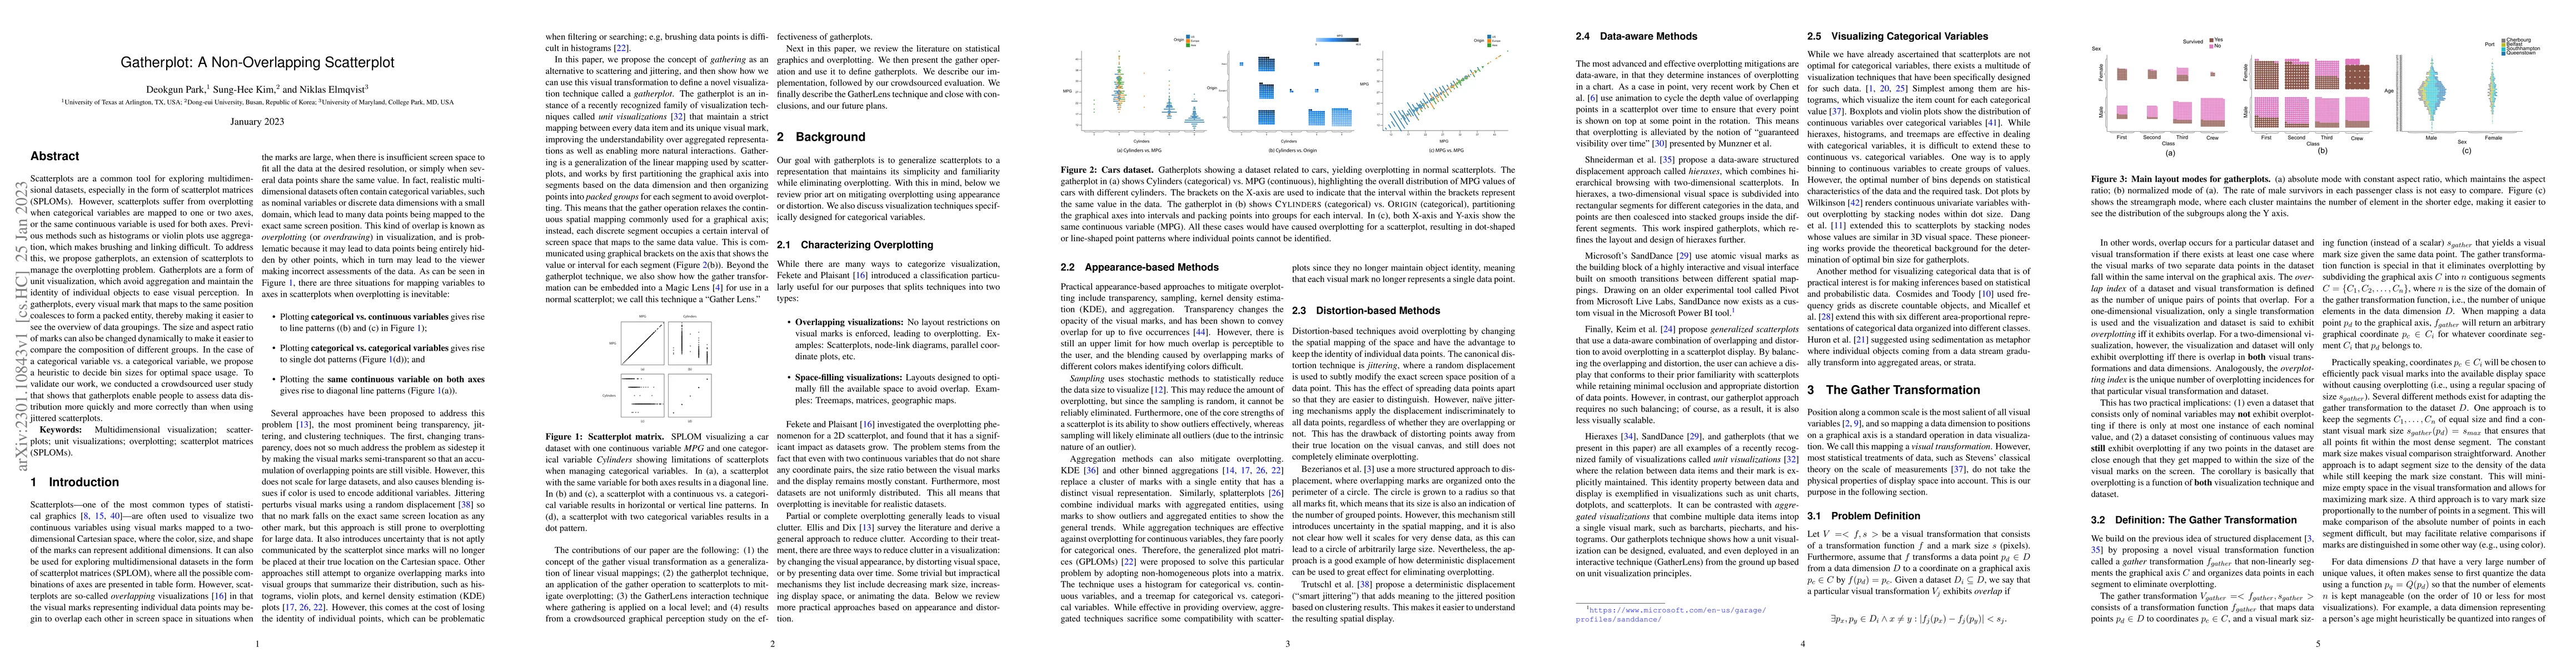
Scatterplots are a common tool for exploring multidimensional datasets, especially in the form of scatterplot matrices (SPLOMs). However, scatterplots suffer from overplotting when categorical variables are mapped to one or two axes, or the same continuous variable is used for both axes. Previous methods such as histograms or violin plots use aggregation, which makes brushing and linking difficult. To address this, we propose gatherplots, an extension of scatterplots to manage the overplotting problem. Gatherplots are a form of unit visualization, which avoid aggregation and maintain the identity of individual objects to ease visual perception. In gatherplots, every visual mark that maps to the same position coalesces to form a packed entity, thereby making it easier to see the overview of data groupings. The size and aspect ratio of marks can also be changed dynamically to make it easier to compare the composition of different groups. In the case of a categorical variable vs. a categorical variable, we propose a heuristic to decide bin sizes for optimal space usage. To validate our work, we conducted a crowdsourced user study that shows that gatherplots enable people to assess data distribution more quickly and more correctly than when using jittered scatterplots.
AI Key Findings
Get AI-generated insights about this paper's methodology, results, significance, and more — seven facets brought into focus.
Impact
Paper Details
Authors
PDF Preview
Key Terms
Citation Network
Current paper (gray), citations (green), references (blue)
Display is limited for performance on very large graphs.
Discussion 0