Gatherplots: Generalized Scatterplots for Nominal Data
Publication
Metrics
Paper Preview
Abstract
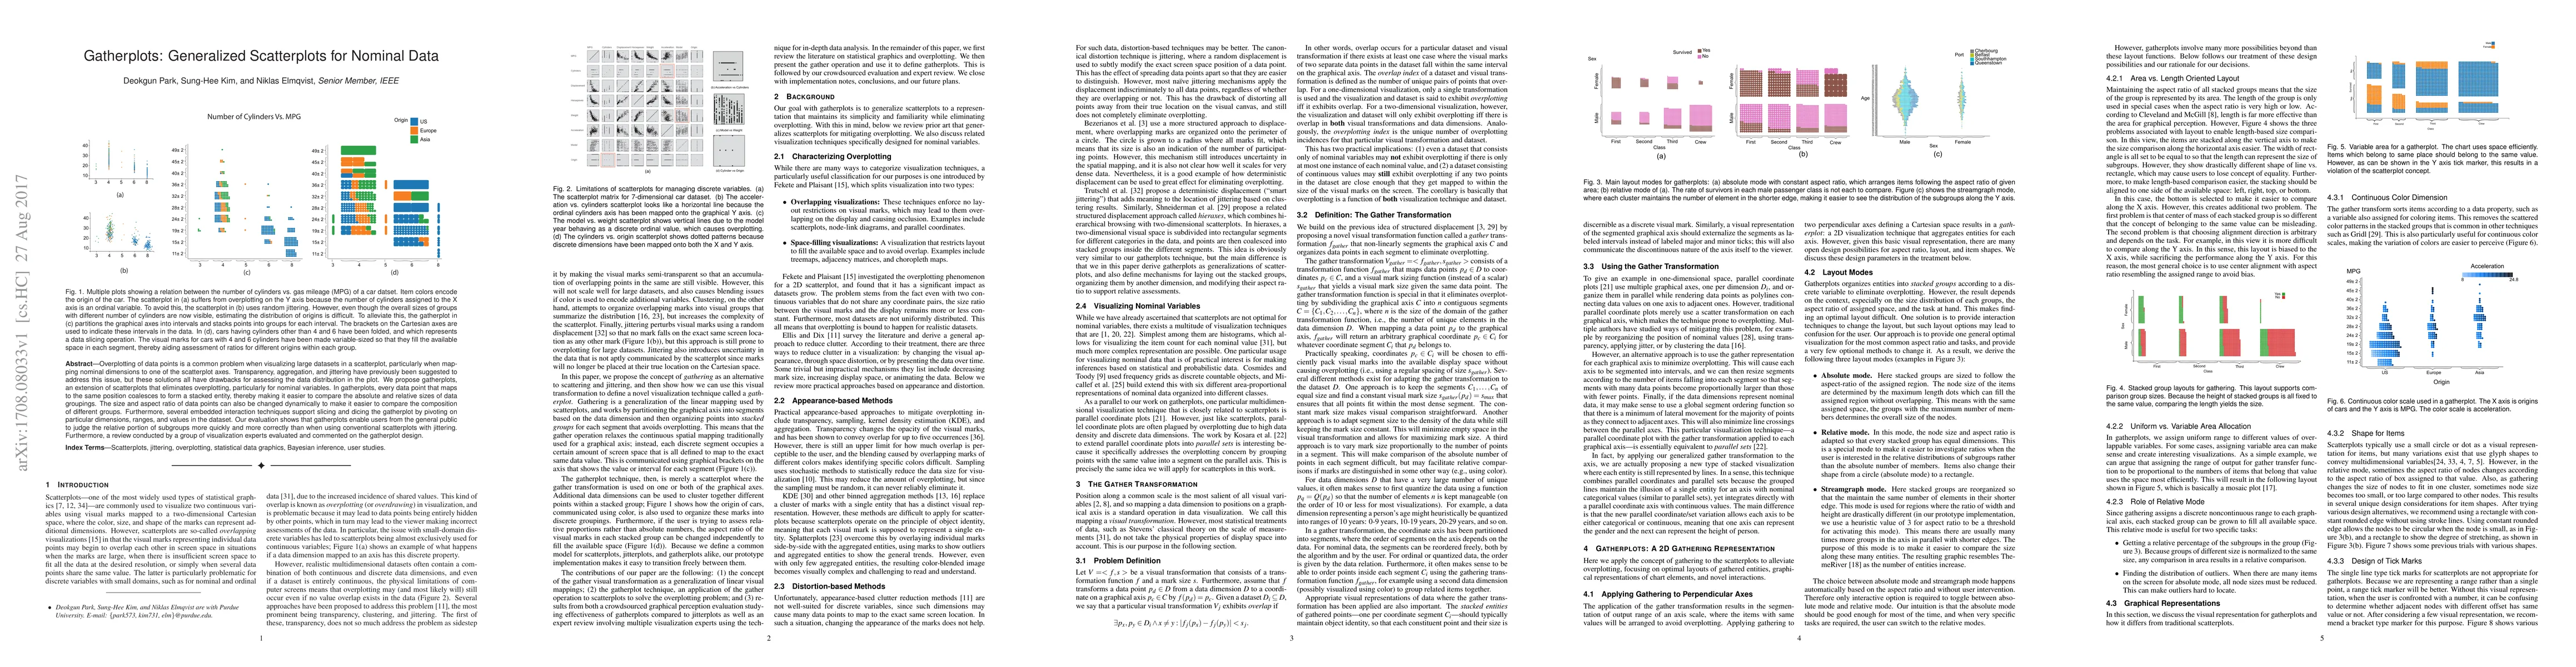
Overplotting of data points is a common problem when visualizing large datasets in a scatterplot, particularly when mapping nominal dimensions to one of the scatterplot axes. Transparency, aggregation, and jittering have previously been suggested to address this issue, but these solutions all have drawbacks for assessing the data distribution in the plot. We propose gatherplots, an extension of scatterplots that eliminates overplotting, particularly for nominal variables. In gatherplots, every data point that maps to the same position coalesces to form a stacked entity, thereby making it easier to compare the absolute and relative sizes of data groupings. The size and aspect ratio of data points can also be changed dynamically to make it easier to compare the composition of different groups. Furthermore, several embedded interaction techniques support slicing and dicing the gatherplot by pivoting on particular dimensions, ranges, and values in the dataset. Our evaluation shows that gatherplots enable users from the general public to judge the relative portion of subgroups more quickly and more correctly than when using conventional scatterplots with jittering. Furthermore, a review conducted by a group of visualization experts evaluated and commented on the gatherplot design.
AI Key Findings
Get AI-generated insights about this paper's methodology, results, significance, and more — seven facets brought into focus.
Impact
Paper Details
PDF Preview
Key Terms
Citation Network
Current paper (gray), citations (green), references (blue)
Display is limited for performance on very large graphs.
Discussion 0