Quick Summary:

This study investigates the impact of category numbers and color encoding on categorical perception in color-coded scatterplots through a crowdsourced experiment. Findings reveal that increased categories and higher color discriminability significantly affect data analysis, with judgments becoming more challenging as category numbers grow.

Summary

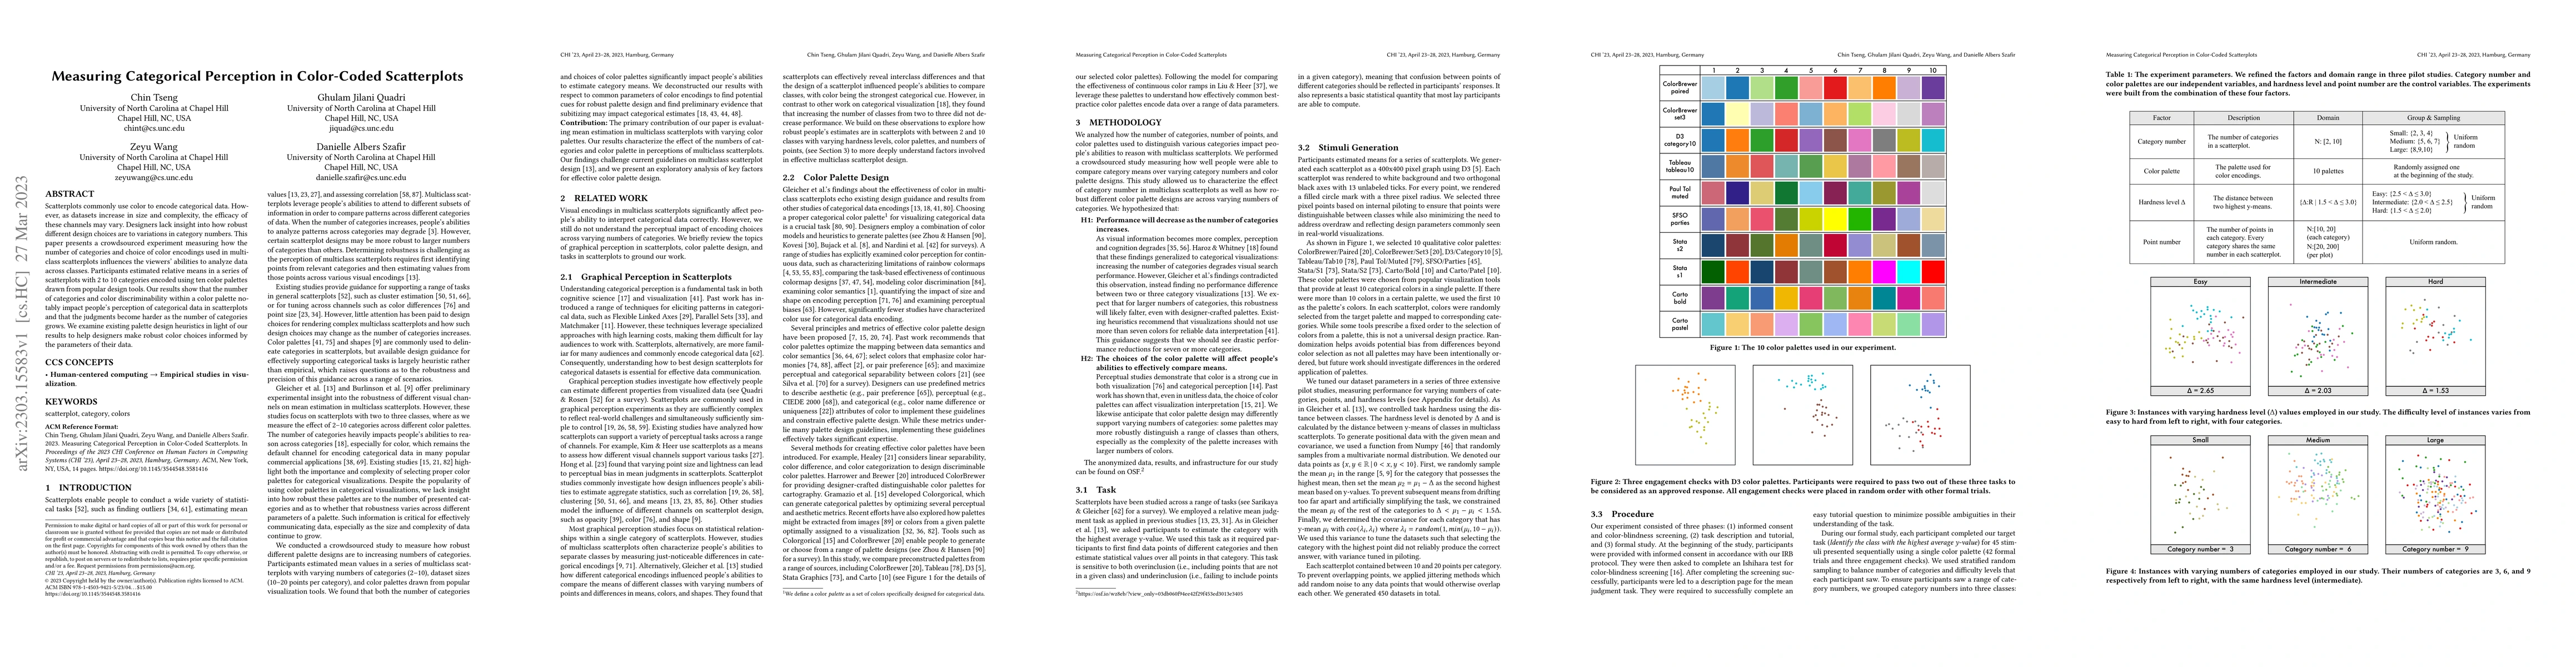
Scatterplots commonly use color to encode categorical data. However, as datasets increase in size and complexity, the efficacy of these channels may vary. Designers lack insight into how robust different design choices are to variations in category numbers. This paper presents a crowdsourced experiment measuring how the number of categories and choice of color encodings used in multiclass scatterplots influences the viewers' abilities to analyze data across classes. Participants estimated relative means in a series of scatterplots with 2 to 10 categories encoded using ten color palettes drawn from popular design tools. Our results show that the number of categories and color discriminability within a color palette notably impact people's perception of categorical data in scatterplots and that the judgments become harder as the number of categories grows. We examine existing palette design heuristics in light of our results to help designers make robust color choices informed by the parameters of their data.

AI Key Findings

Get AI-generated insights about this paper's methodology, results, and significance.

Paper Details

PDF Preview

Download PDF

Key Terms

color (0.341)
categories (0.307)
choices (0.233)
design (0.184)
robust (0.170)
influences (0.155)
number (0.150)
encode (0.150)
informed (0.146)
encoded (0.145)
drawn (0.143)
notably (0.142)
perception (0.142)
participants (0.141)
data (0.140)
grows (0.138)
efficacy (0.138)
vary (0.138)
people (0.131)
insight (0.128)

Citation Network

Current paper (gray), citations (green), references (blue)

Current Paper
Citations
References
Click to view
Title Authors Year Actions
Uncovering How Scatterplot Features Skew Visual Class Separation
S. Bae, Takanori Fujiwara, Chin Tseng, D. Szafir
2025
View Paper
Toward Constructing Frameworks for Task- and Design-Optimized Visualizations
Ghulam Jilani Quadri, S. Pattanaik
2024
View Paper
Shape It Up: An Empirically Grounded Approach for Designing Shape Palettes
Chin Tseng, Arran Zeyu Wang, Ghulam Jilani Quadri, D. Szafir
2024
View Paper
Striking the Right Balance: Systematic Assessment of Evaluation Method Distribution Across Contribution Types
Feng Lin, Arran Zeyu Wang, Md Dilshadur Rahman, D. Szafir, Ghulam Jilani Quadri
2024
View Paper
Dynamic Color Assignment for Hierarchical Data
Jiashu Chen, Weikai Yang, Zelin Jia, Lanxi Xiao, Shixia Liu
2024
View Paper
AVA: An automated and AI-driven intelligent visual analytics framework
Jiazhe Wang, Xi Li, Chenlu Li, Di Peng, Arran Zeyu Wang, Yuhui Gu, Xingui Lai, Haifeng Zhang, Xinyue Xu, Xiaoqing Dong, Zhifeng Lin, Jiehui Zhou, Xingyu Liu, Wei Chen
2024
View Paper
Revisiting Categorical Color Perception in Scatterplots: Sequential, Diverging, and Categorical Palettes
Chin Tseng, Arran Zeyu Wang, Ghulam Jilani Quadri, D. Szafir
2024
View Paper
Do You See What I See? A Qualitative Study Eliciting High-Level Visualization Comprehension
Ghulam Jilani Quadri, Arran Zeyu Wang, Zhehao Wang, Jennifer Adorno, Paul Rosen, D. Szafir
2024
View Paper
An empirical study of counterfactual visualization to support visual causal inference
Arran Zeyu Wang, D. Borland, David Gotz
2024
View Paper
NL2Color: Refining Color Palettes for Charts with Natural Language
Chuhan Shi, Weiwei Cui, Chengzhong Liu, Chengbo Zheng, Haidong Zhang, Qiong Luo, Xiaojuan Ma
2023
View Paper

Comments (0)

This website uses cookies to ensure you get the best experience. Learn more