Academic Profile
Statistics
Similar Authors
Papers on arXiv
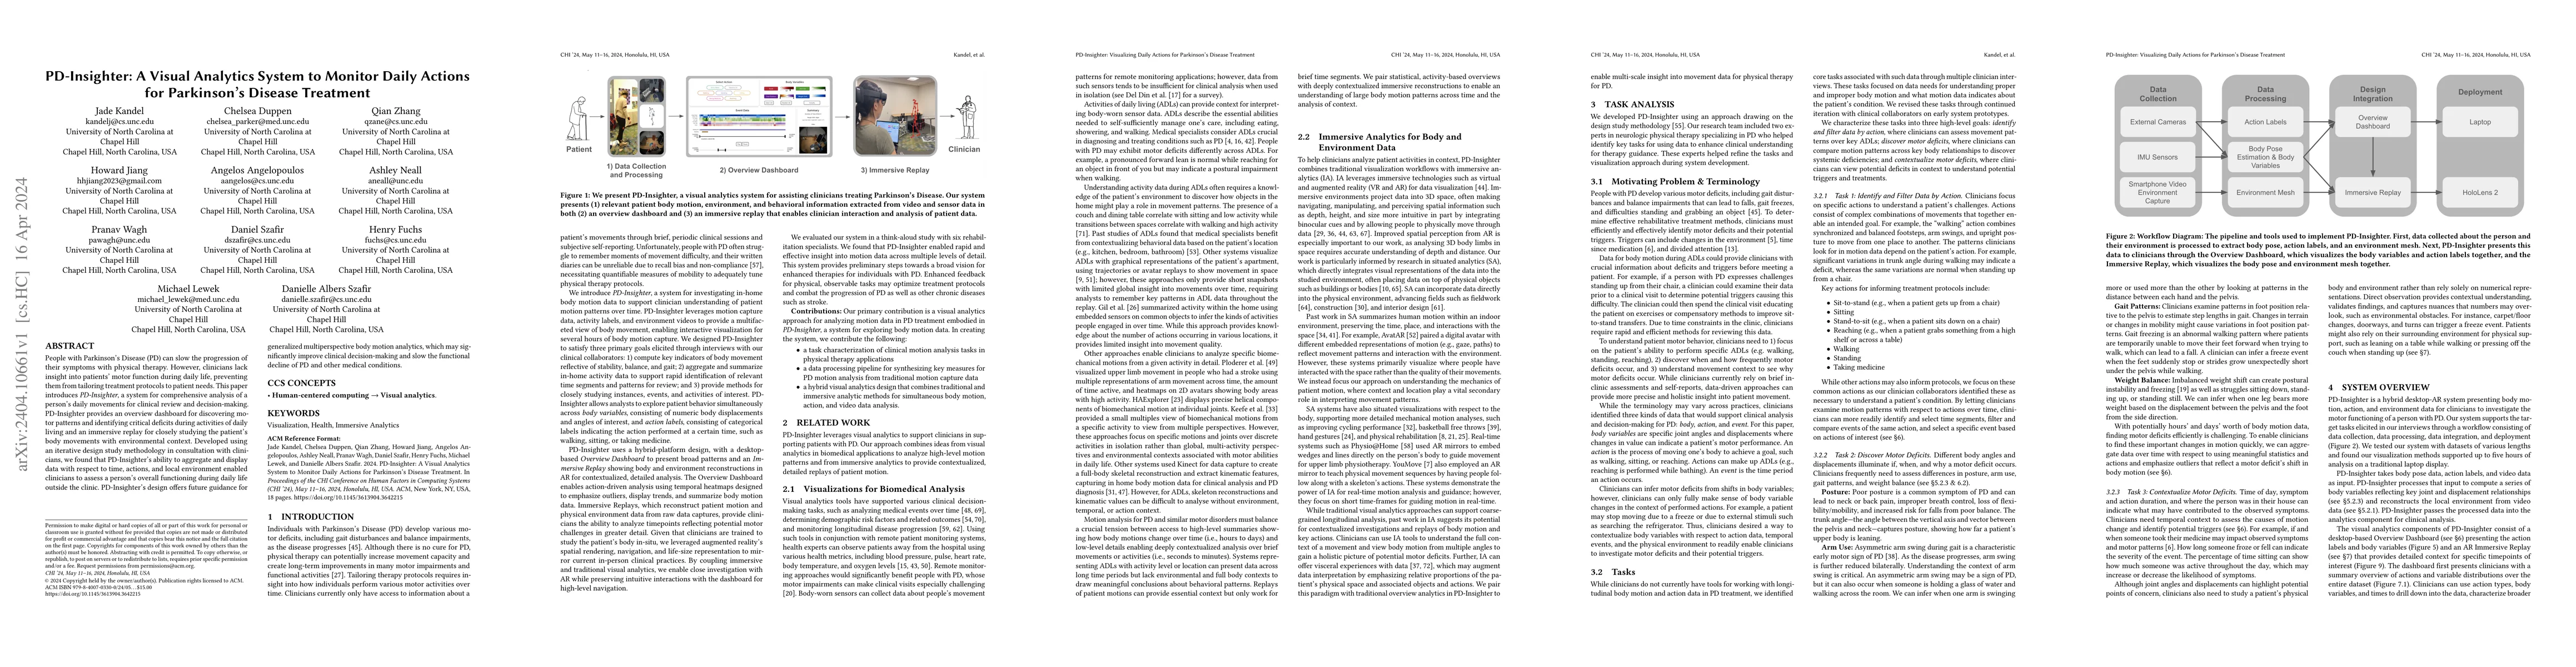
People with Parkinson's Disease (PD) can slow the progression of their symptoms with physical therapy. However, clinicians lack insight into patients' motor function during daily life, preventing th...
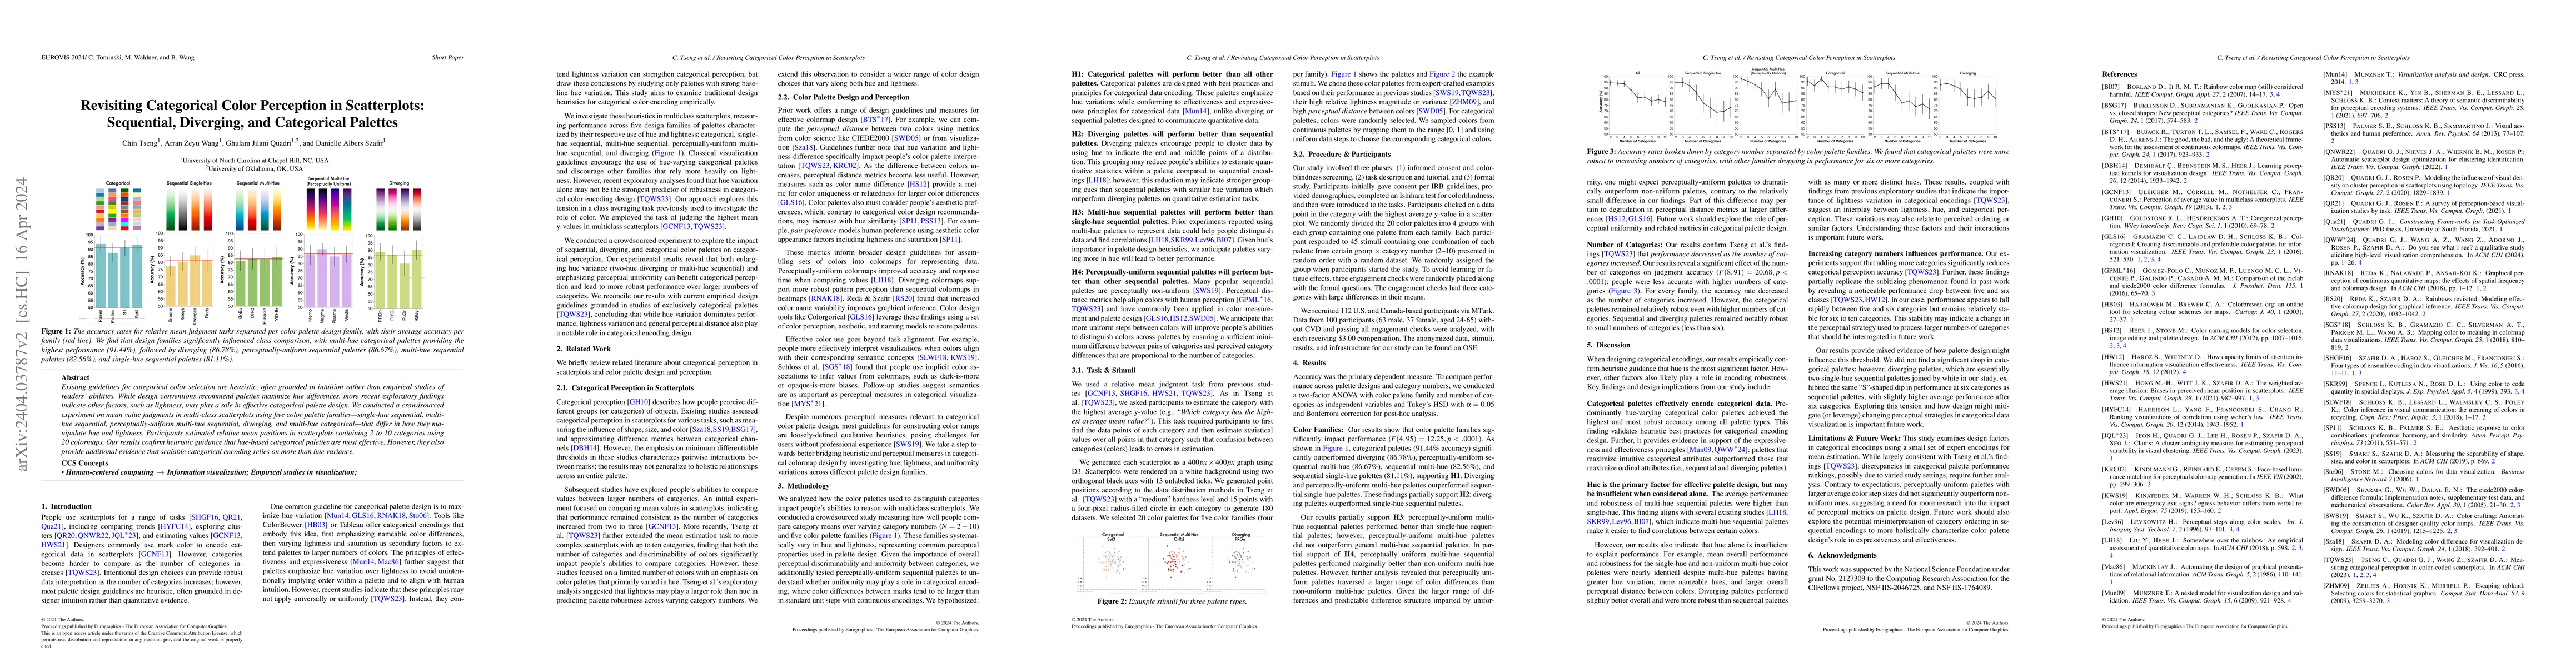
Existing guidelines for categorical color selection are heuristic, often grounded in intuition rather than empirical studies of readers' abilities. While design conventions recommend palettes maximi...
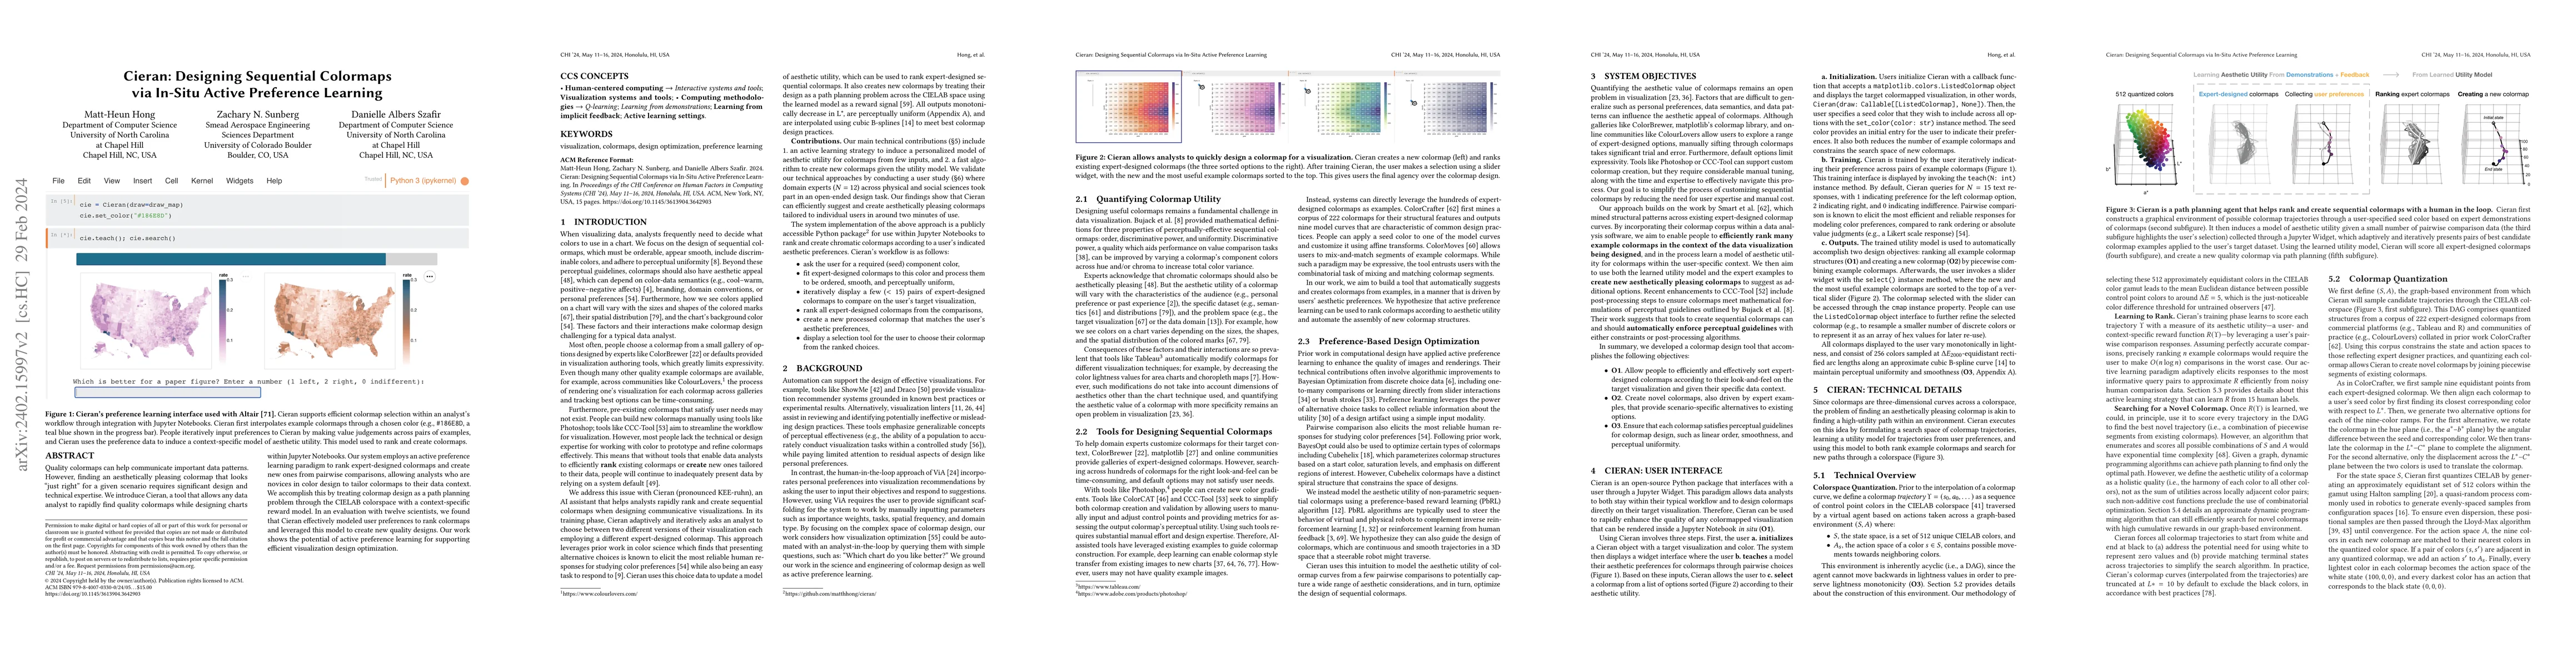
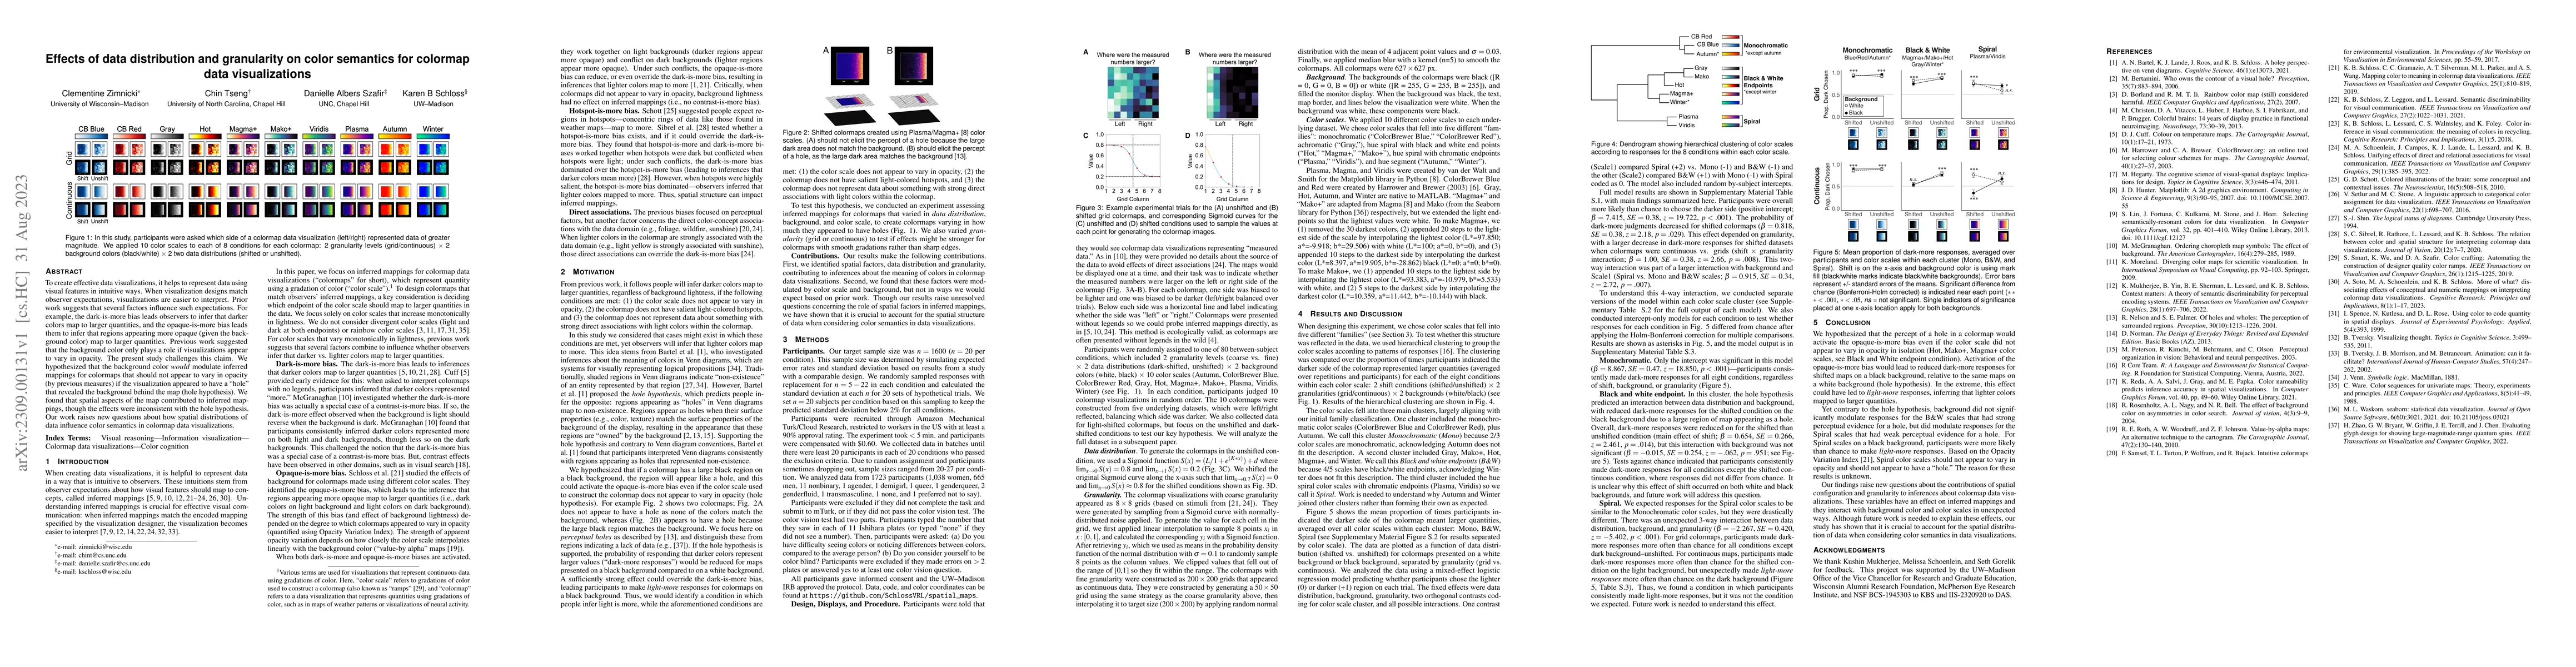
Quality colormaps can help communicate important data patterns. However, finding an aesthetically pleasing colormap that looks "just right" for a given scenario requires significant design and techn...
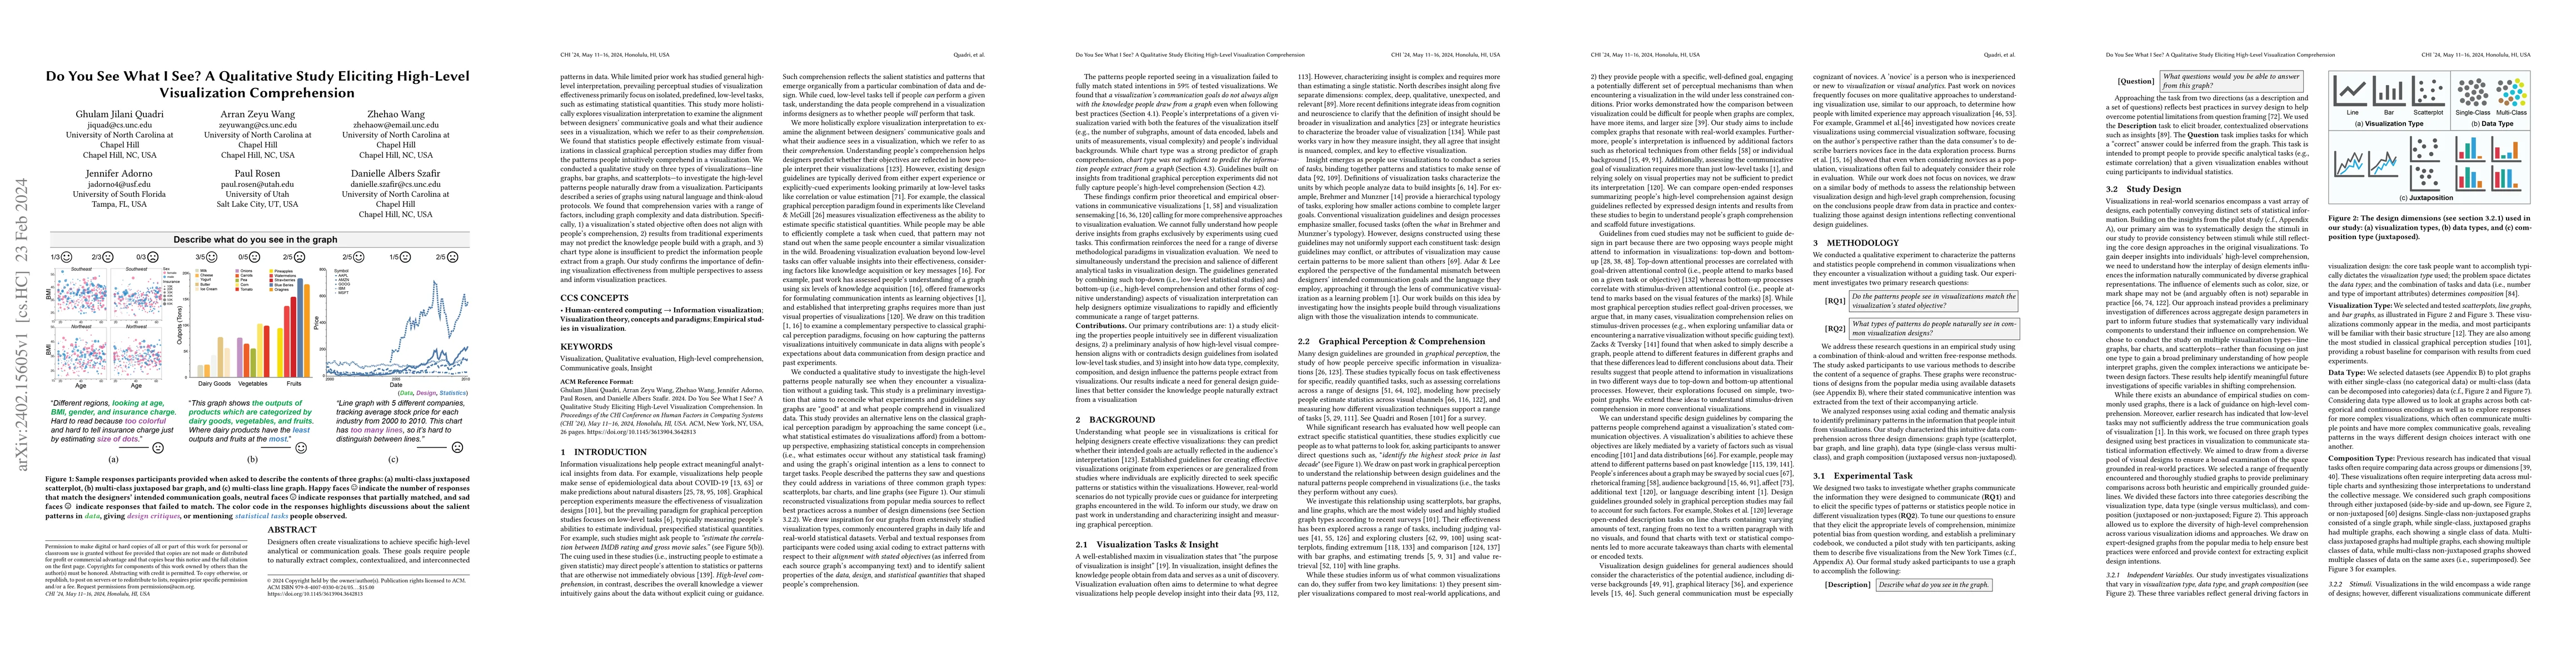
Designers often create visualizations to achieve specific high-level analytical or communication goals. These goals require people to naturally extract complex, contextualized, and interconnected pa...
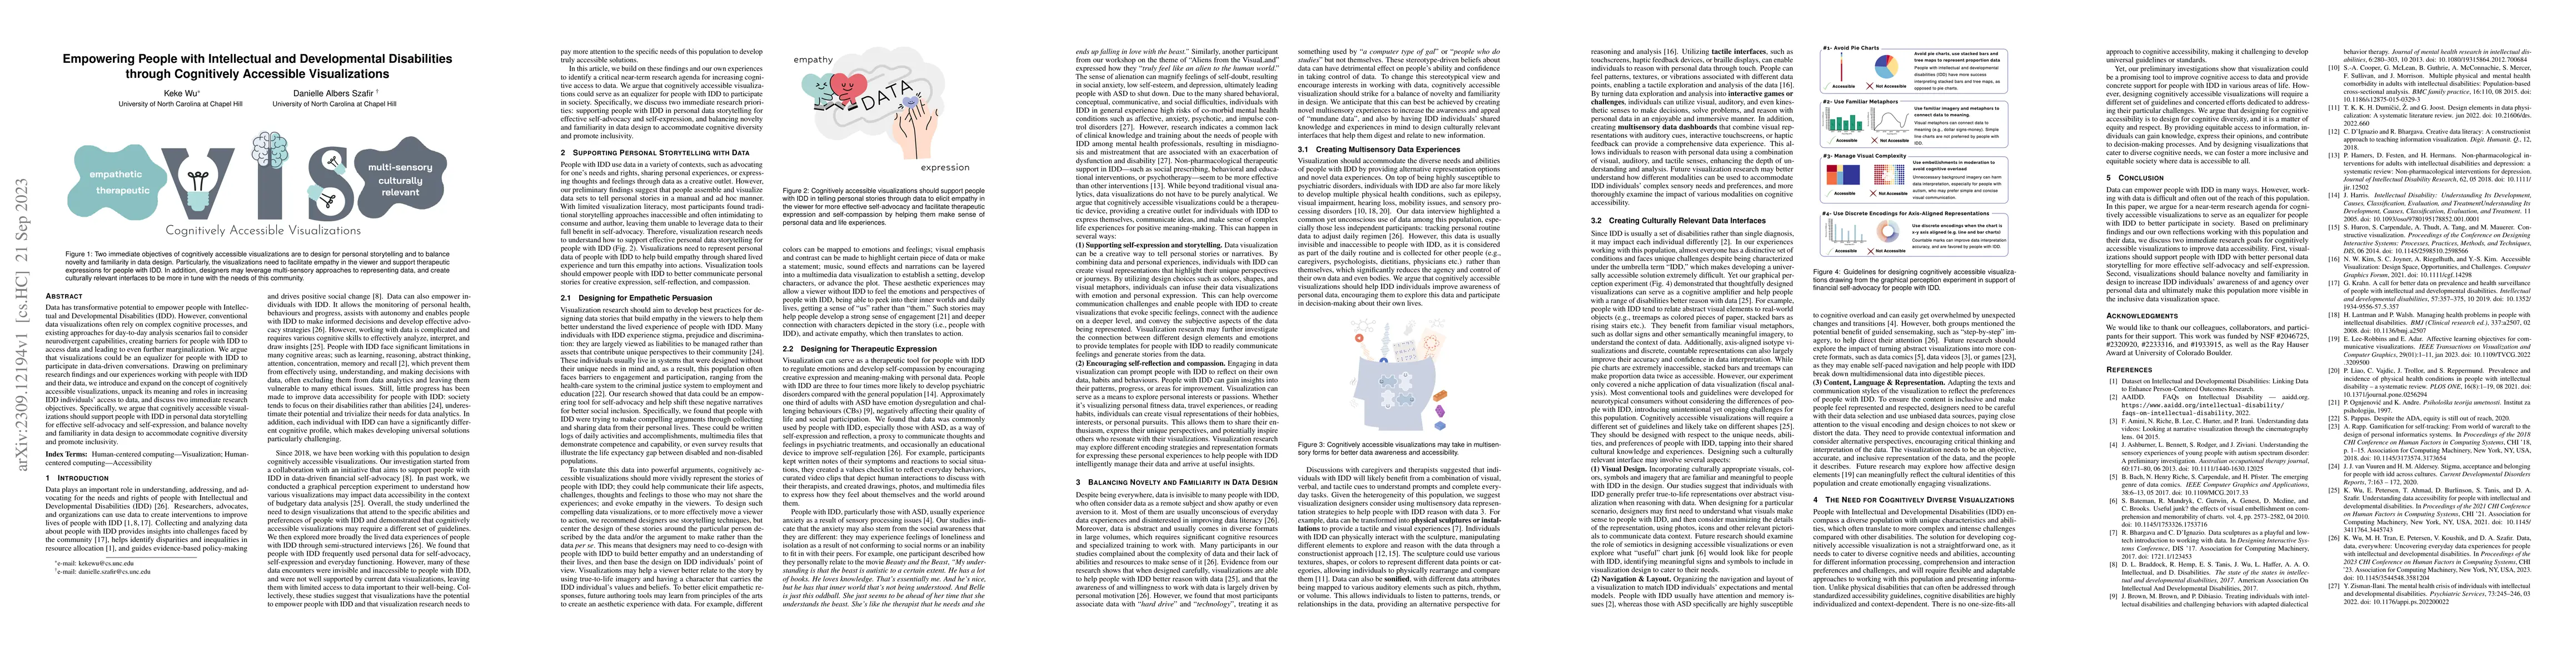
Data has transformative potential to empower people with Intellectual and Developmental Disabilities (IDD). However, conventional data visualizations often rely on complex cognitive processes, and e...
To create effective data visualizations, it helps to represent data using visual features in intuitive ways. When visualization designs match observer expectations, visualizations are easier to inte...
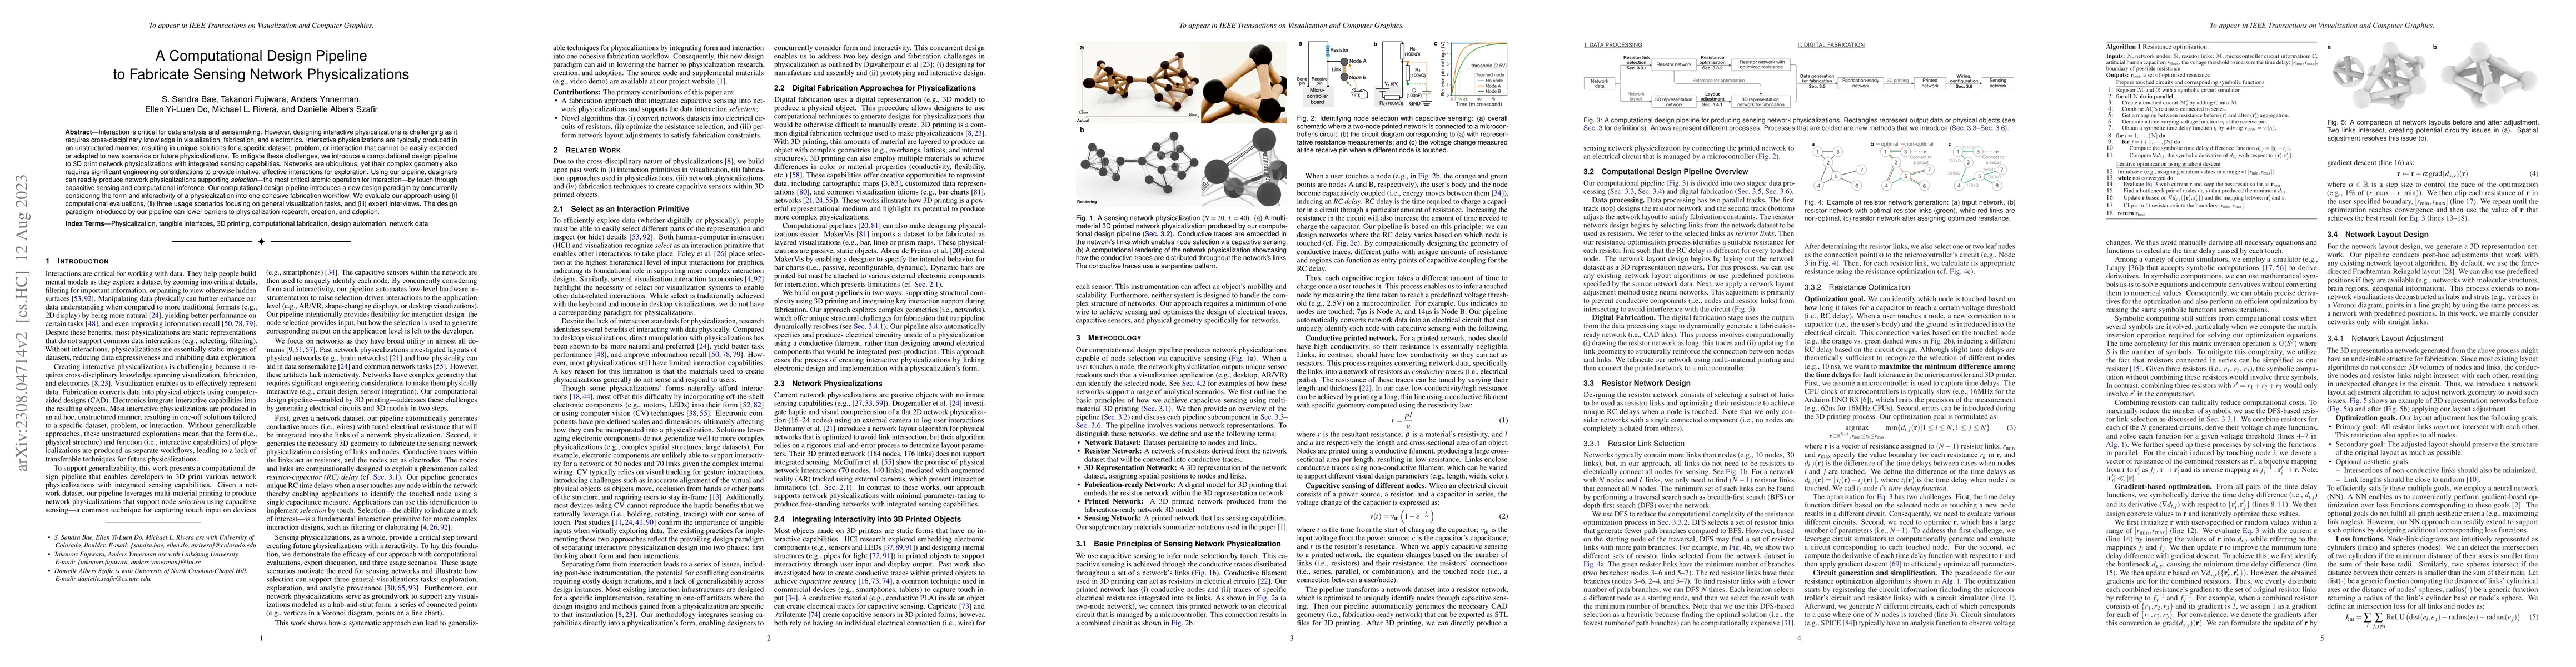
Interaction is critical for data analysis and sensemaking. However, designing interactive physicalizations is challenging as it requires cross-disciplinary knowledge in visualization, fabrication, a...
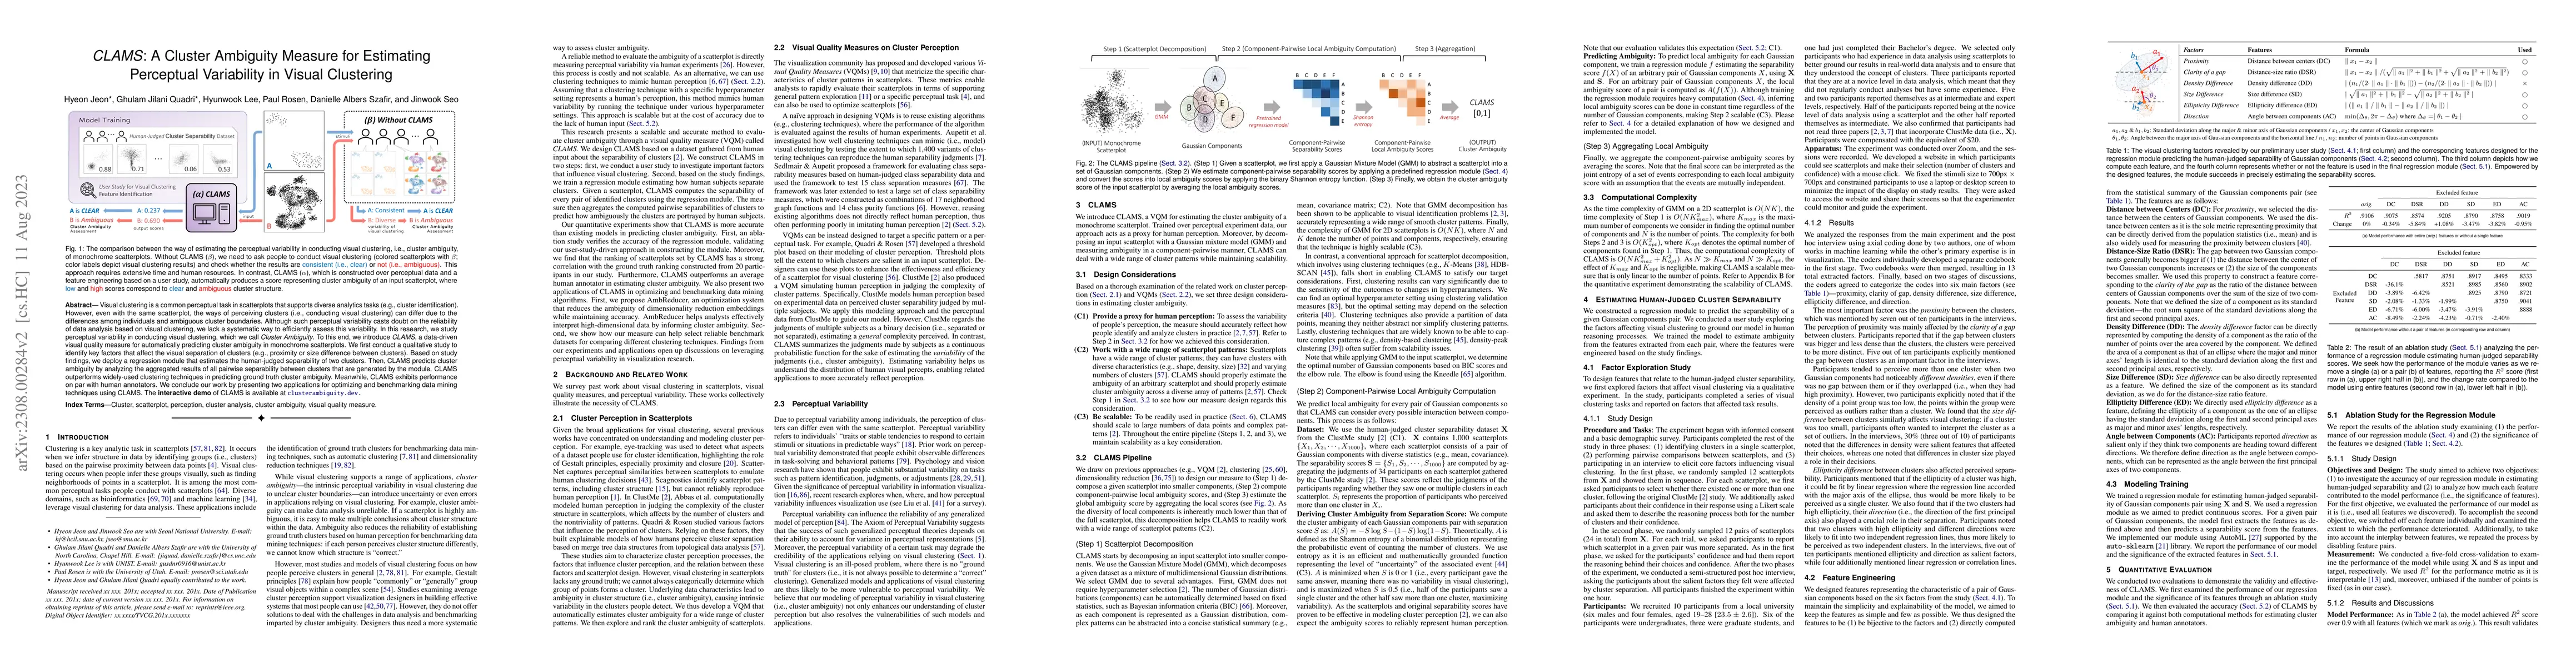
Visual clustering is a common perceptual task in scatterplots that supports diverse analytics tasks (e.g., cluster identification). However, even with the same scatterplot, the ways of perceiving cl...
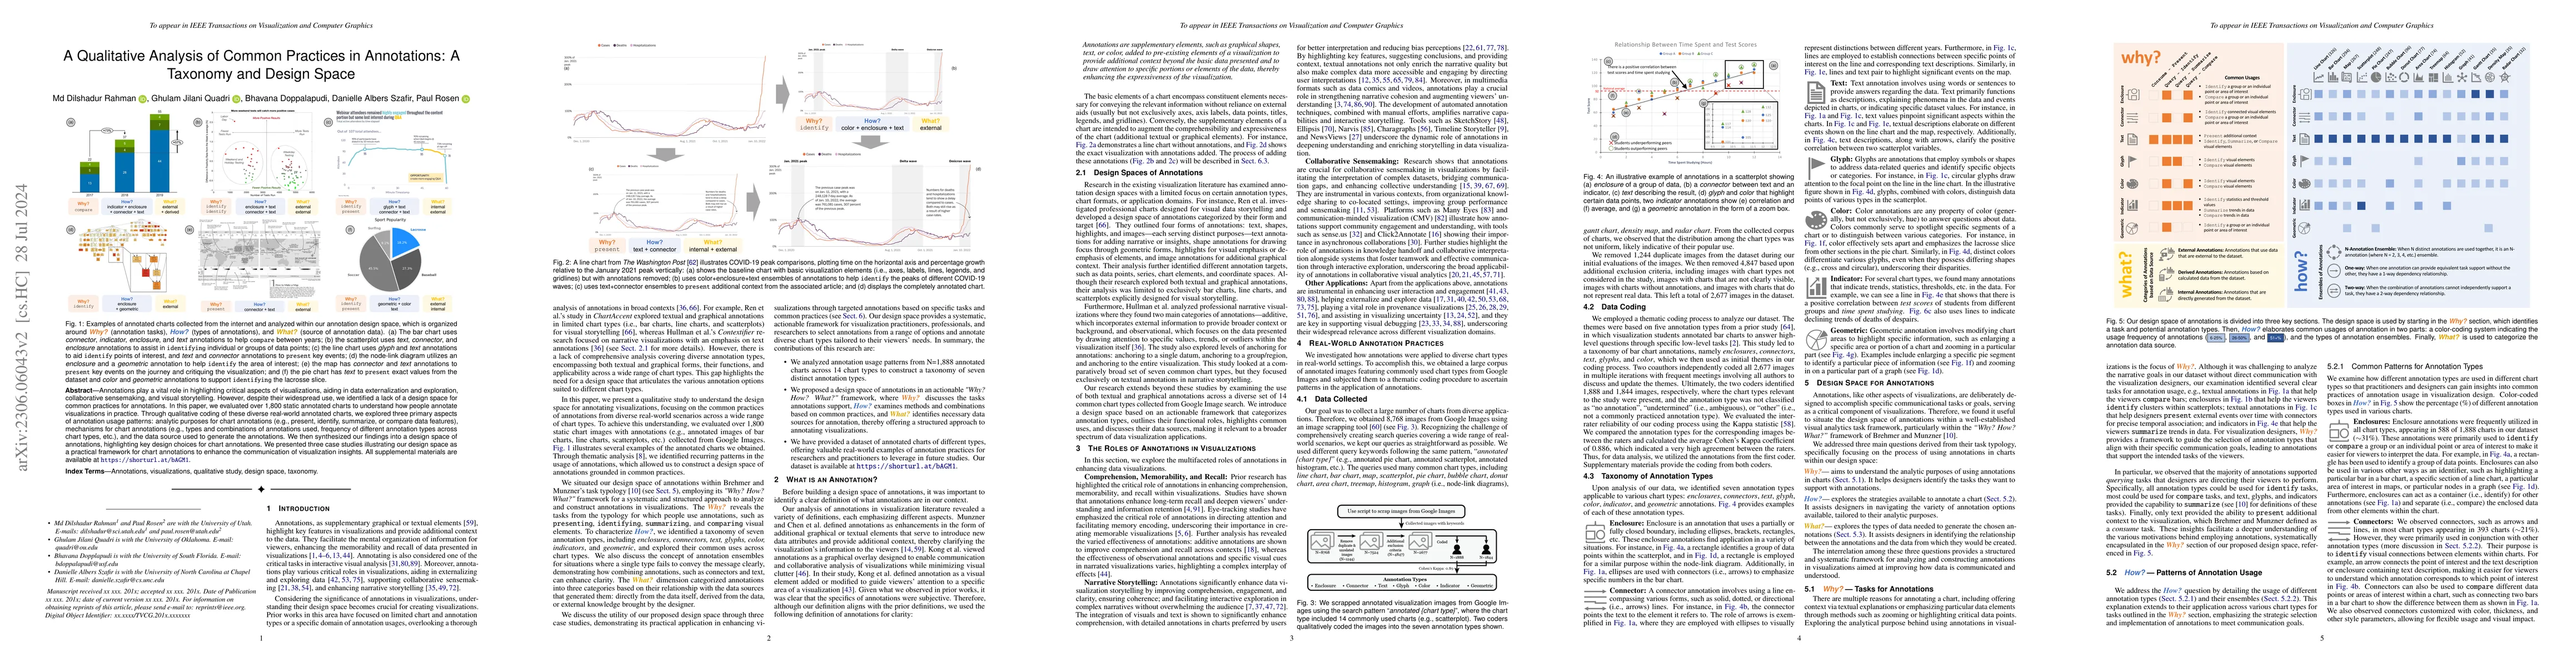
Annotations are a vital component of data externalization and collaborative analysis, directing readers' attention to important visual elements. Therefore, it is crucial to understand their design s...
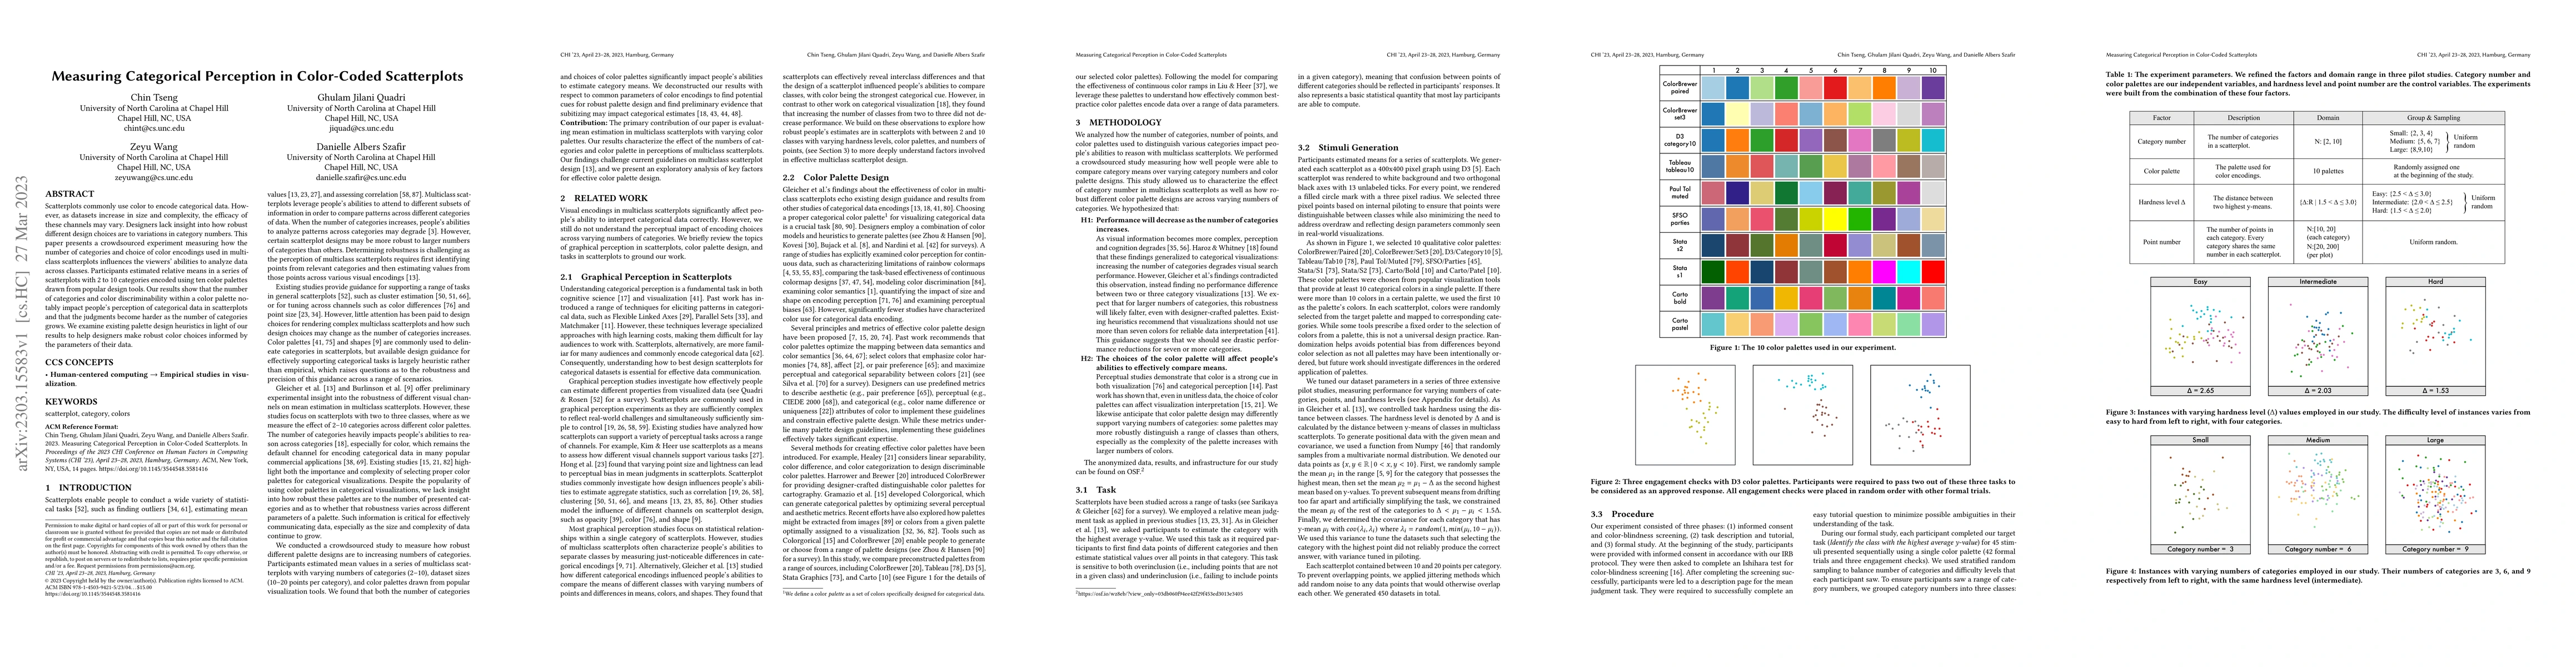
Scatterplots commonly use color to encode categorical data. However, as datasets increase in size and complexity, the efficacy of these channels may vary. Designers lack insight into how robust diff...
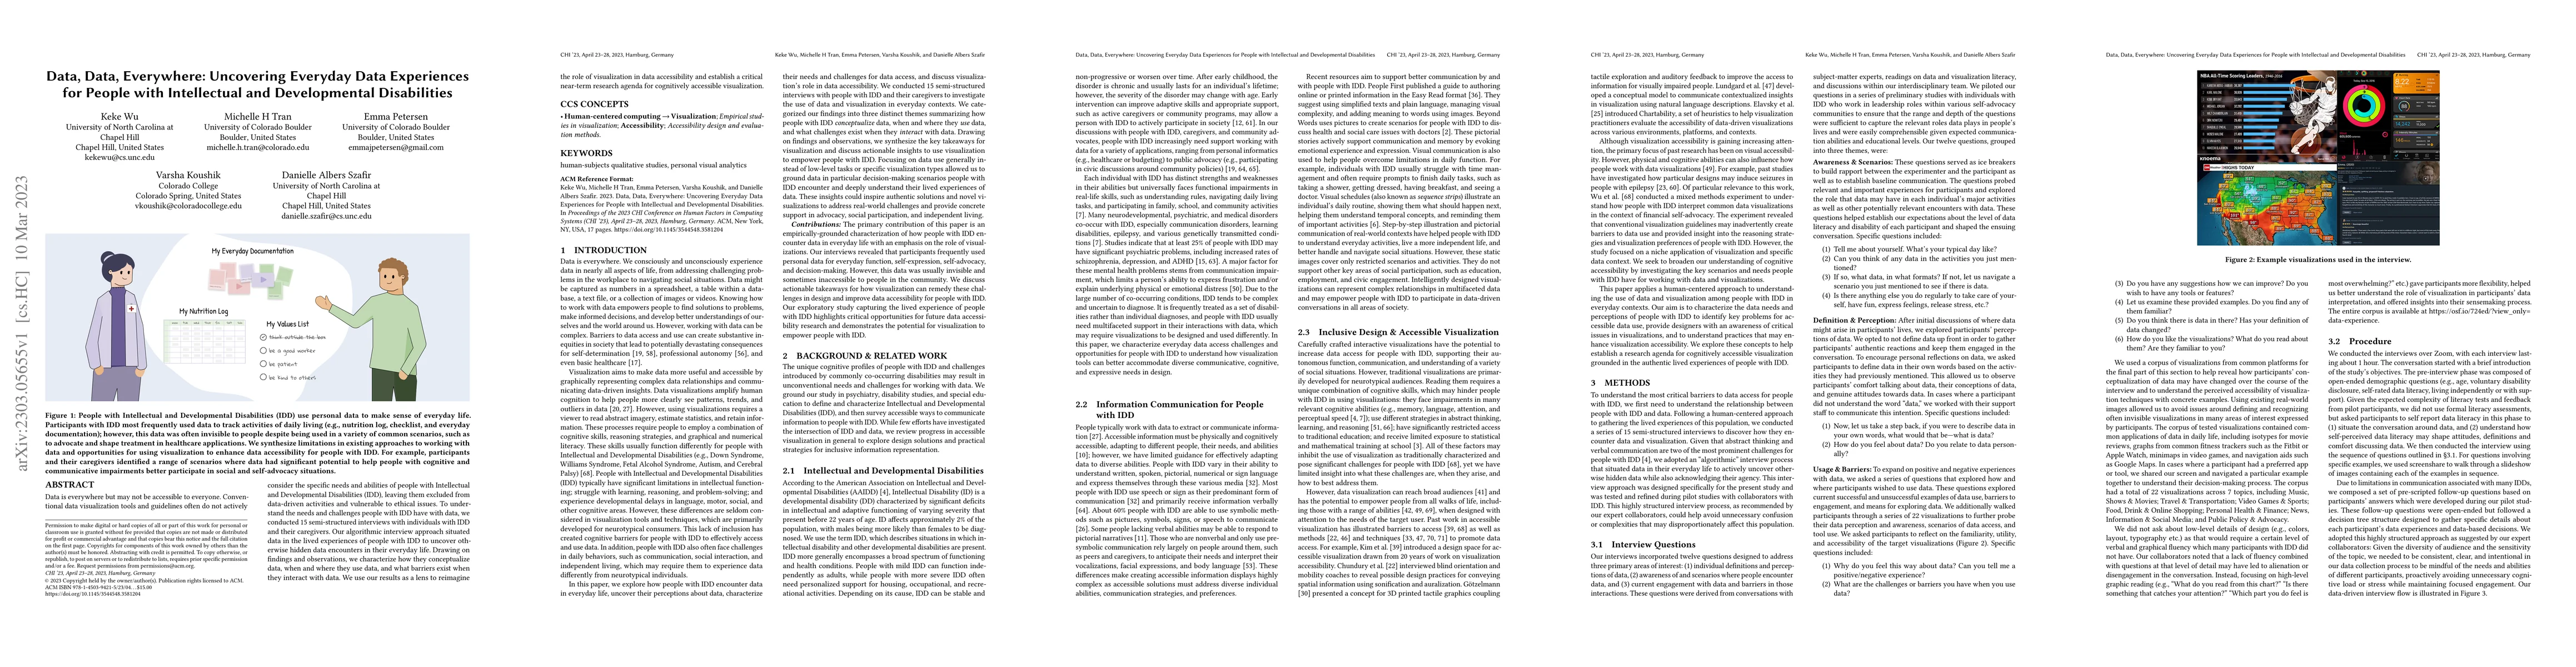
Data is everywhere but may not be accessible to everyone. Conventional data visualization tools and guidelines often do not actively consider the specific needs and abilities of people with Intellec...
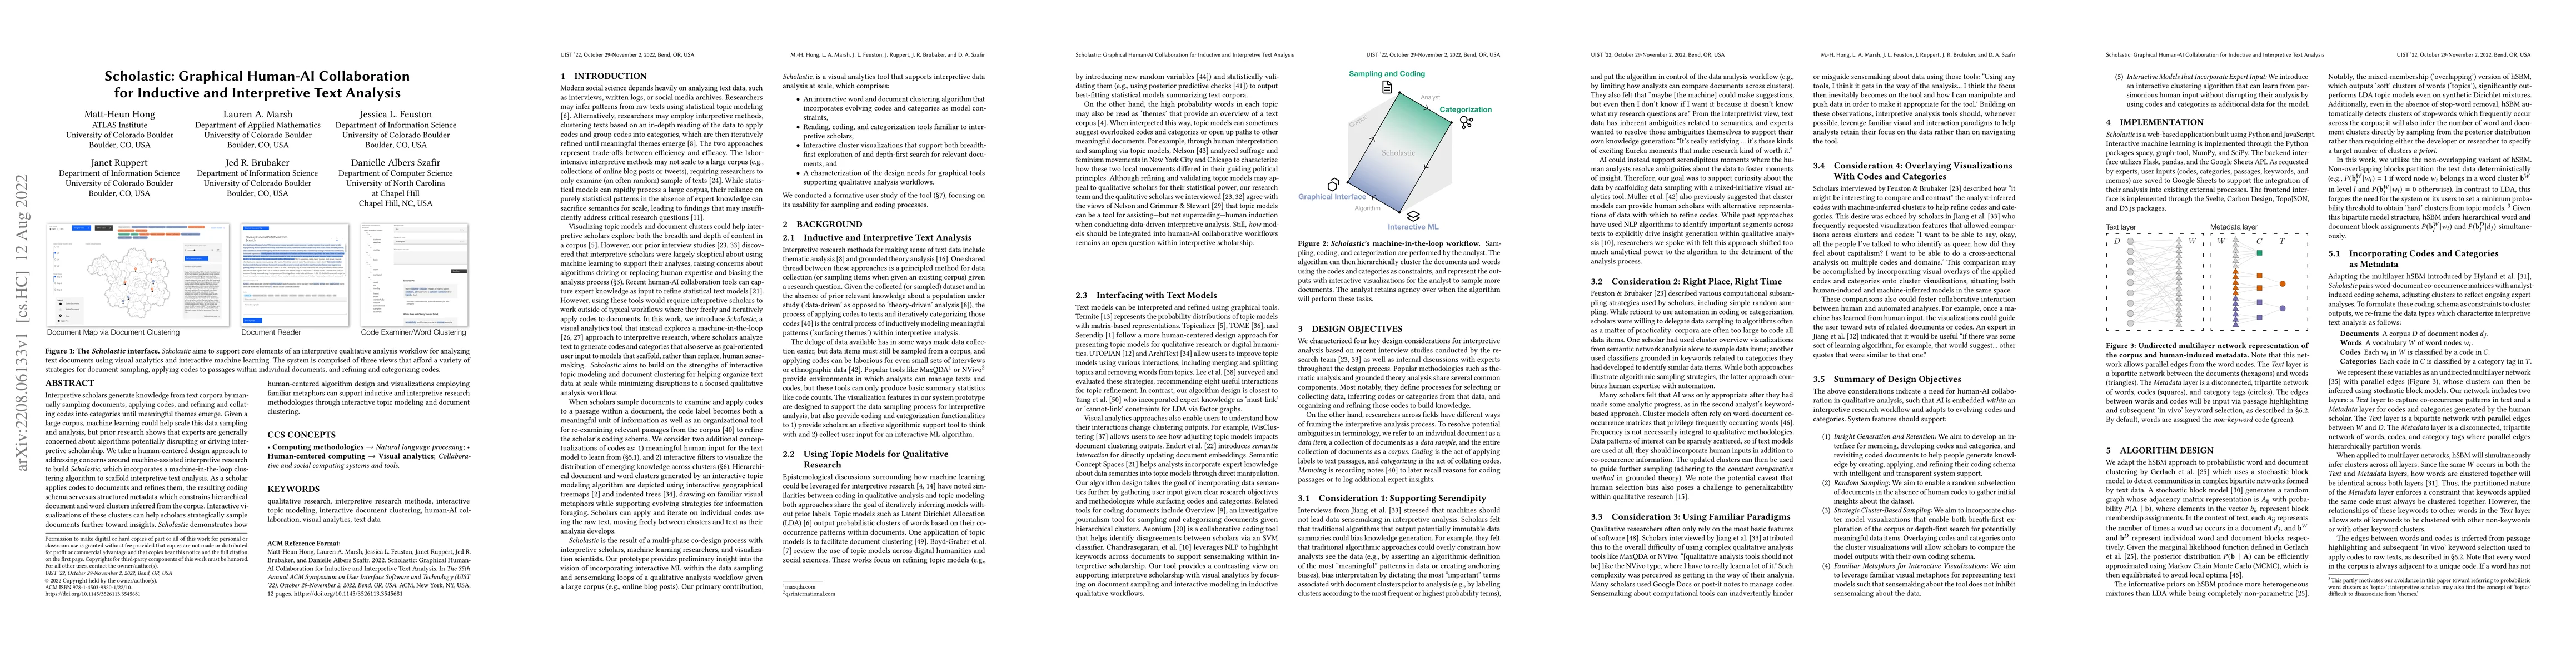
Interpretive scholars generate knowledge from text corpora by manually sampling documents, applying codes, and refining and collating codes into categories until meaningful themes emerge. Given a la...
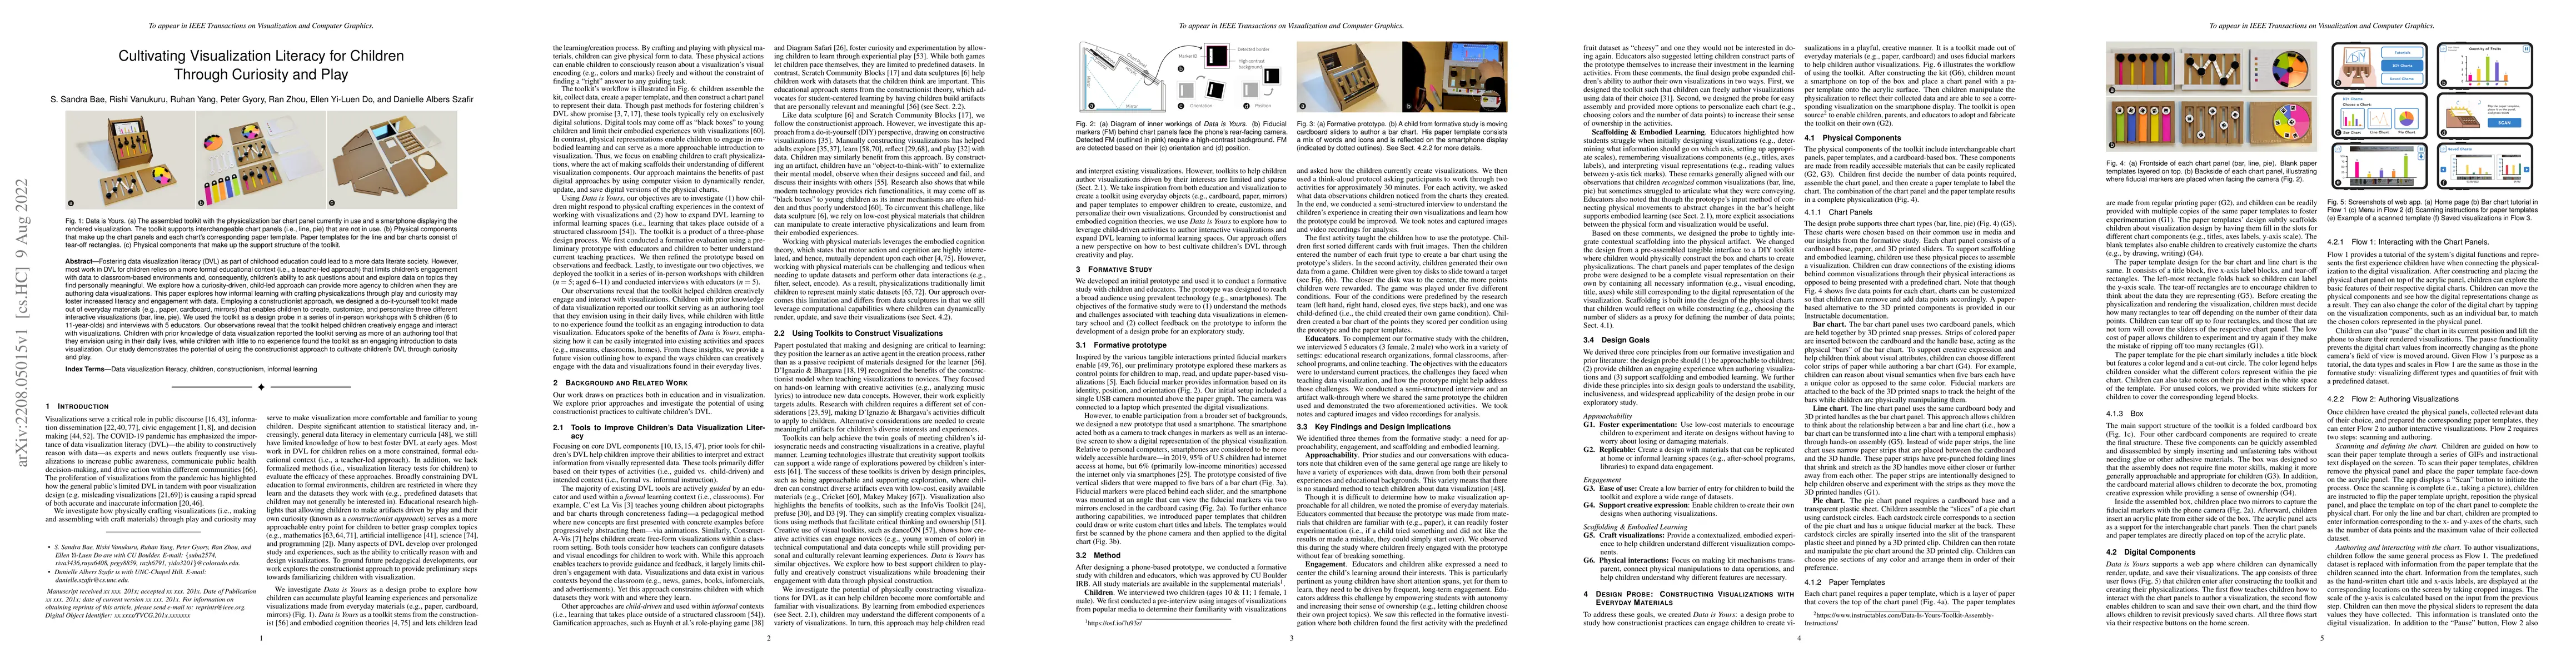
Fostering data visualization literacy (DVL) as part of childhood education could lead to a more data literate society. However, most work in DVL for children relies on a more formal educational cont...
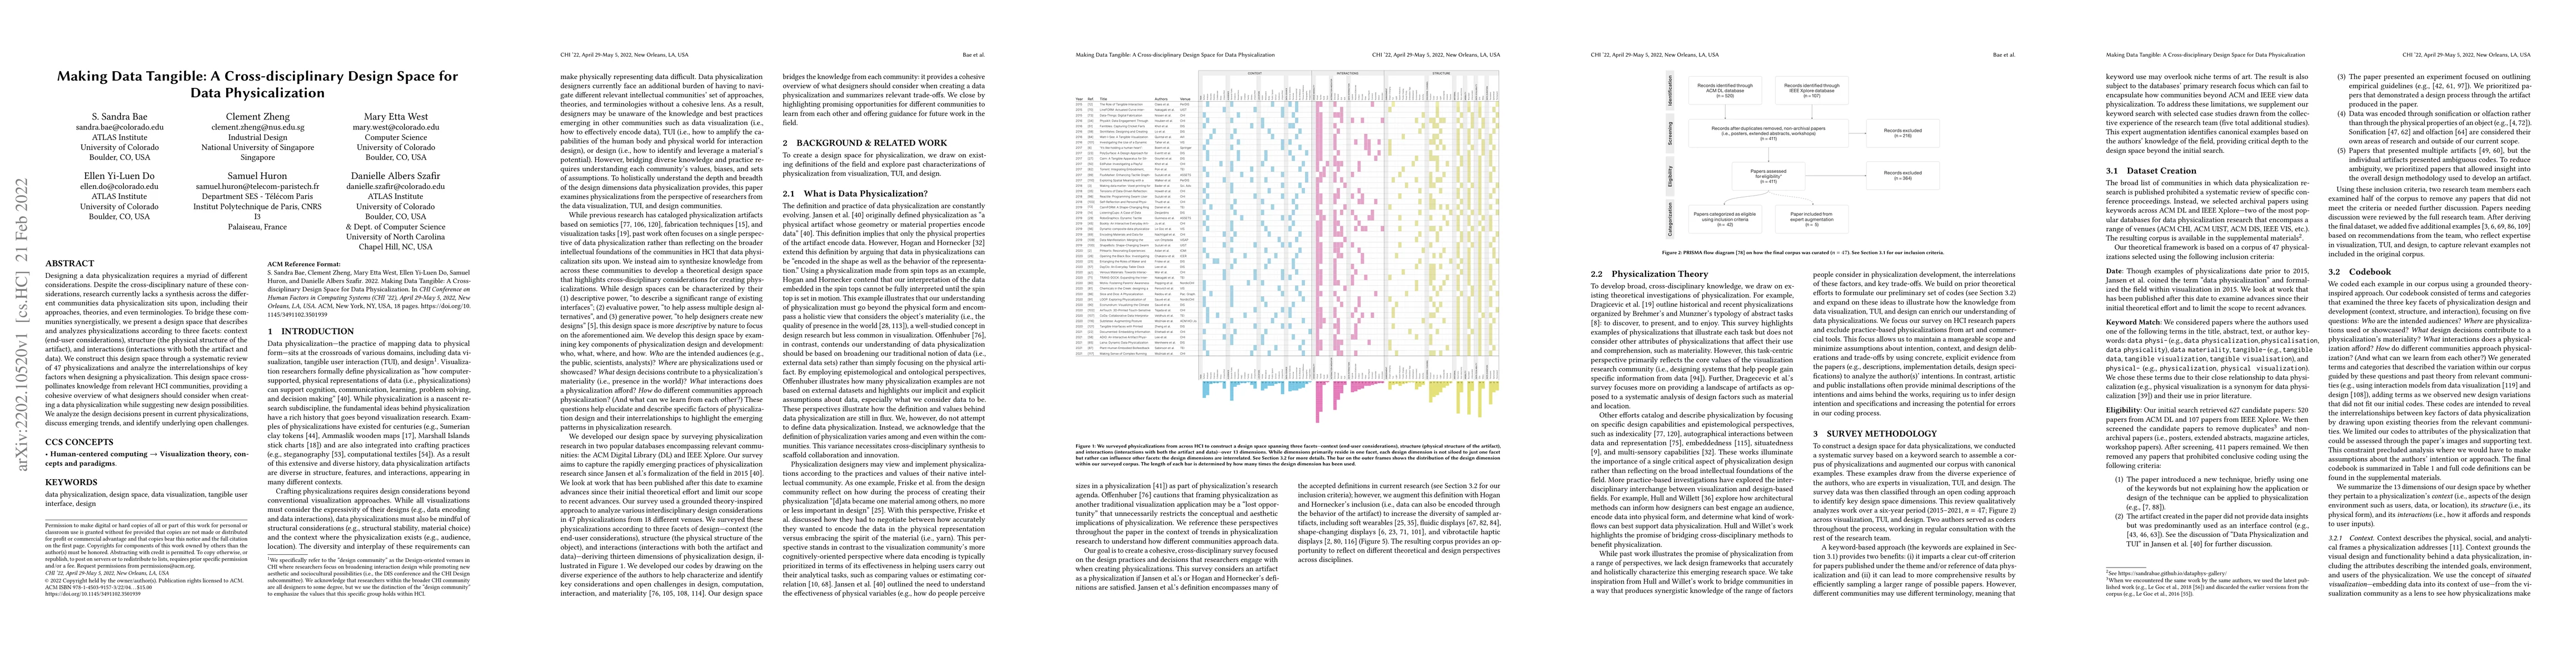
Designing a data physicalization requires a myriad of different considerations. Despite the cross-disciplinary nature of these considerations, research currently lacks a synthesis across the differe...
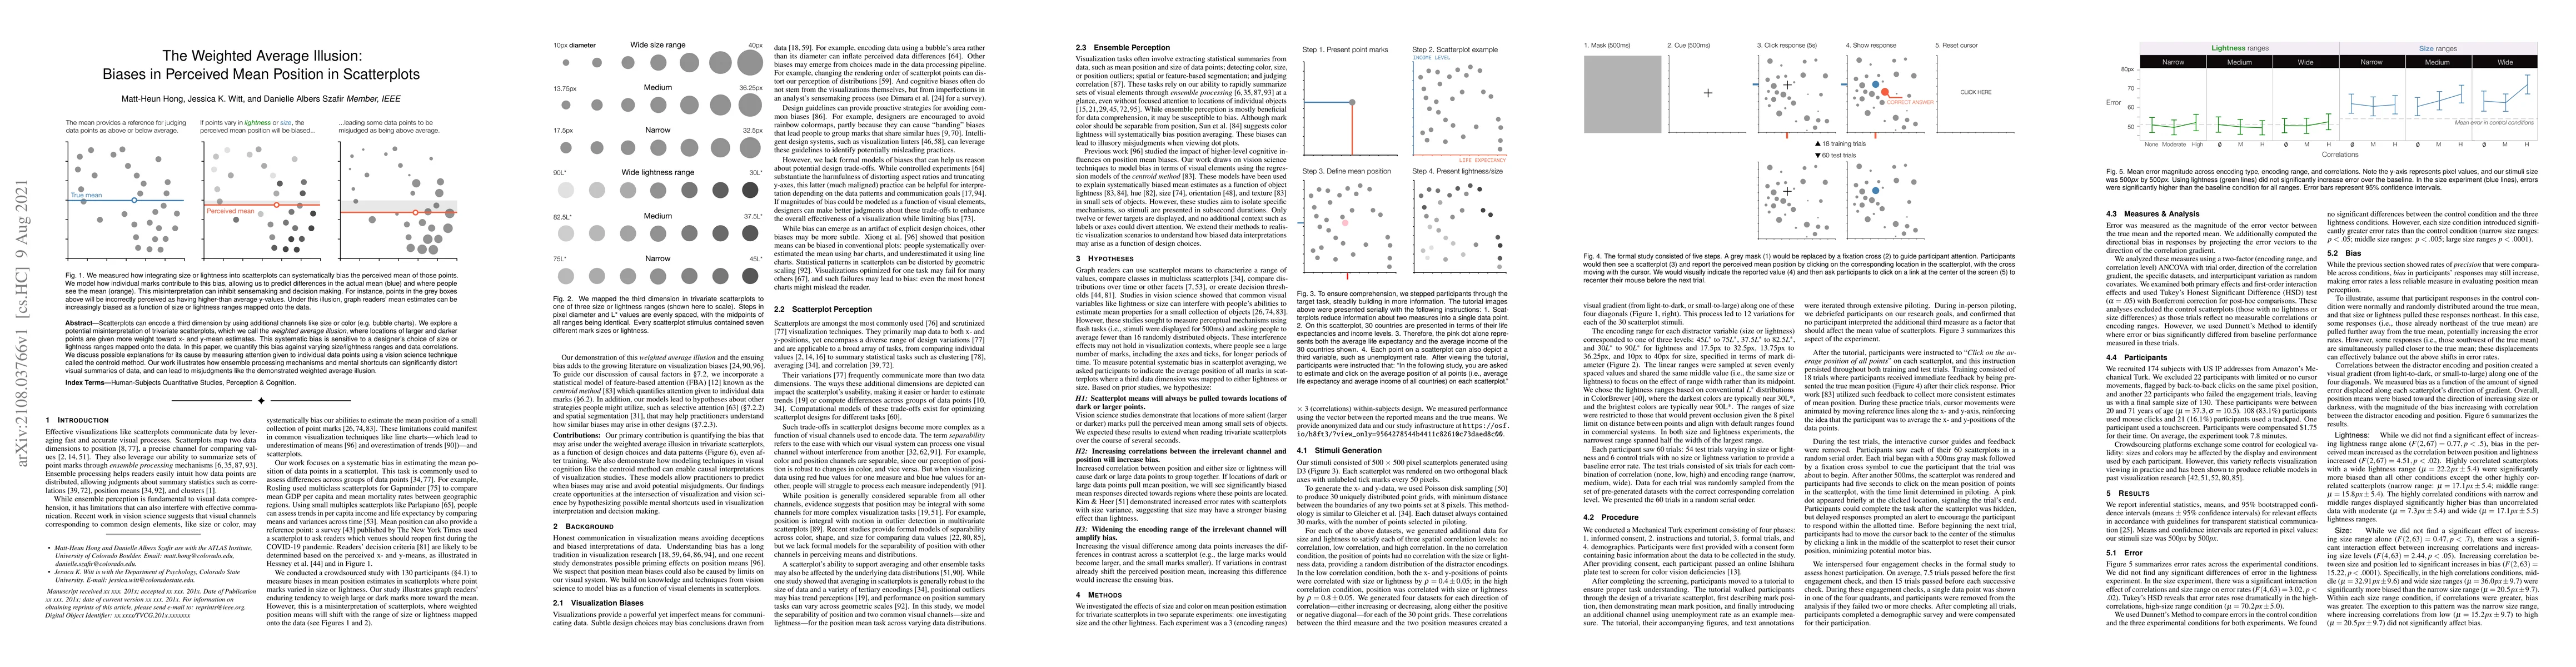
Scatterplots can encode a third dimension by using additional channels like size or color (e.g. bubble charts). We explore a potential misinterpretation of trivariate scatterplots, which we call the...
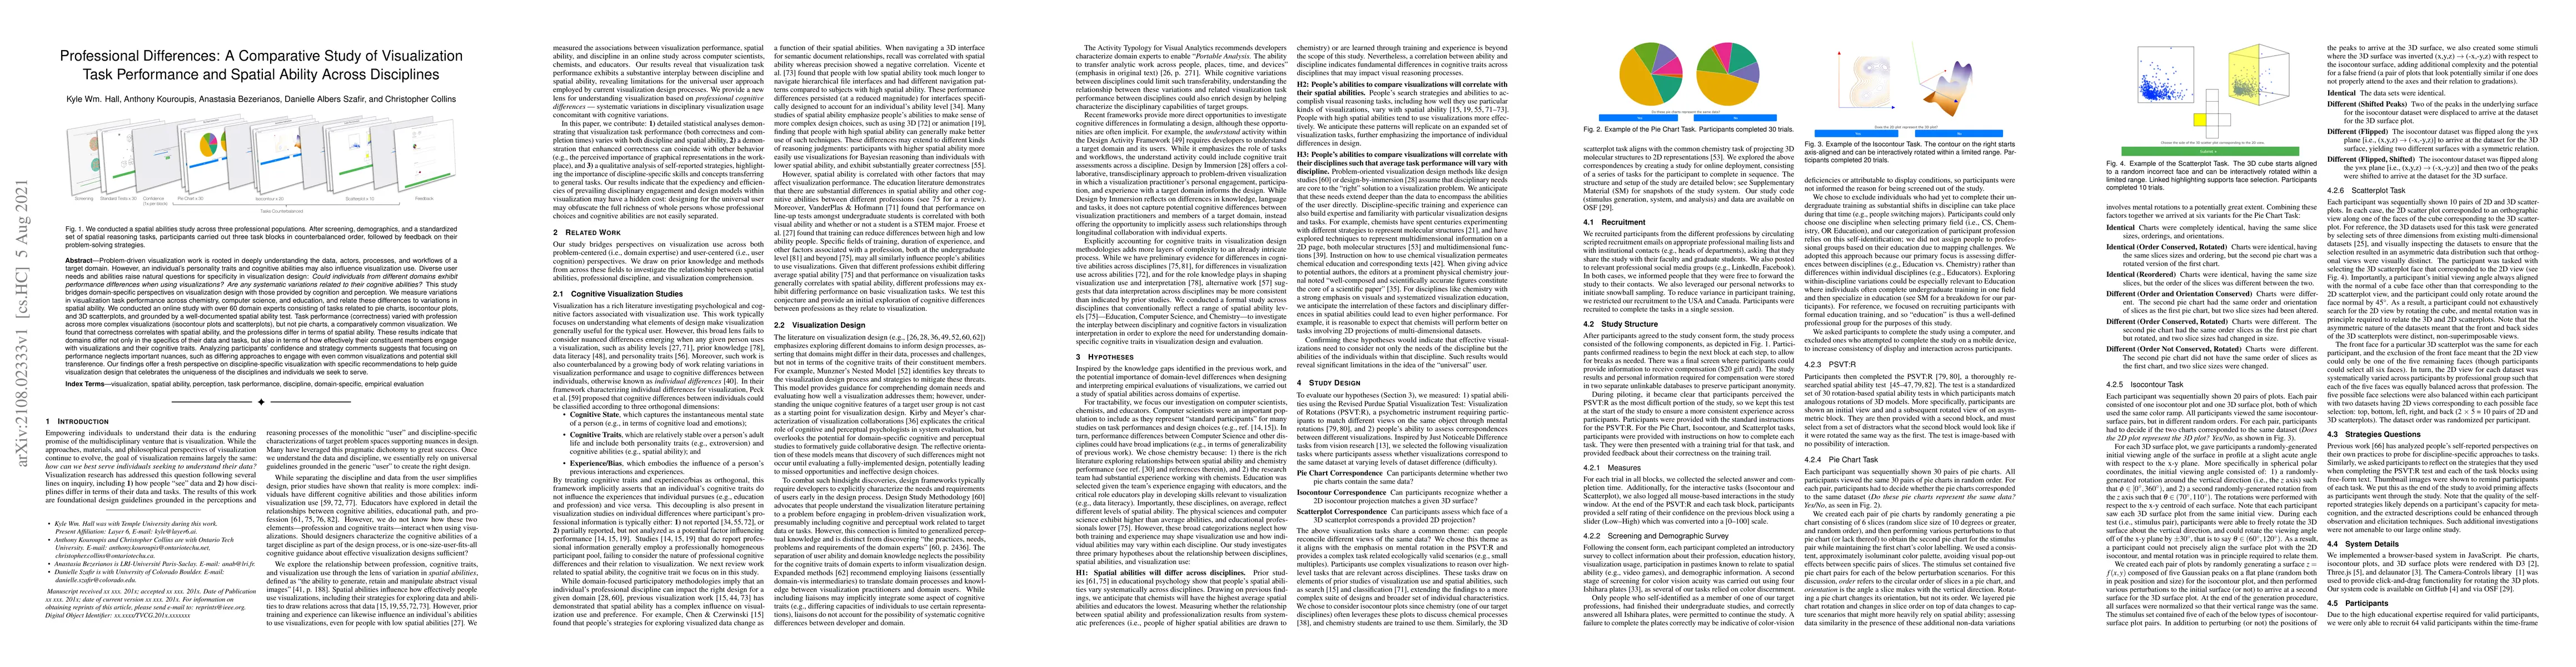
Problem-driven visualization work is rooted in deeply understanding the data, actors, processes, and workflows of a target domain. However, an individual's personality traits and cognitive abilities...
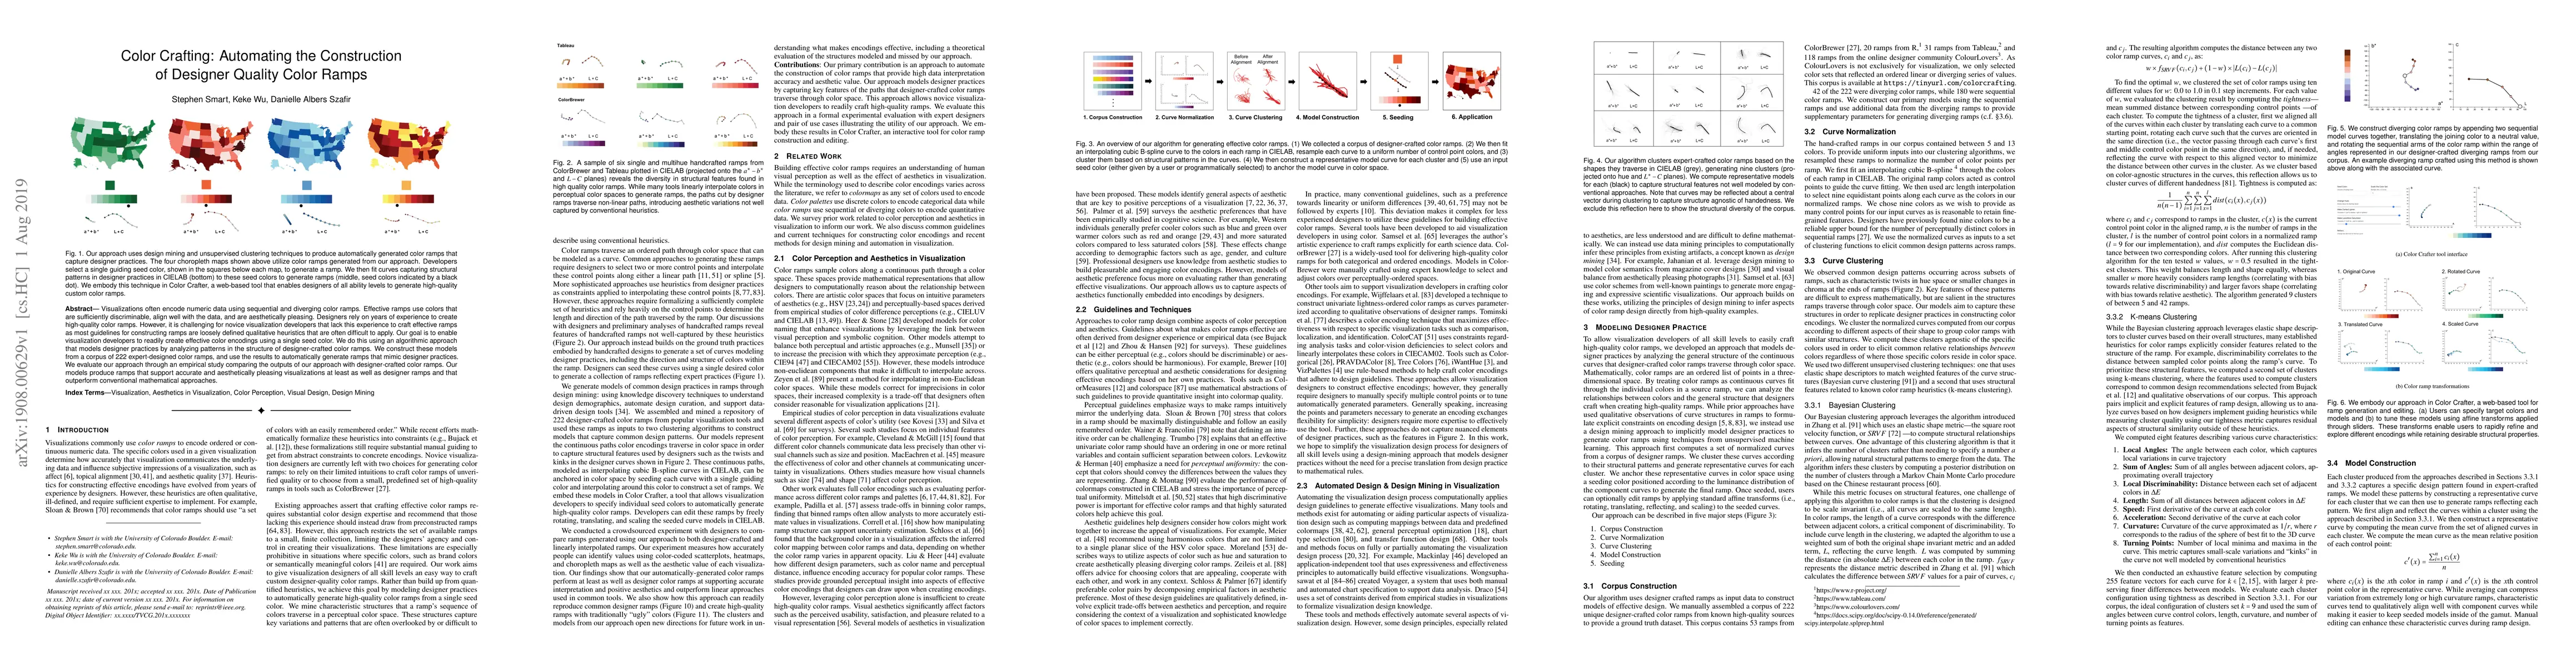
Visualizations often encode numeric data using sequential and diverging color ramps. Effective ramps use colors that are sufficiently discriminable, align well with the data, and are aesthetically p...
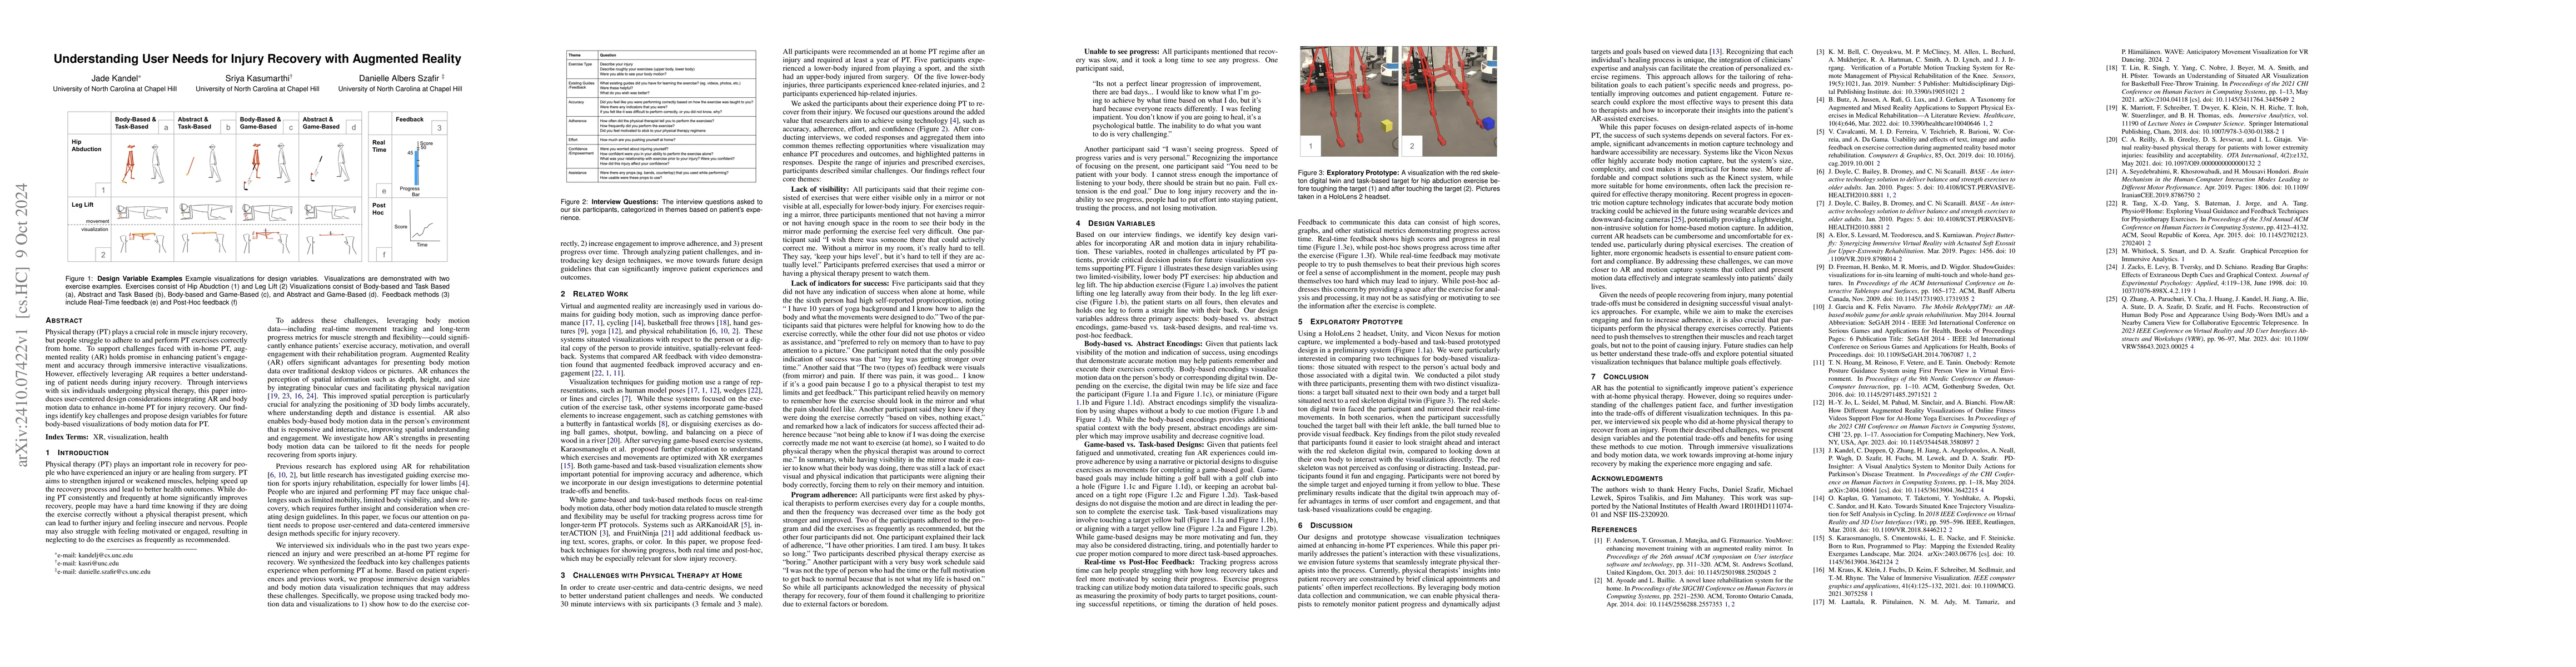
Physical therapy (PT) plays a crucial role in muscle injury recovery, but people struggle to adhere to and perform PT exercises correctly from home. To support challenges faced with in-home PT, augmen...
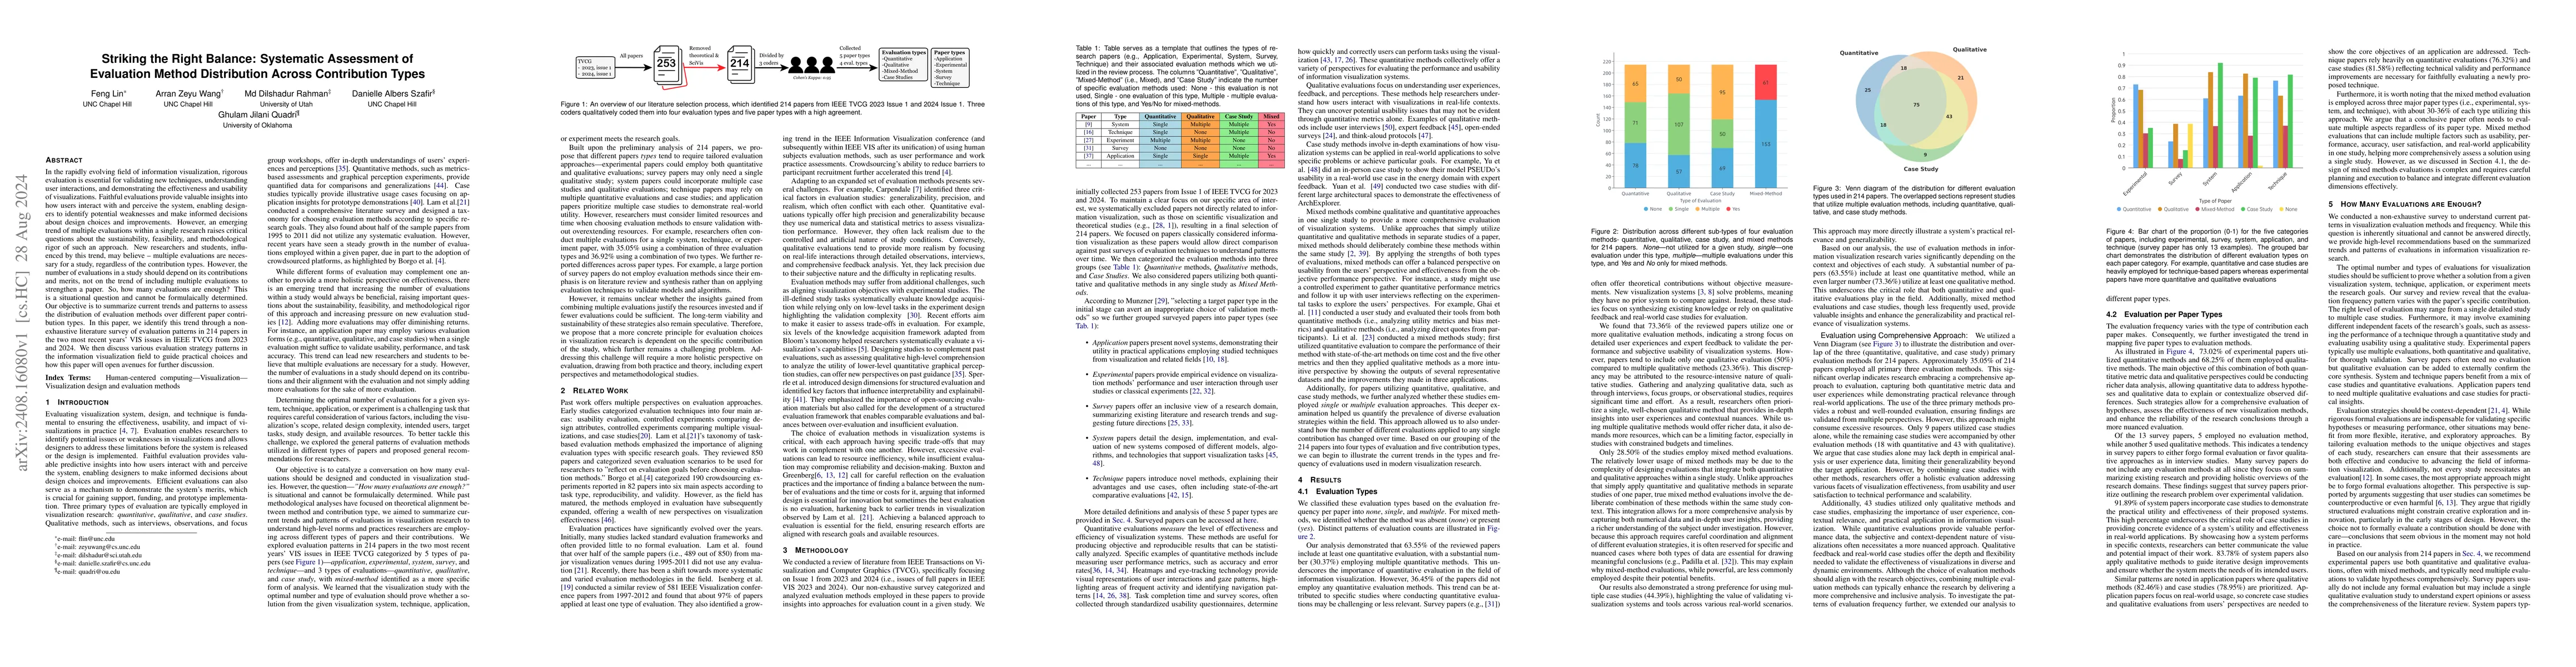
In the rapidly evolving field of information visualization, rigorous evaluation is essential for validating new techniques, understanding user interactions, and demonstrating the effectiveness and usa...
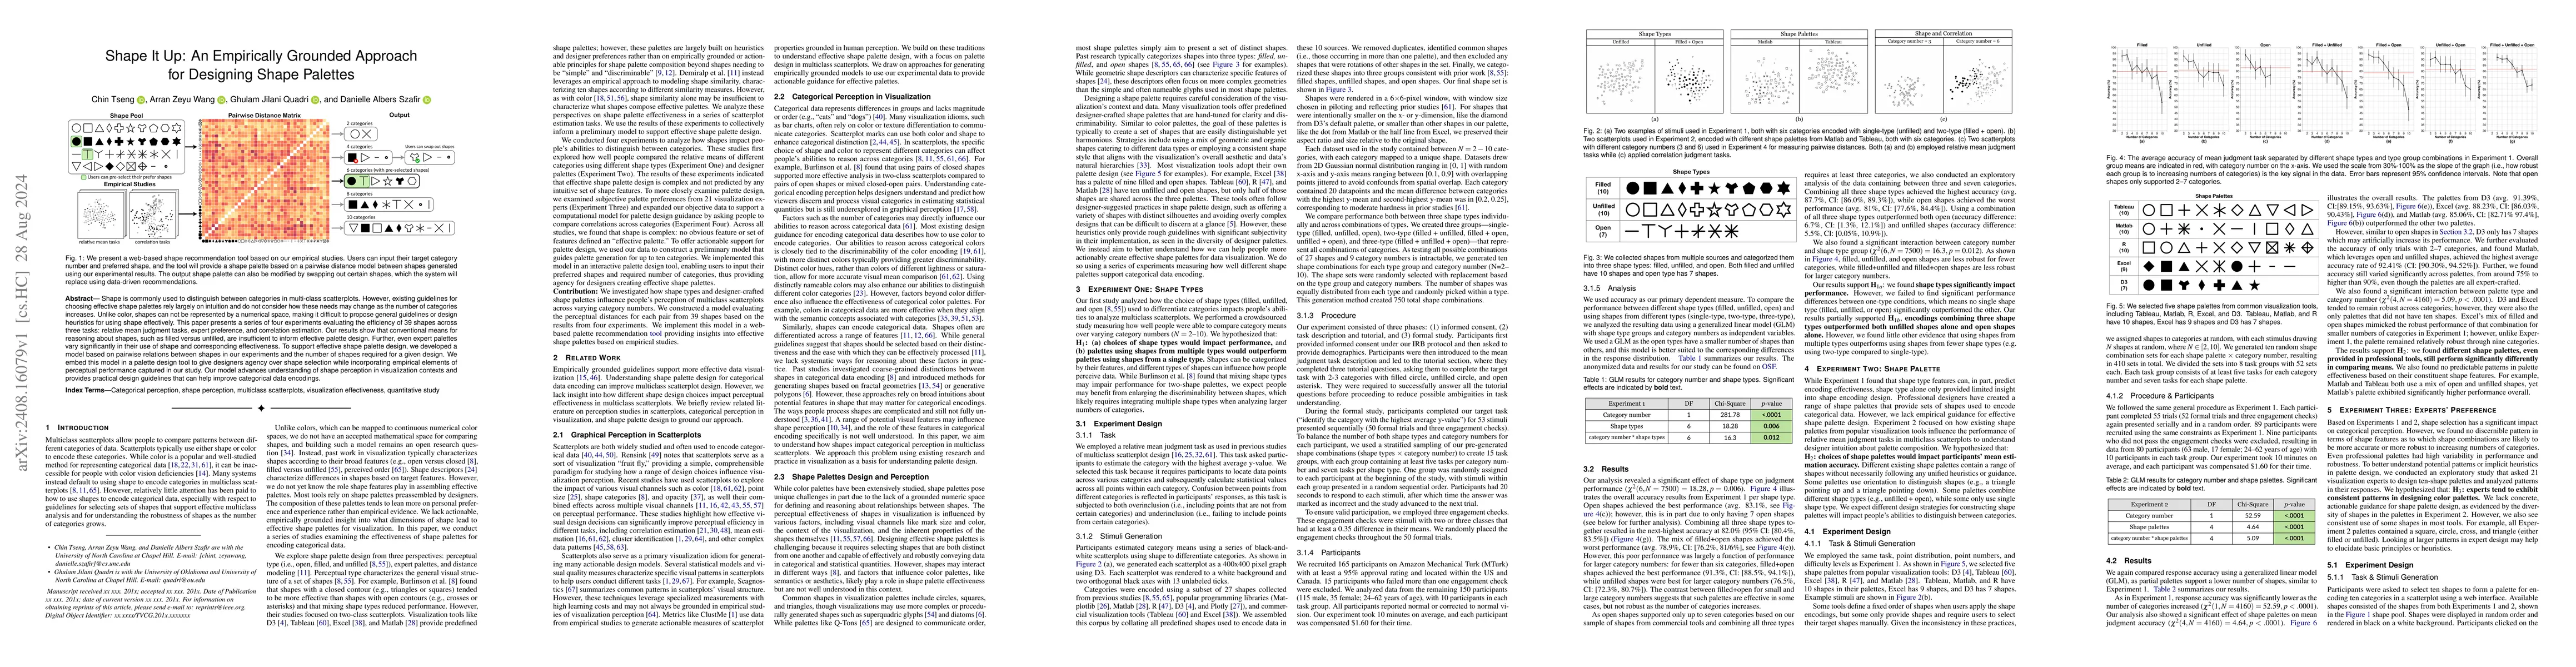
Shape is commonly used to distinguish between categories in multi-class scatterplots. However, existing guidelines for choosing effective shape palettes rely largely on intuition and do not consider h...
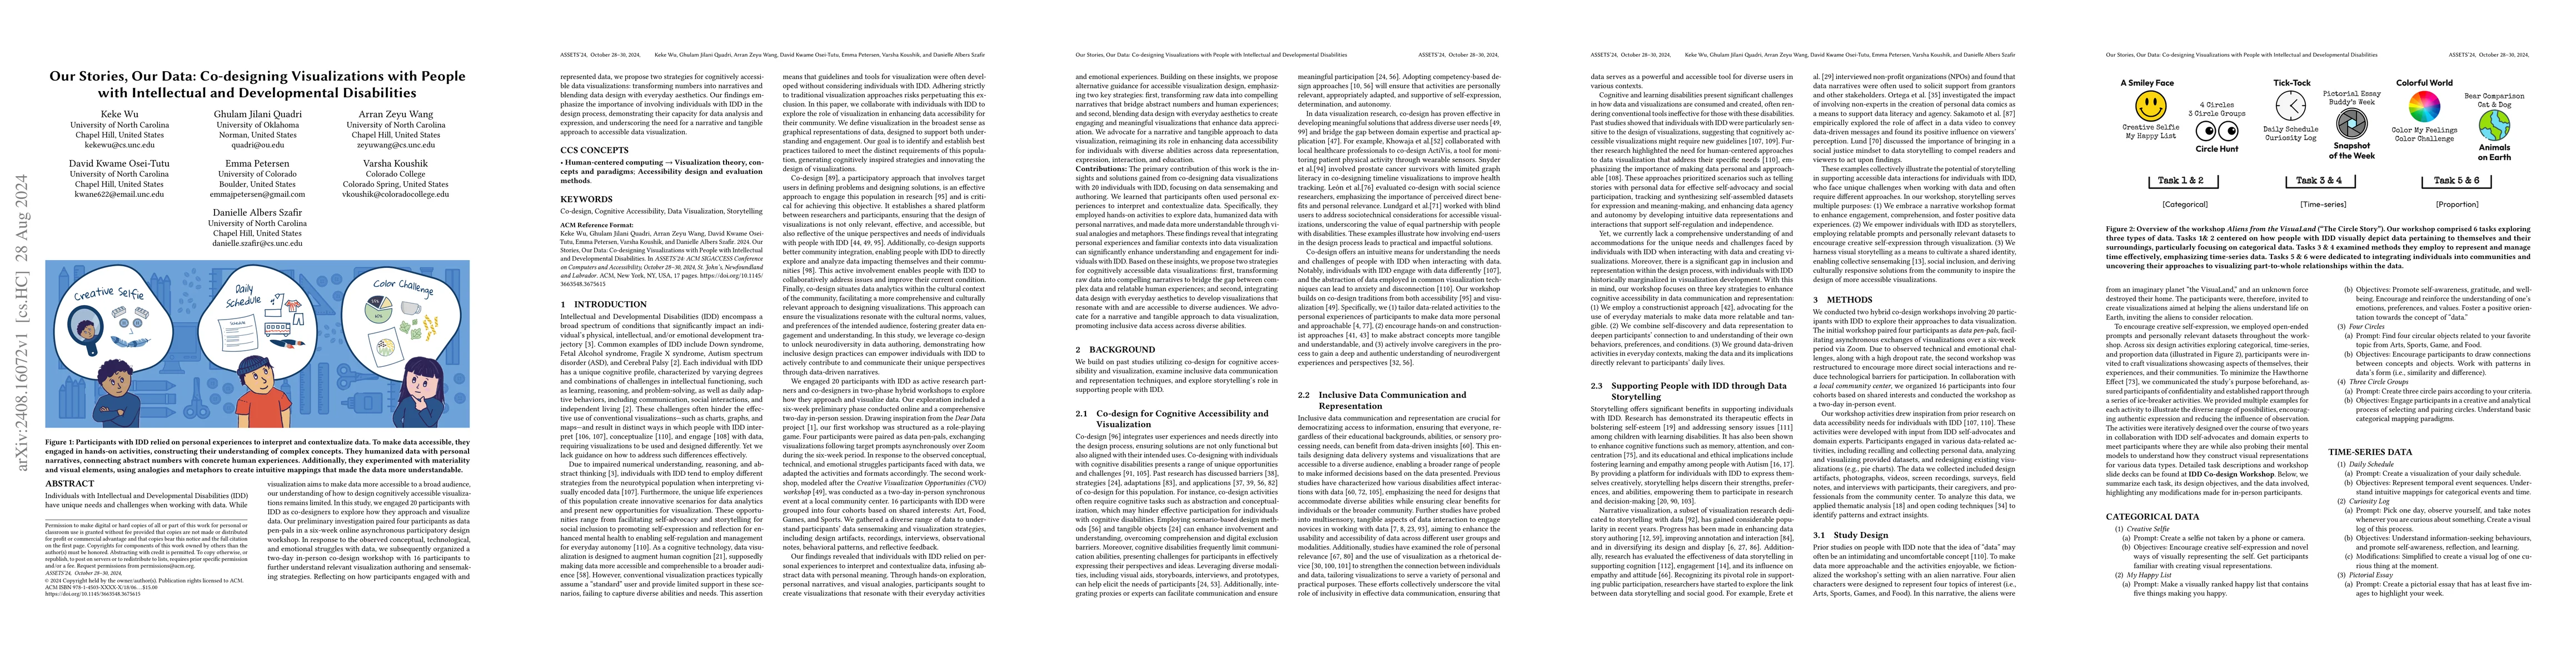
Individuals with Intellectual and Developmental Disabilities (IDD) have unique needs and challenges when working with data. While visualization aims to make data more accessible to a broad audience, o...
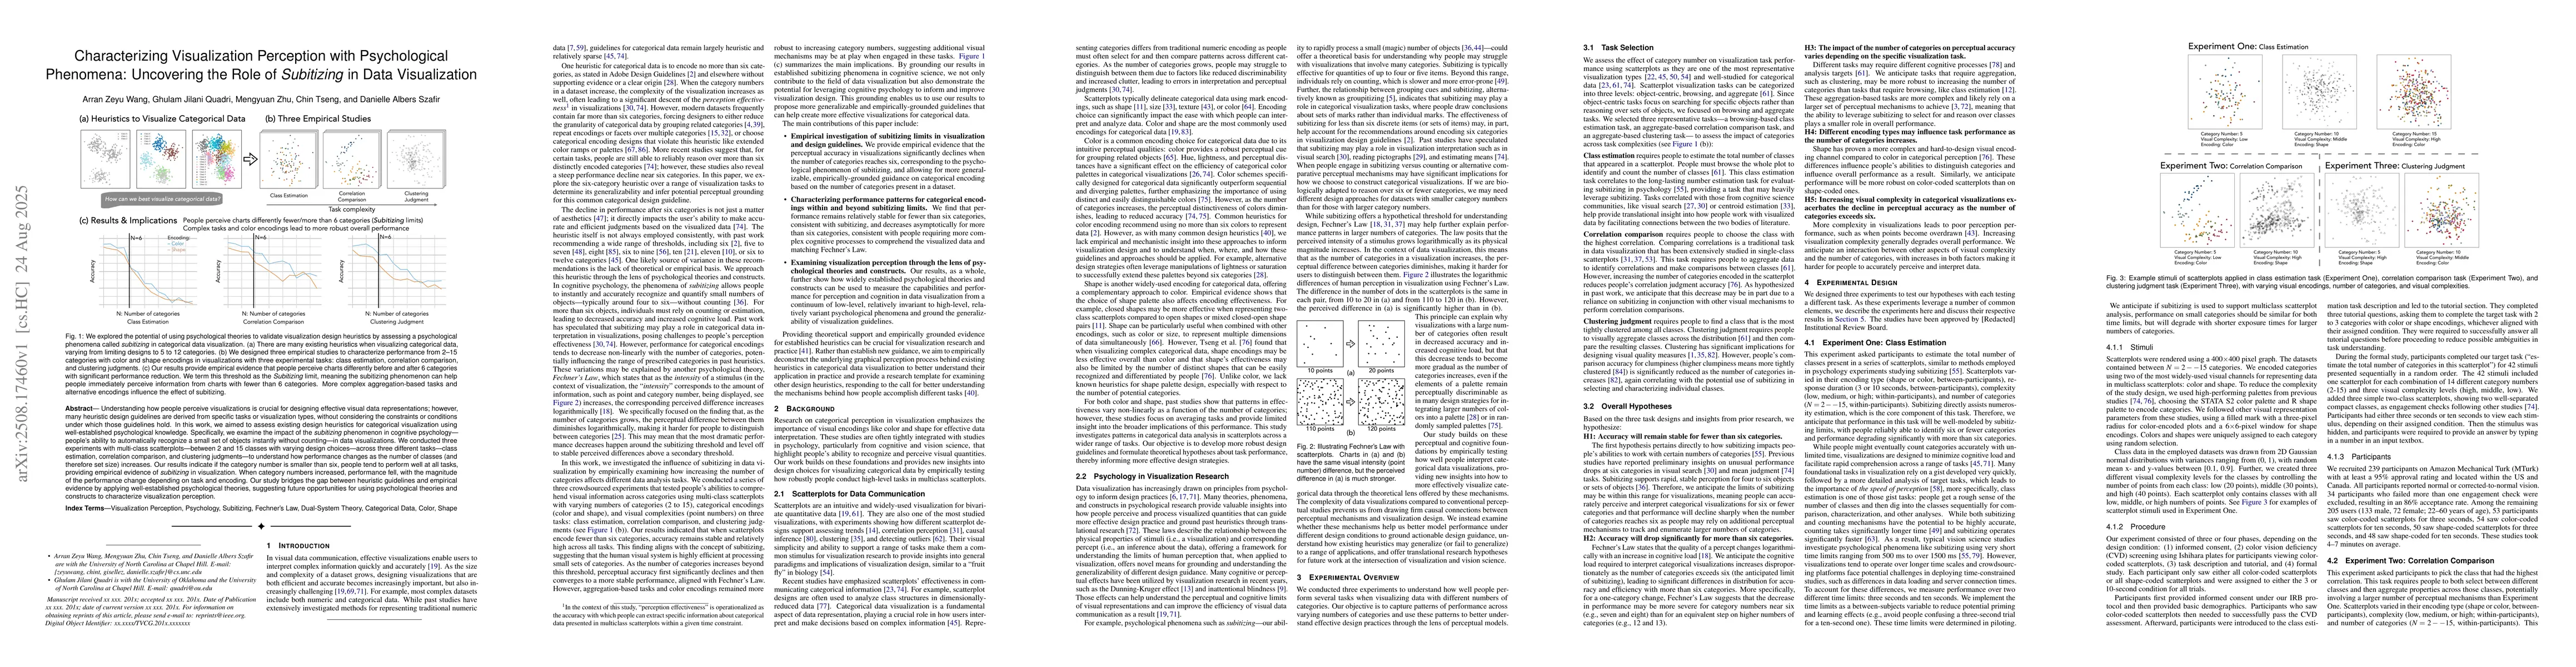
Understanding how people perceive visualizations is crucial for designing effective visual data representations; however, many heuristic design guidelines are derived from specific tasks or visualizat...
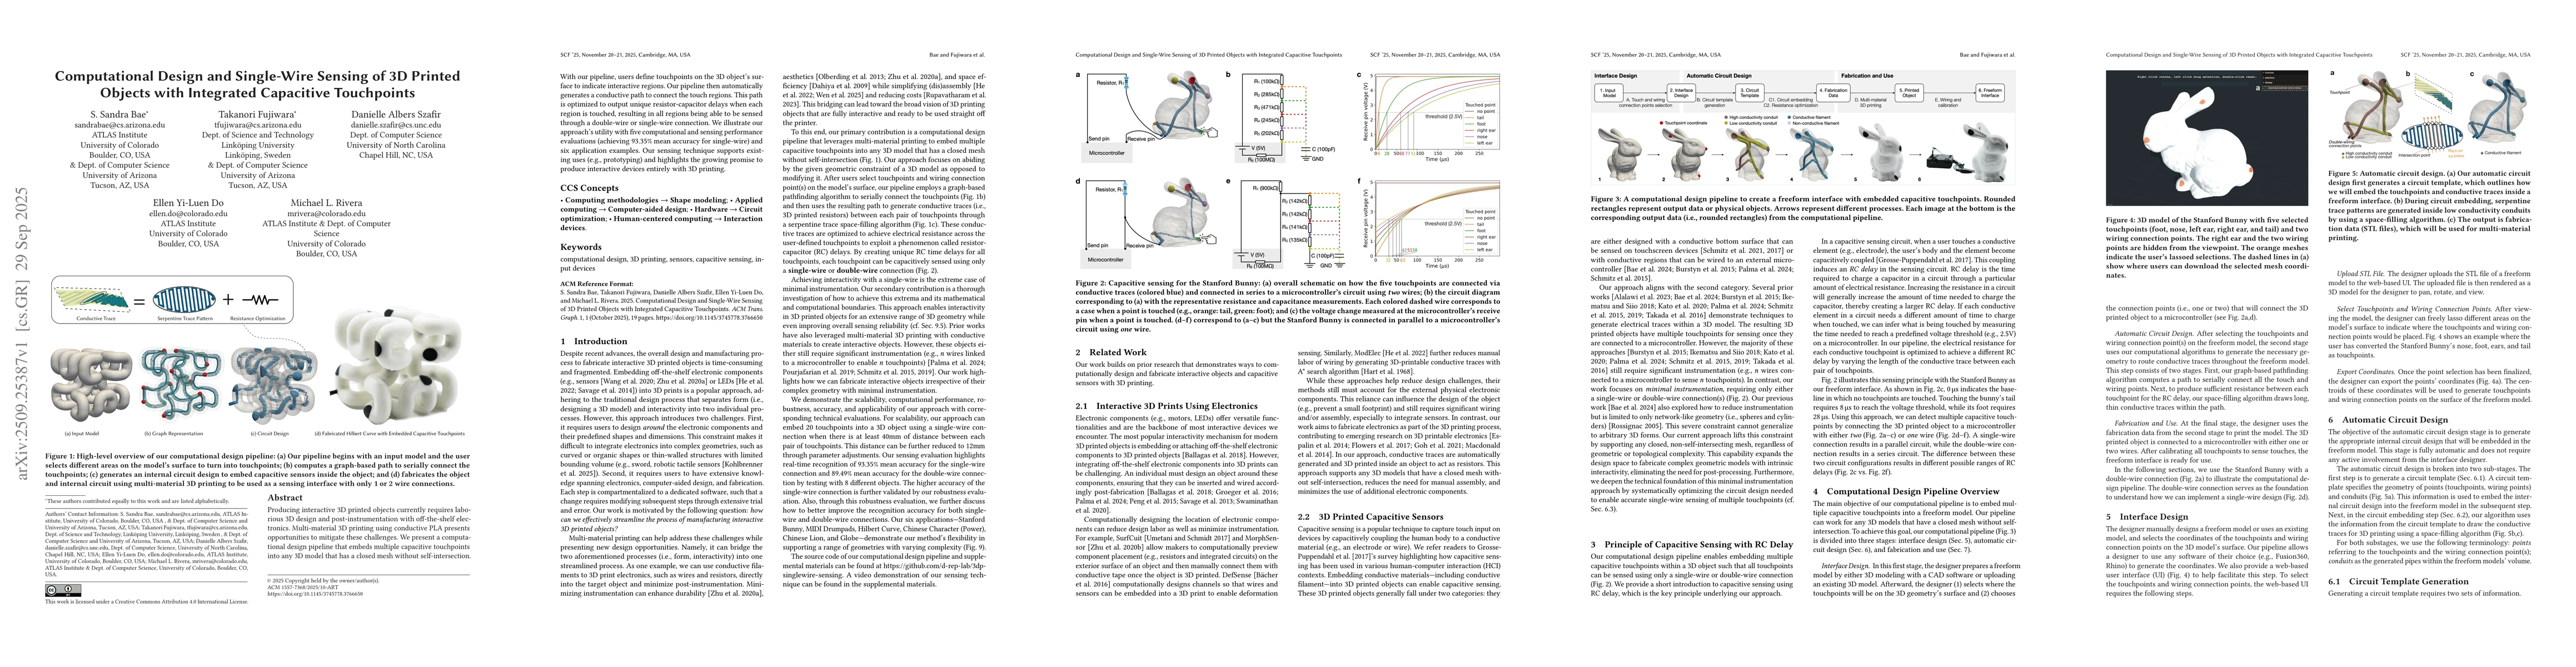
Producing interactive 3D printed objects currently requires laborious 3D design and post-instrumentation with off-the-shelf electronics. Multi-material 3D printing using conductive PLA presents opport...
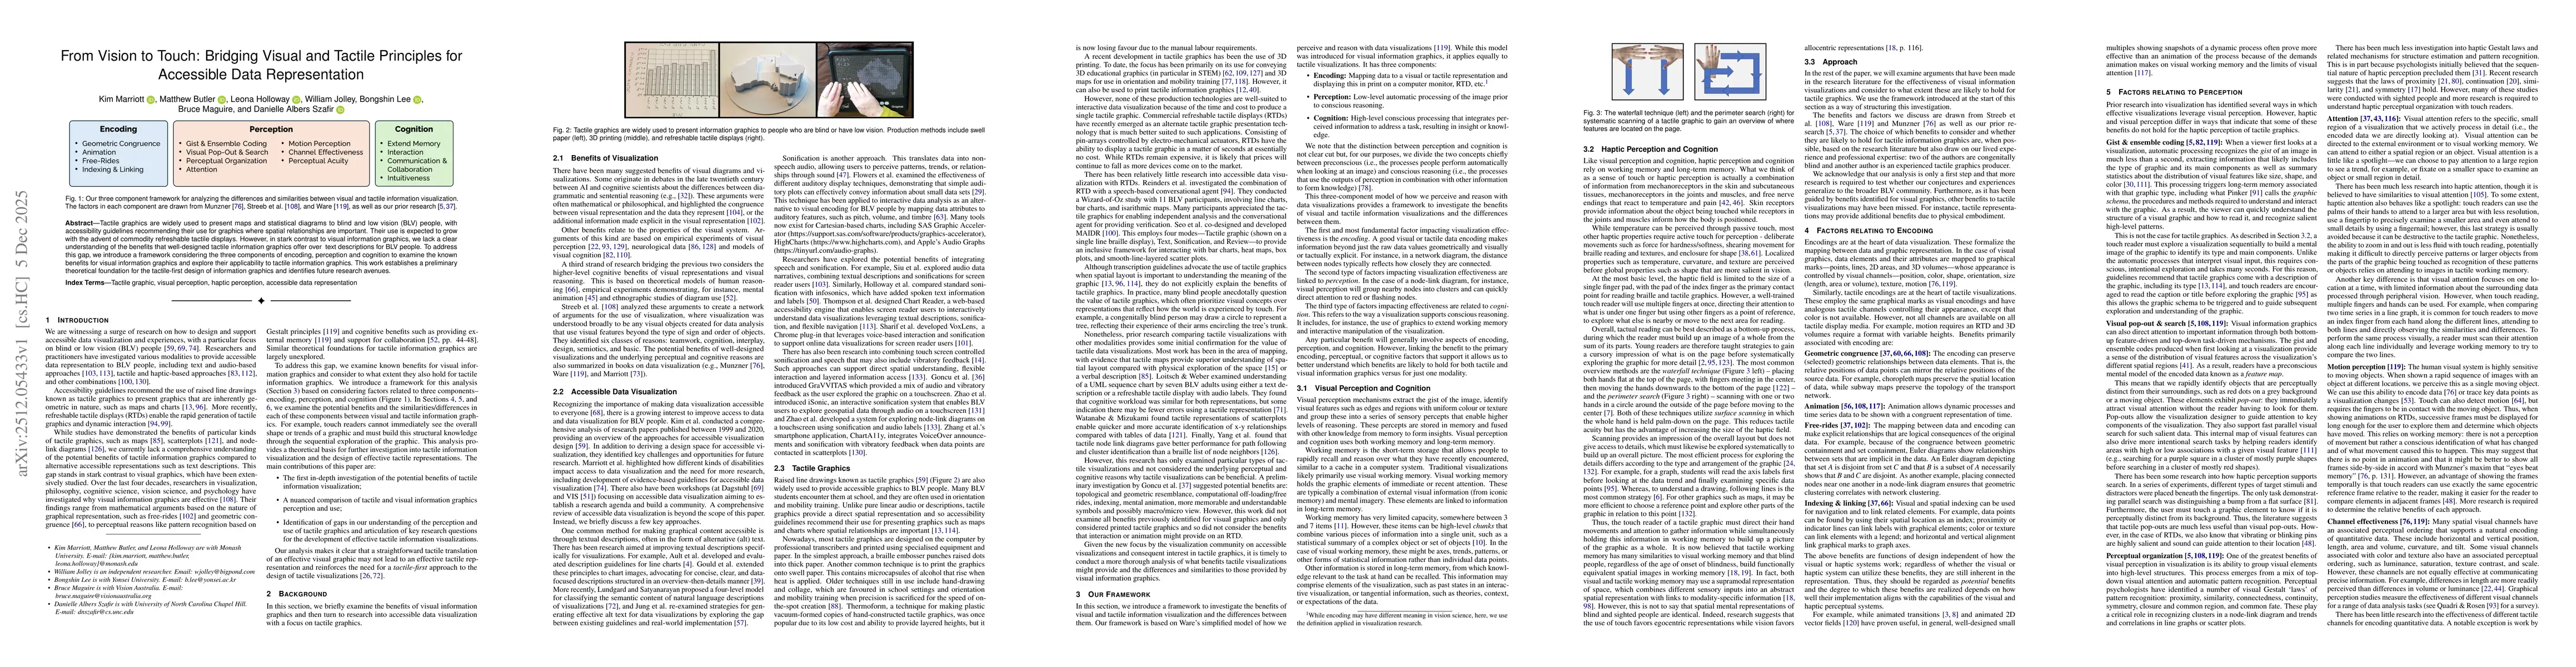
Tactile graphics are widely used to present maps and statistical diagrams to blind and low vision (BLV) people, with accessibility guidelines recommending their use for graphics where spatial relation...
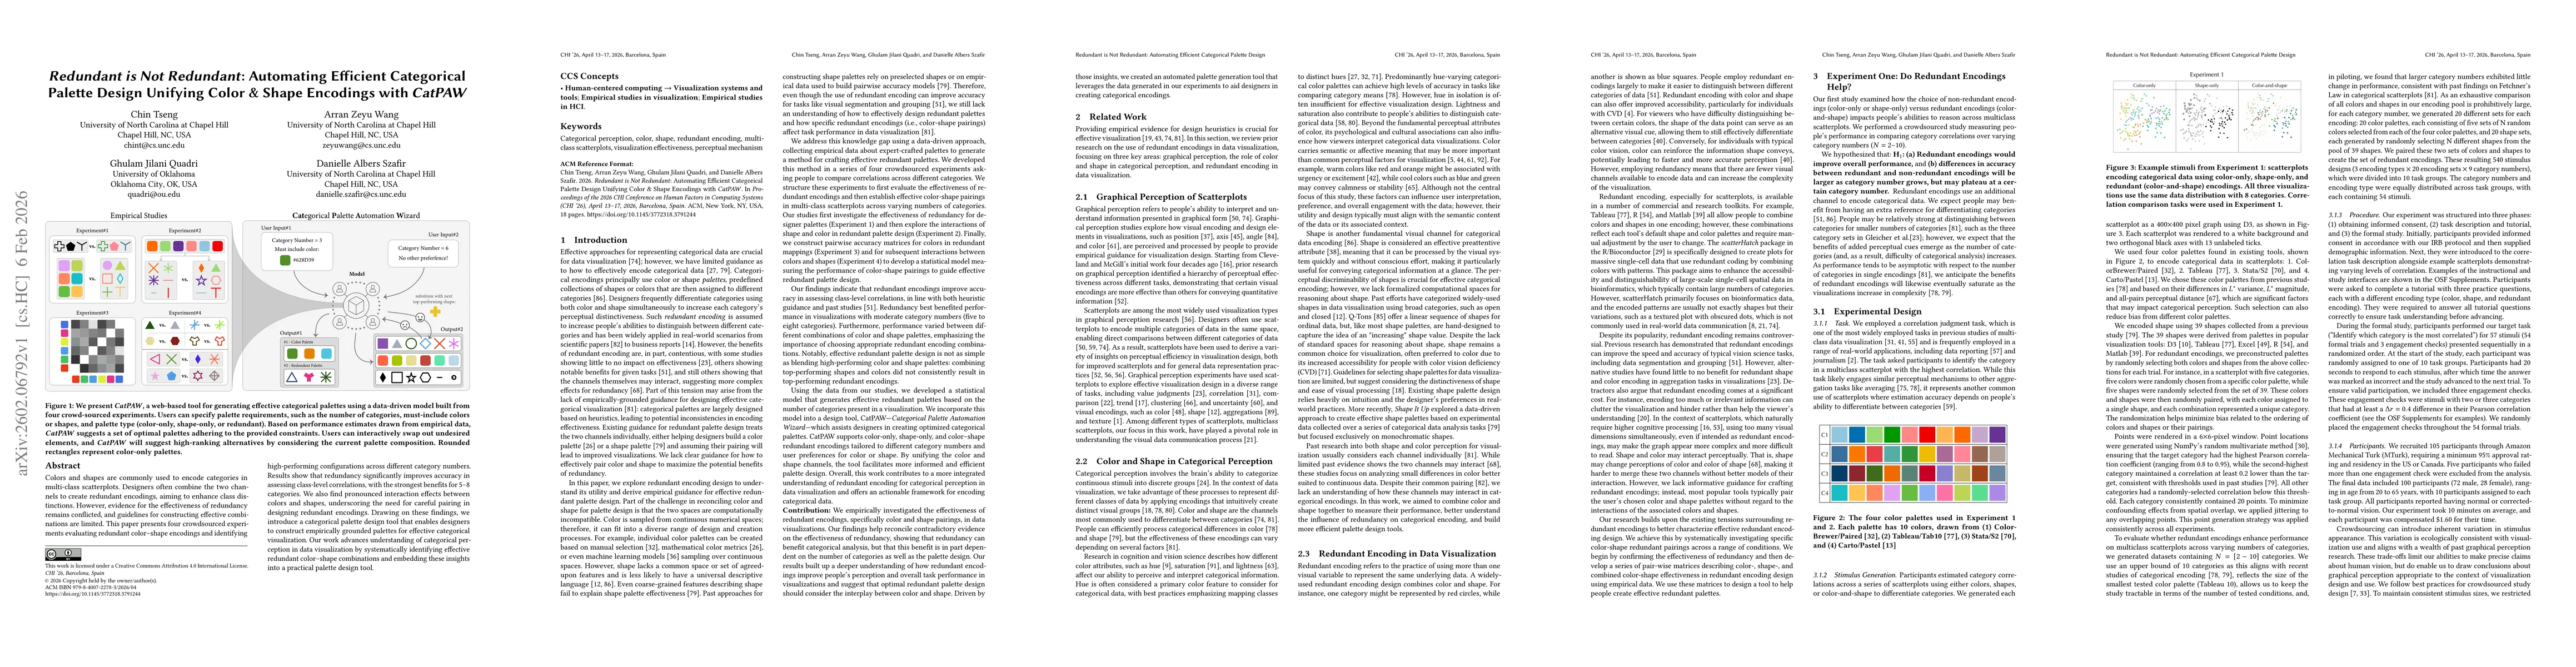
Colors and shapes are commonly used to encode categories in multi-class scatterplots. Designers often combine the two channels to create redundant encodings, aiming to enhance class distinctions. Howe...