Do You See What I See? A Qualitative Study Eliciting High-Level Visualization Comprehension
Publication
Metrics
AI Quick Summary
This qualitative study investigates how people interpret complex visualizations, finding that comprehension often diverges from designers' communicative goals. Participants' natural language descriptions of line graphs, bar graphs, and scatterplots reveal that traditional low-level tasks may not predict high-level pattern extraction, highlighting the need for a multi-perspective approach to assess visualization effectiveness.
Paper Preview
Abstract
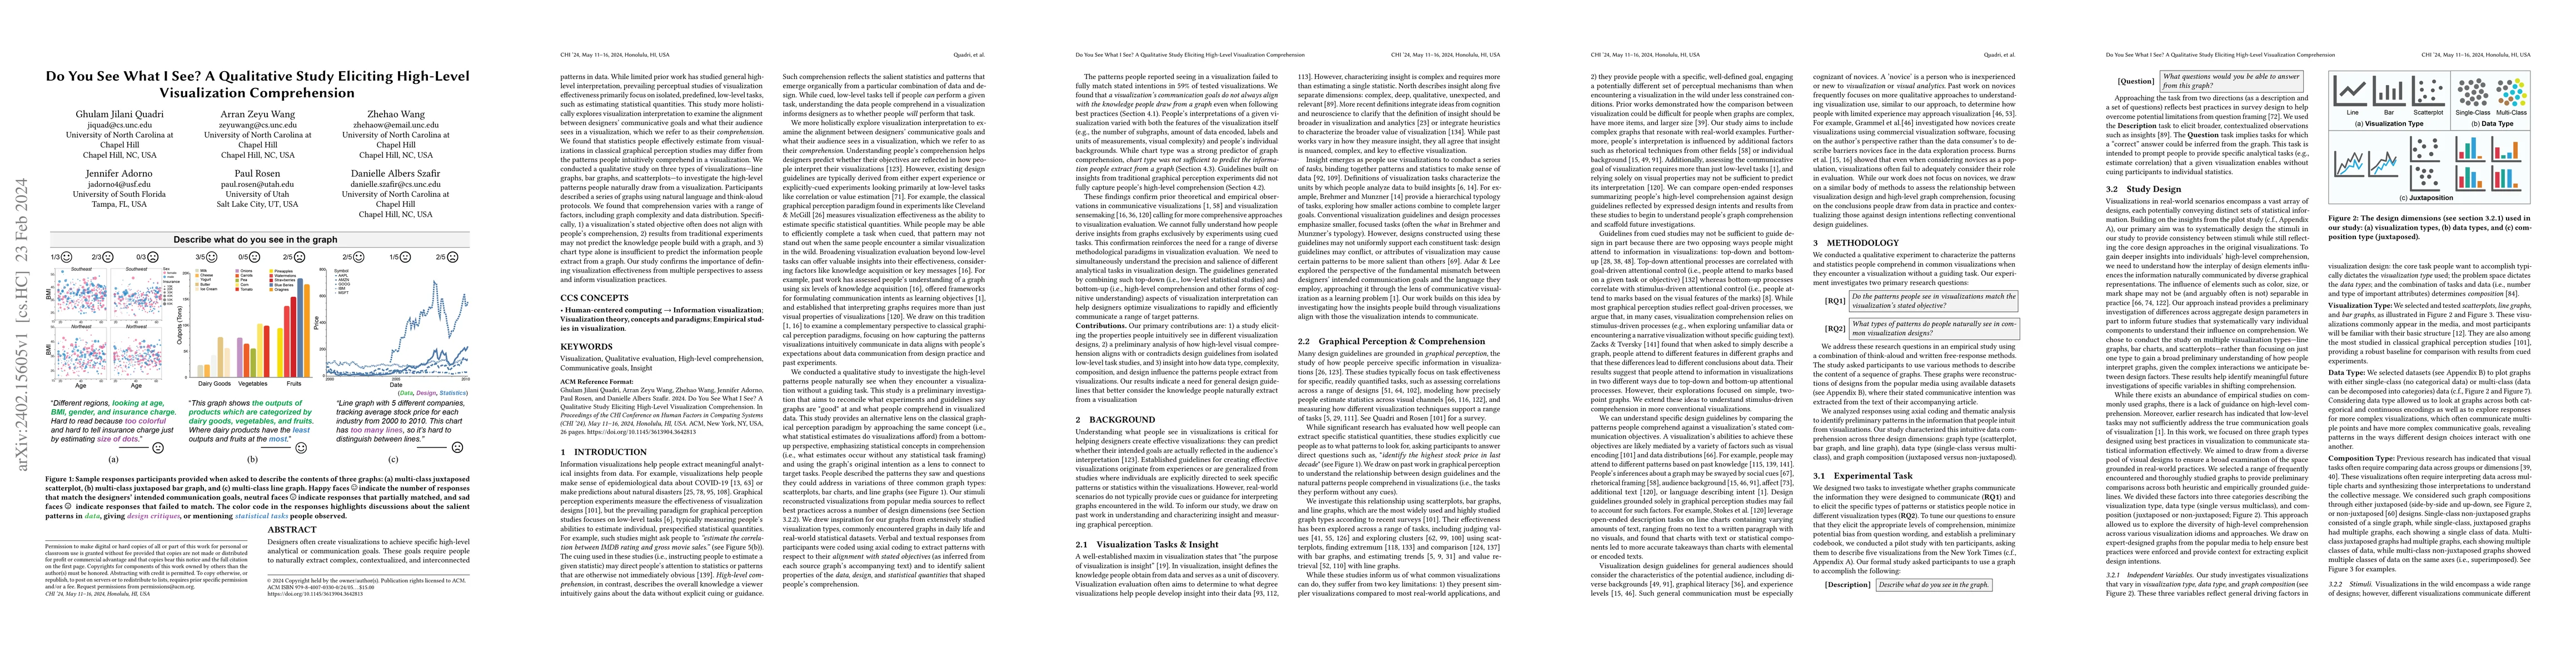
Designers often create visualizations to achieve specific high-level analytical or communication goals. These goals require people to naturally extract complex, contextualized, and interconnected patterns in data. While limited prior work has studied general high-level interpretation, prevailing perceptual studies of visualization effectiveness primarily focus on isolated, predefined, low-level tasks, such as estimating statistical quantities. This study more holistically explores visualization interpretation to examine the alignment between designers' communicative goals and what their audience sees in a visualization, which we refer to as their comprehension. We found that statistics people effectively estimate from visualizations in classical graphical perception studies may differ from the patterns people intuitively comprehend in a visualization. We conducted a qualitative study on three types of visualizations -- line graphs, bar graphs, and scatterplots -- to investigate the high-level patterns people naturally draw from a visualization. Participants described a series of graphs using natural language and think-aloud protocols. We found that comprehension varies with a range of factors, including graph complexity and data distribution. Specifically, 1) a visualization's stated objective often does not align with people's comprehension, 2) results from traditional experiments may not predict the knowledge people build with a graph, and 3) chart type alone is insufficient to predict the information people extract from a graph. Our study confirms the importance of defining visualization effectiveness from multiple perspectives to assess and inform visualization practices.
AI Key Findings
Get AI-generated insights about this paper's methodology, results, significance, and more — seven facets brought into focus.
Impact
Paper Details
Authors
PDF Preview
Key Terms
Citation Network
Current paper (gray), citations (green), references (blue)
Display is limited for performance on very large graphs.
Discussion 0