Academic Profile
Statistics
Similar Authors
Papers on arXiv
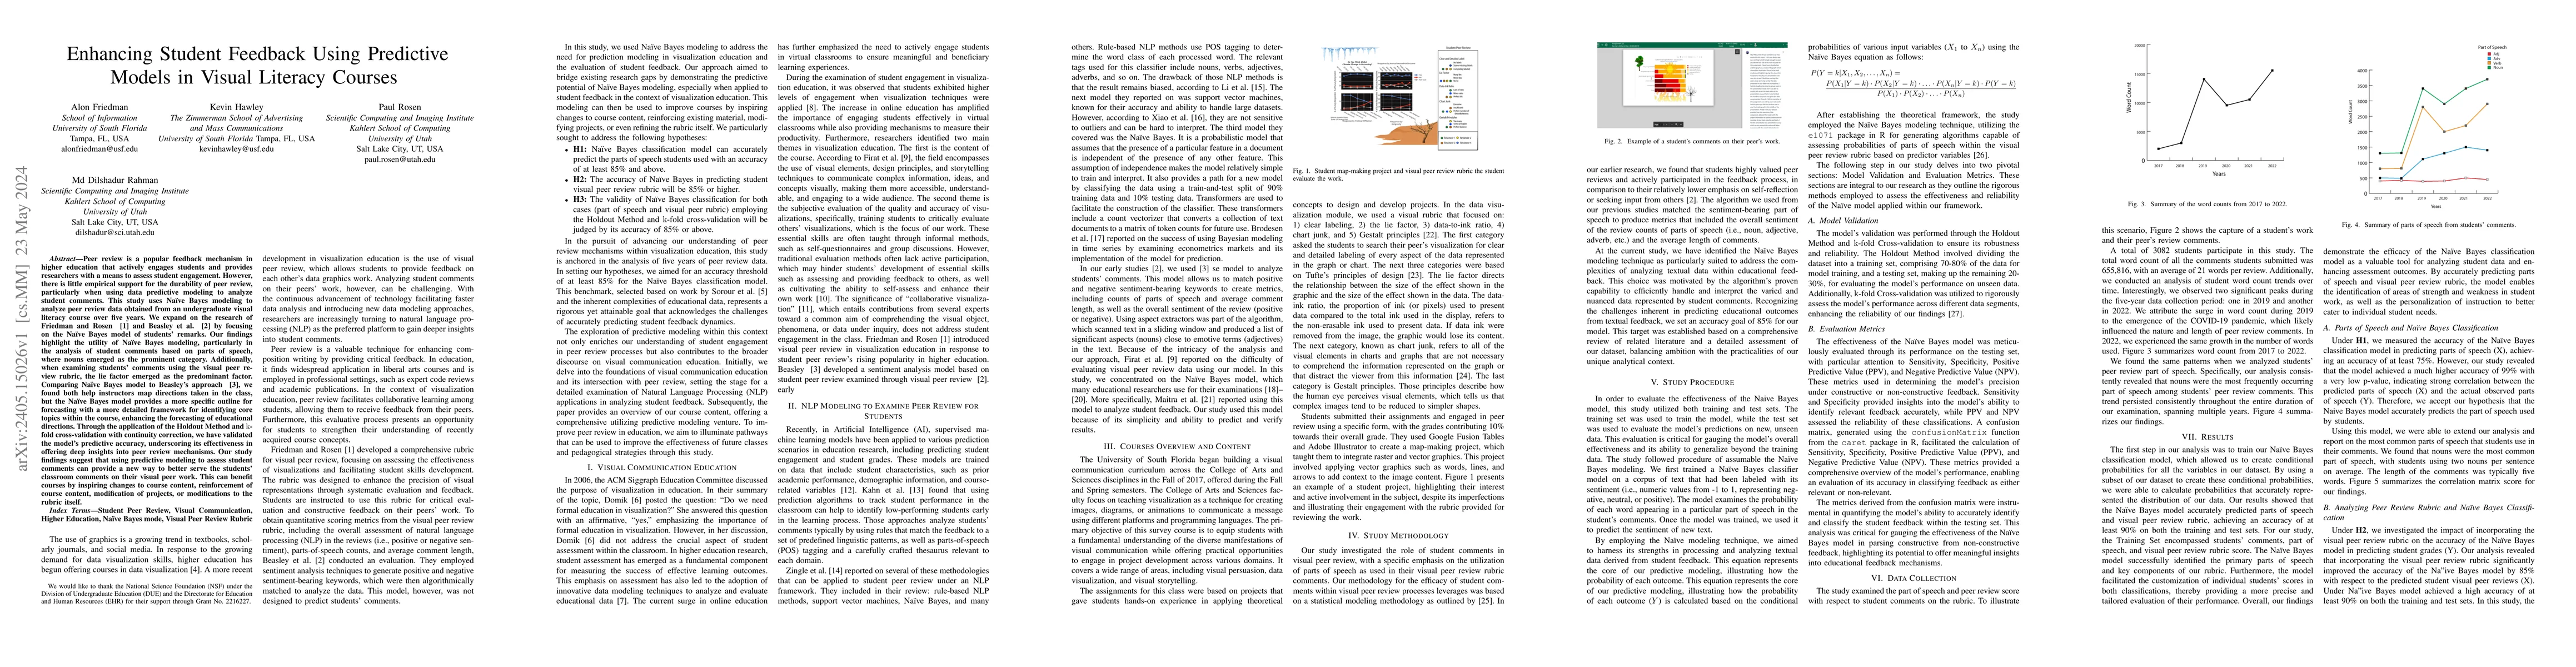
Peer review is a popular feedback mechanism in higher education that actively engages students and provides researchers with a means to assess student engagement. However, there is little empirical ...
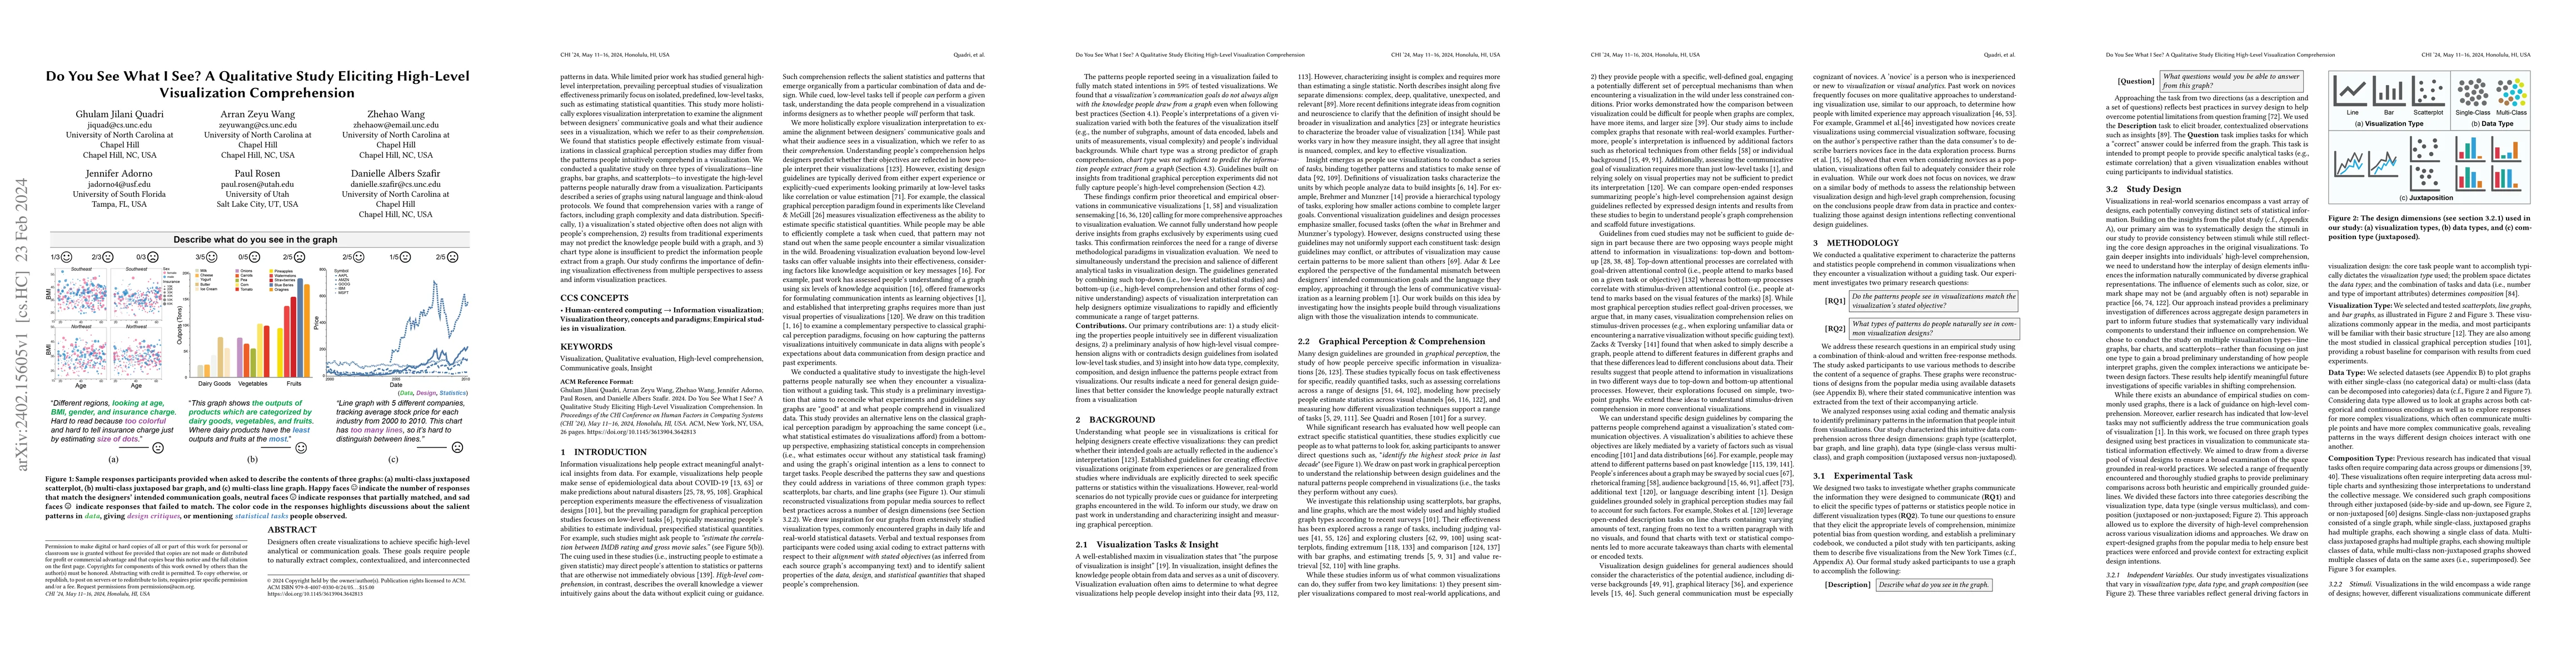
Designers often create visualizations to achieve specific high-level analytical or communication goals. These goals require people to naturally extract complex, contextualized, and interconnected pa...
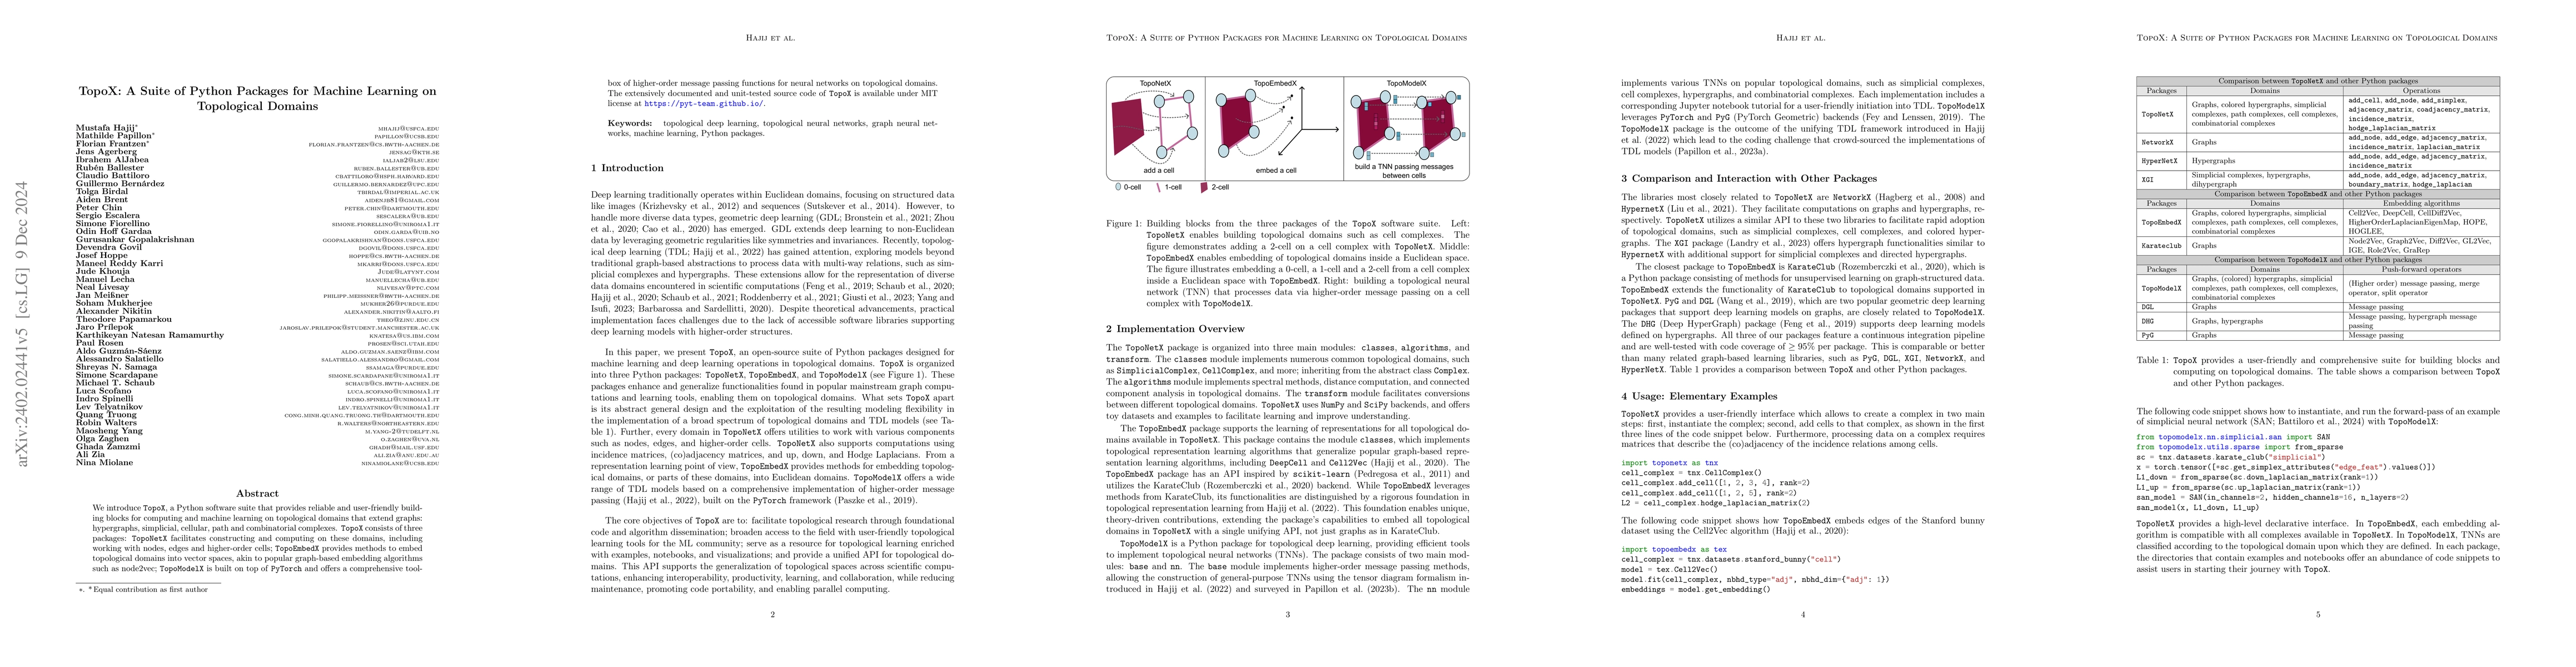
We introduce TopoX, a Python software suite that provides reliable and user-friendly building blocks for computing and machine learning on topological domains that extend graphs: hypergraphs, simpli...
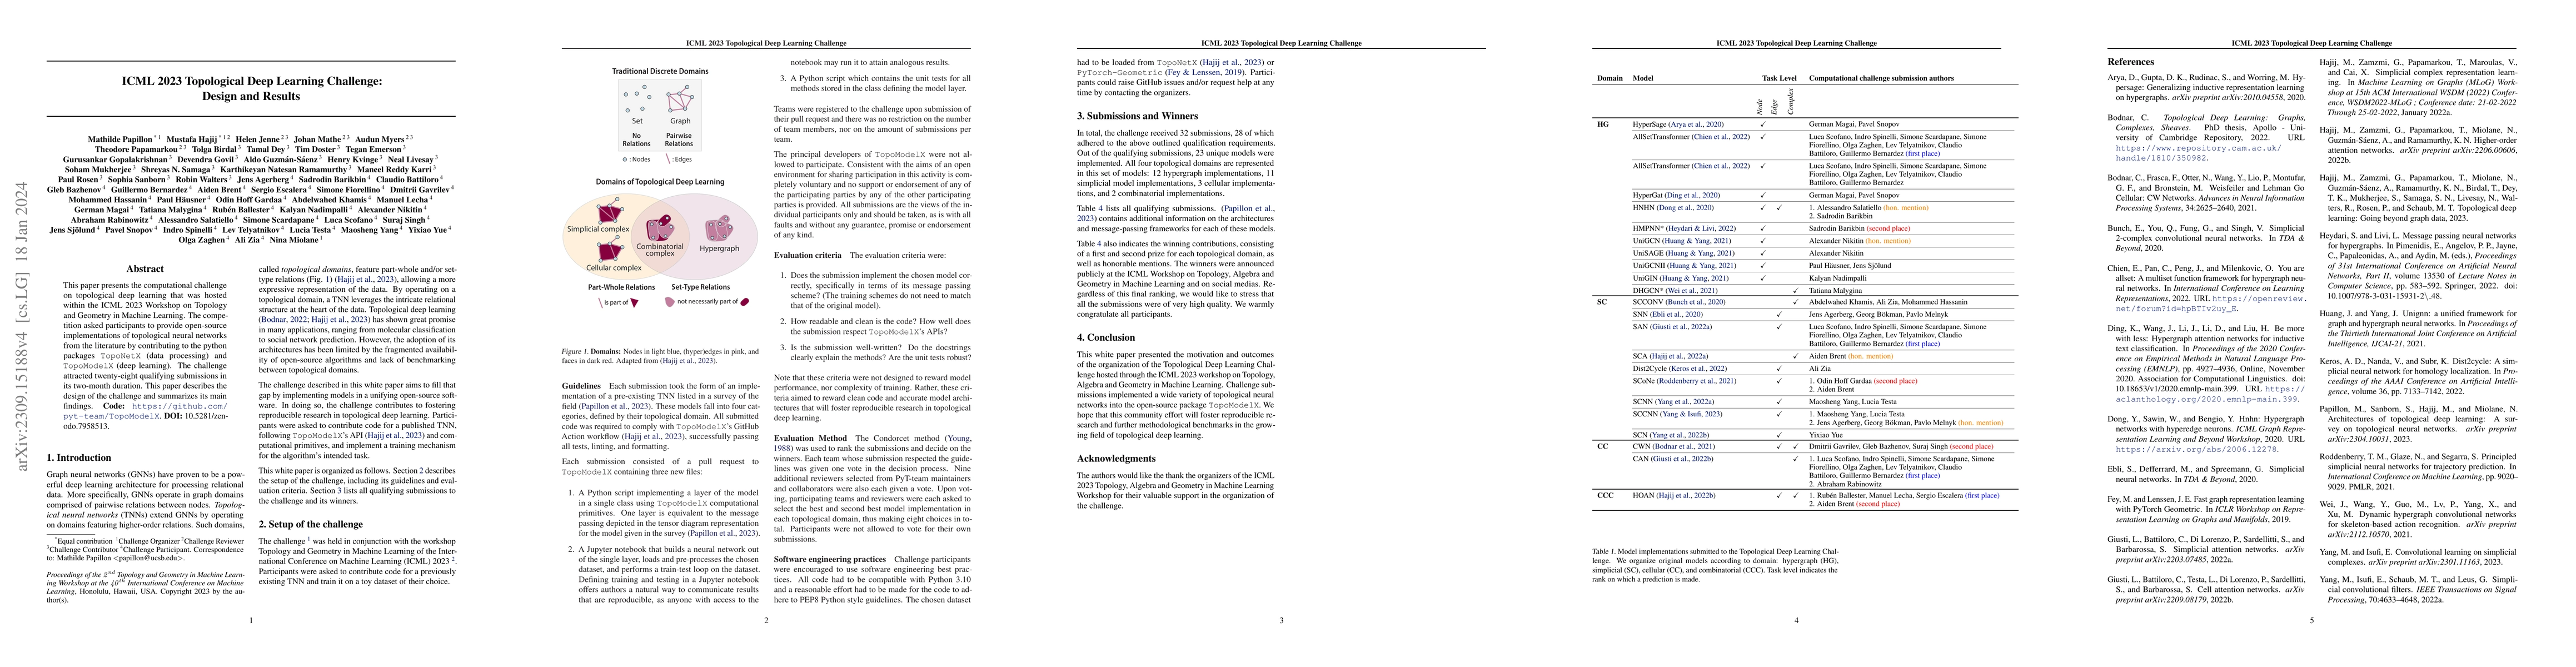
This paper presents the computational challenge on topological deep learning that was hosted within the ICML 2023 Workshop on Topology and Geometry in Machine Learning. The competition asked partici...
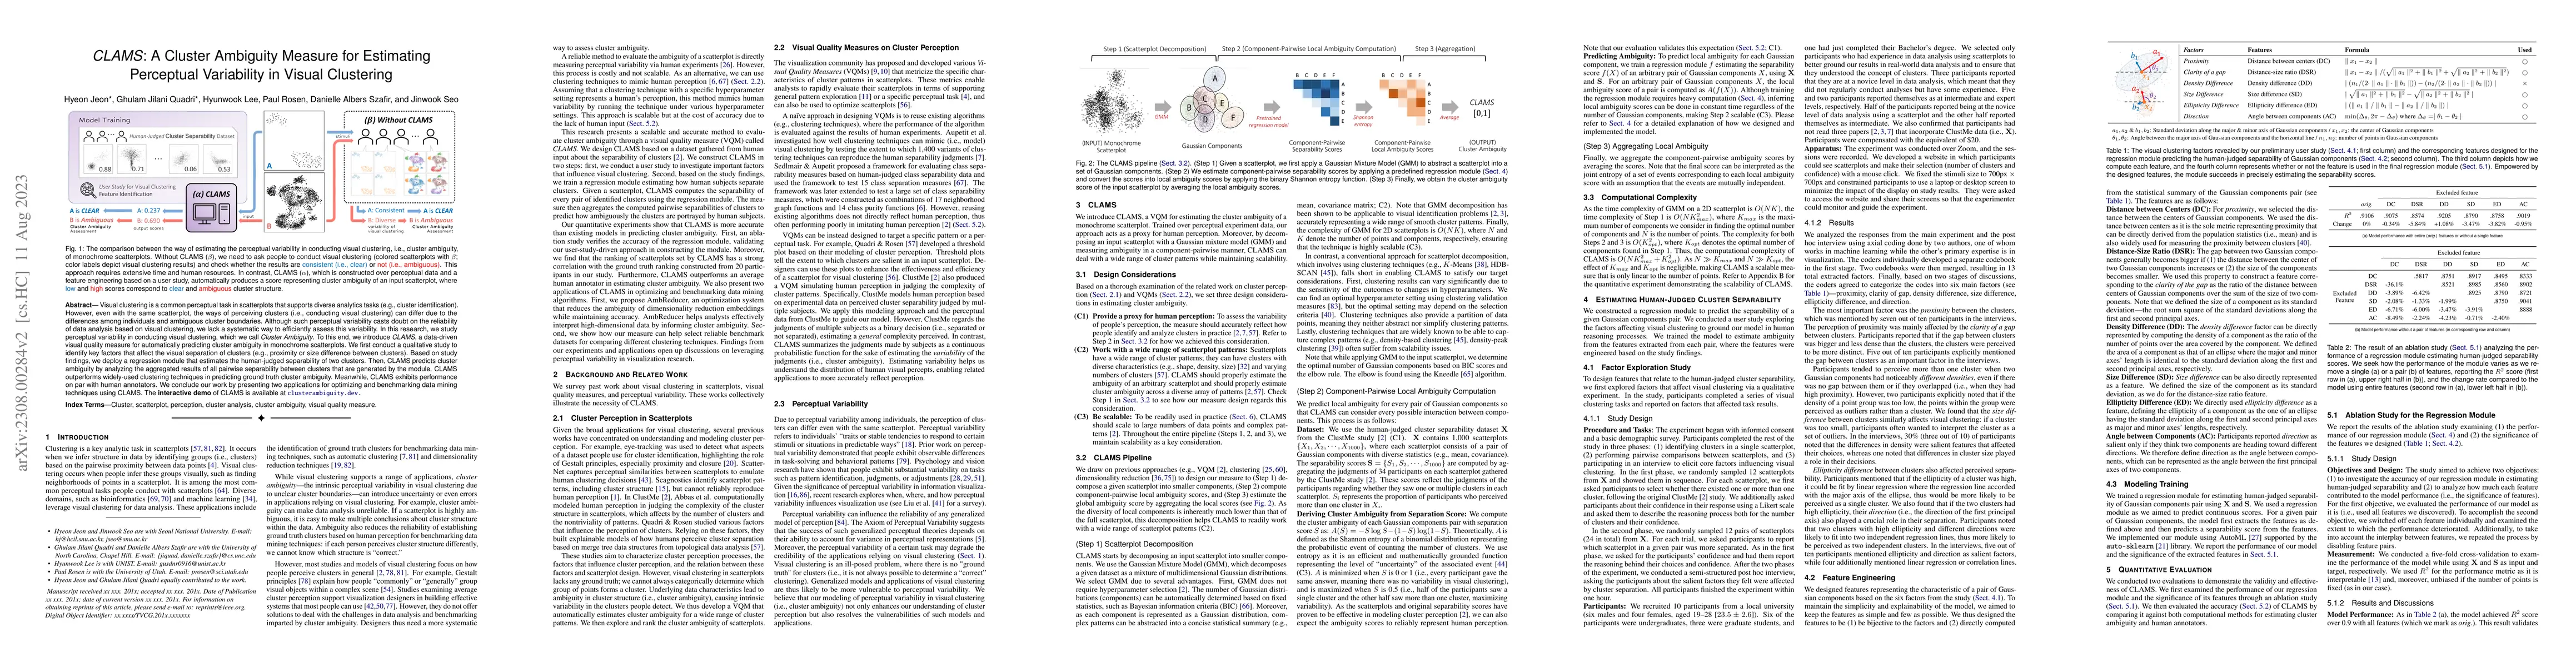
Visual clustering is a common perceptual task in scatterplots that supports diverse analytics tasks (e.g., cluster identification). However, even with the same scatterplot, the ways of perceiving cl...
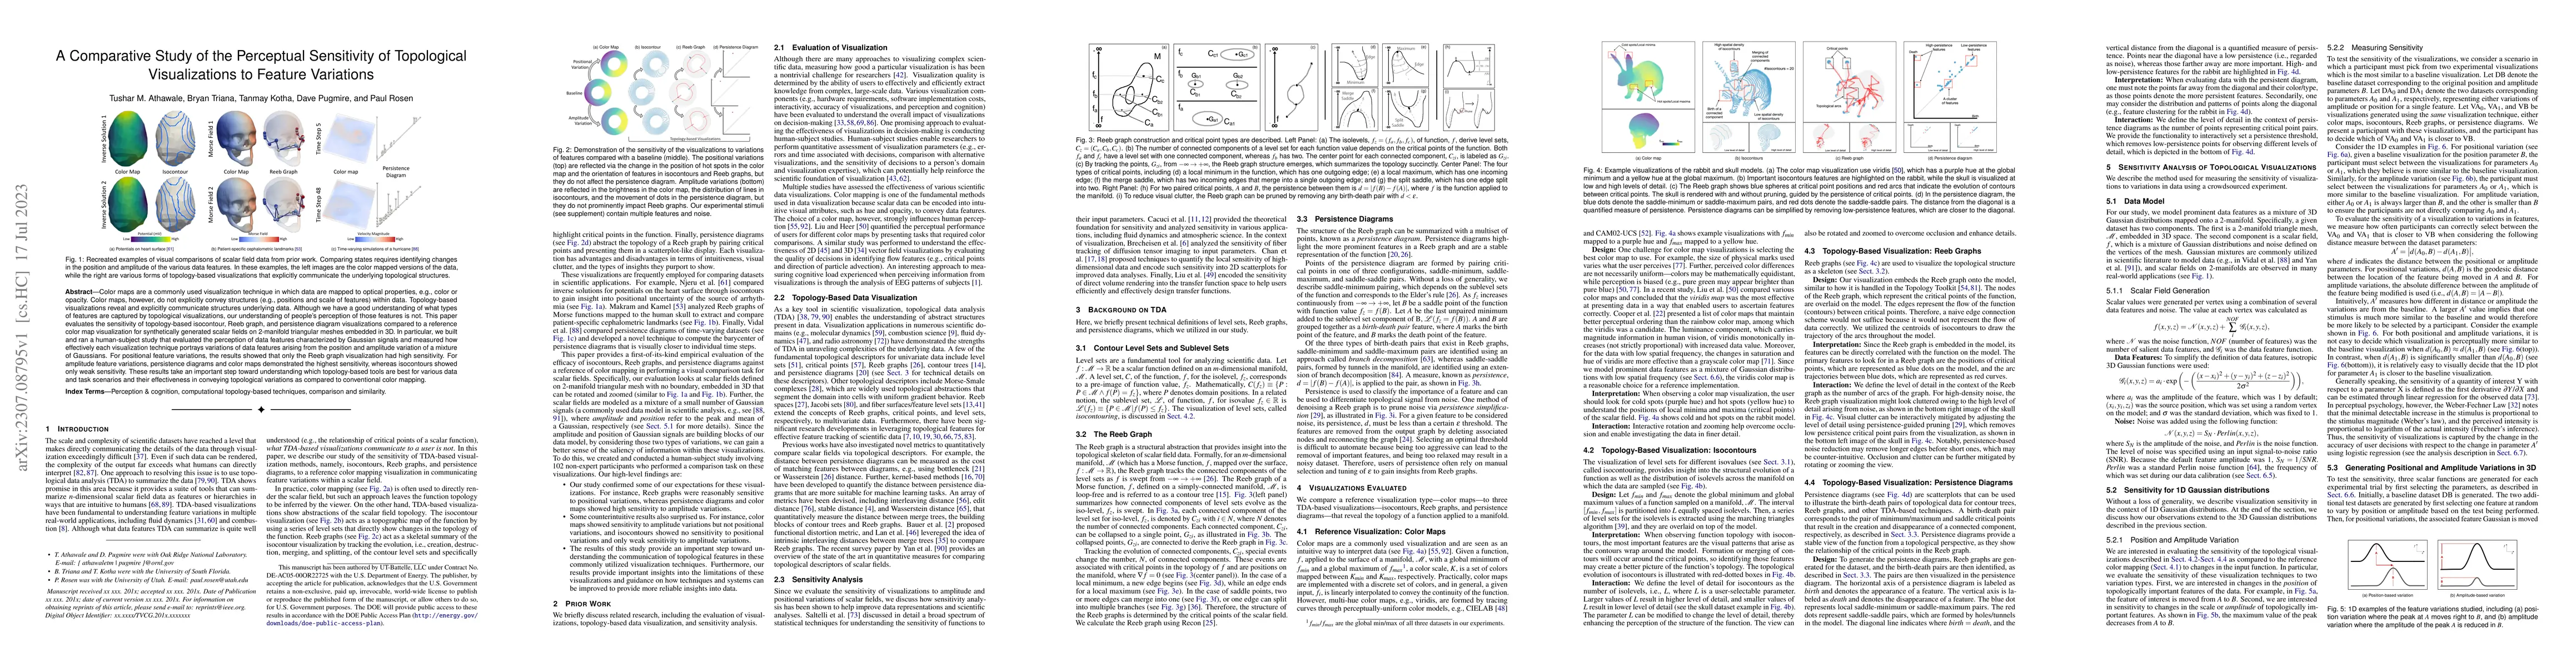
Color maps are a commonly used visualization technique in which data are mapped to optical properties, e.g., color or opacity. Color maps, however, do not explicitly convey structures (e.g., positio...
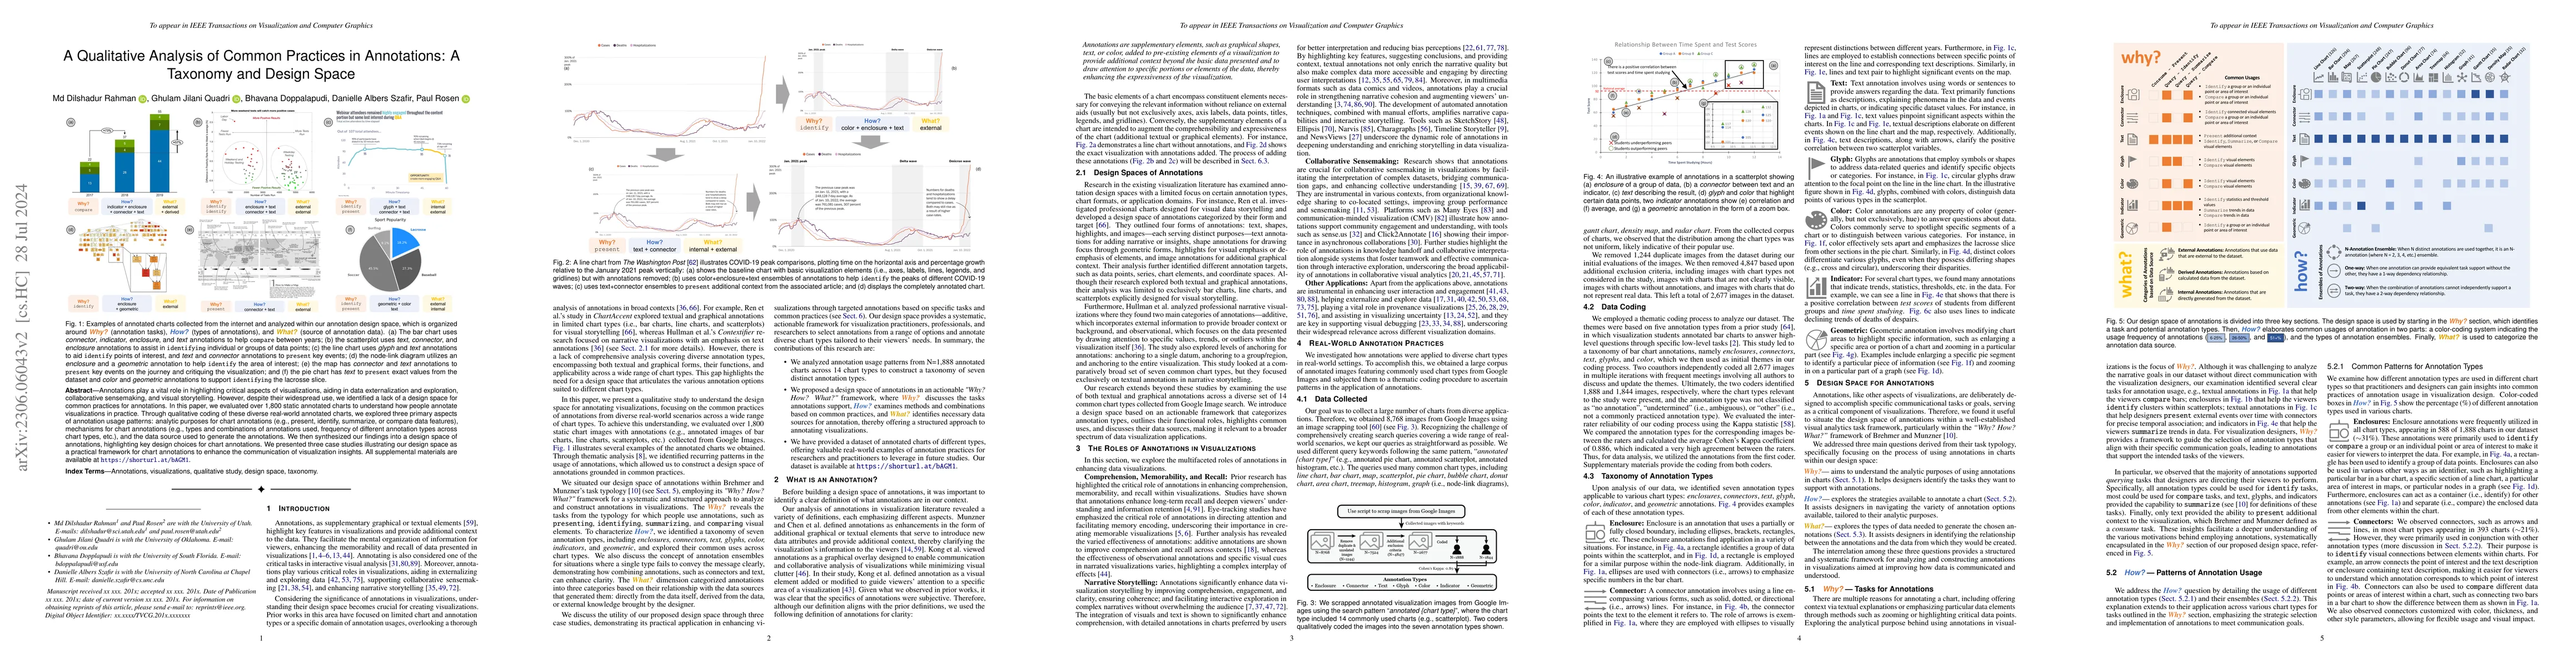
Annotations are a vital component of data externalization and collaborative analysis, directing readers' attention to important visual elements. Therefore, it is crucial to understand their design s...
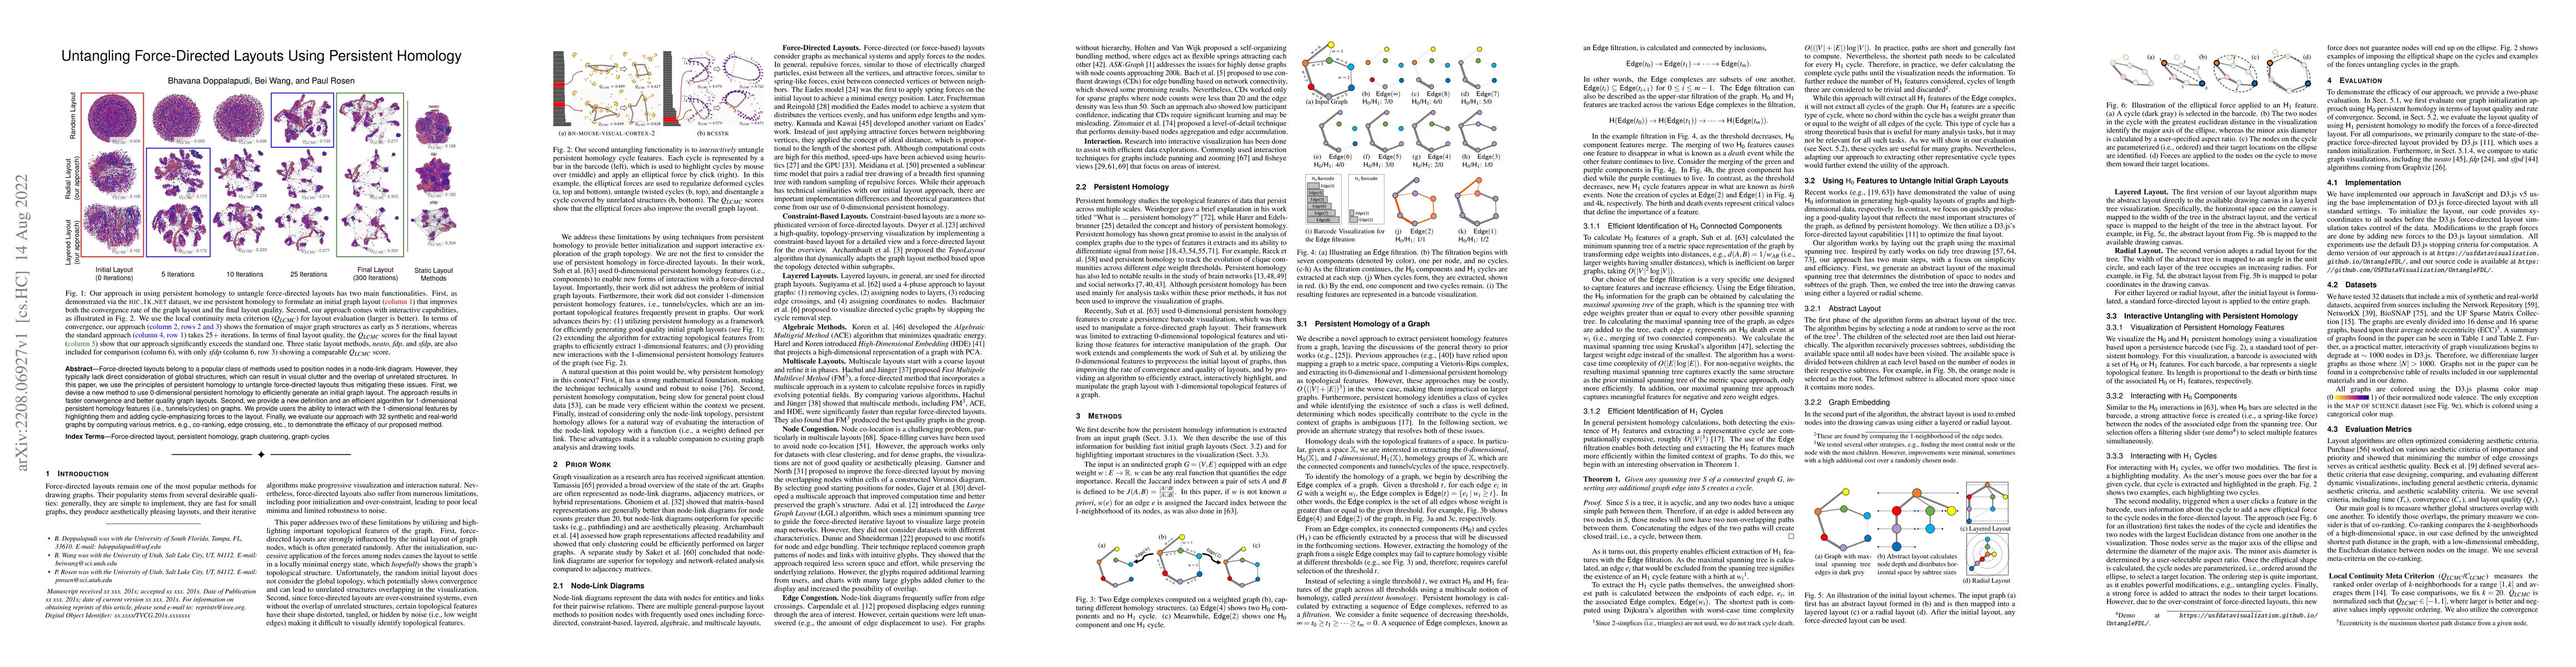
Force-directed layouts belong to a popular class of methods used to position nodes in a node-link diagram. However, they typically lack direct consideration of global structures, which can result in...
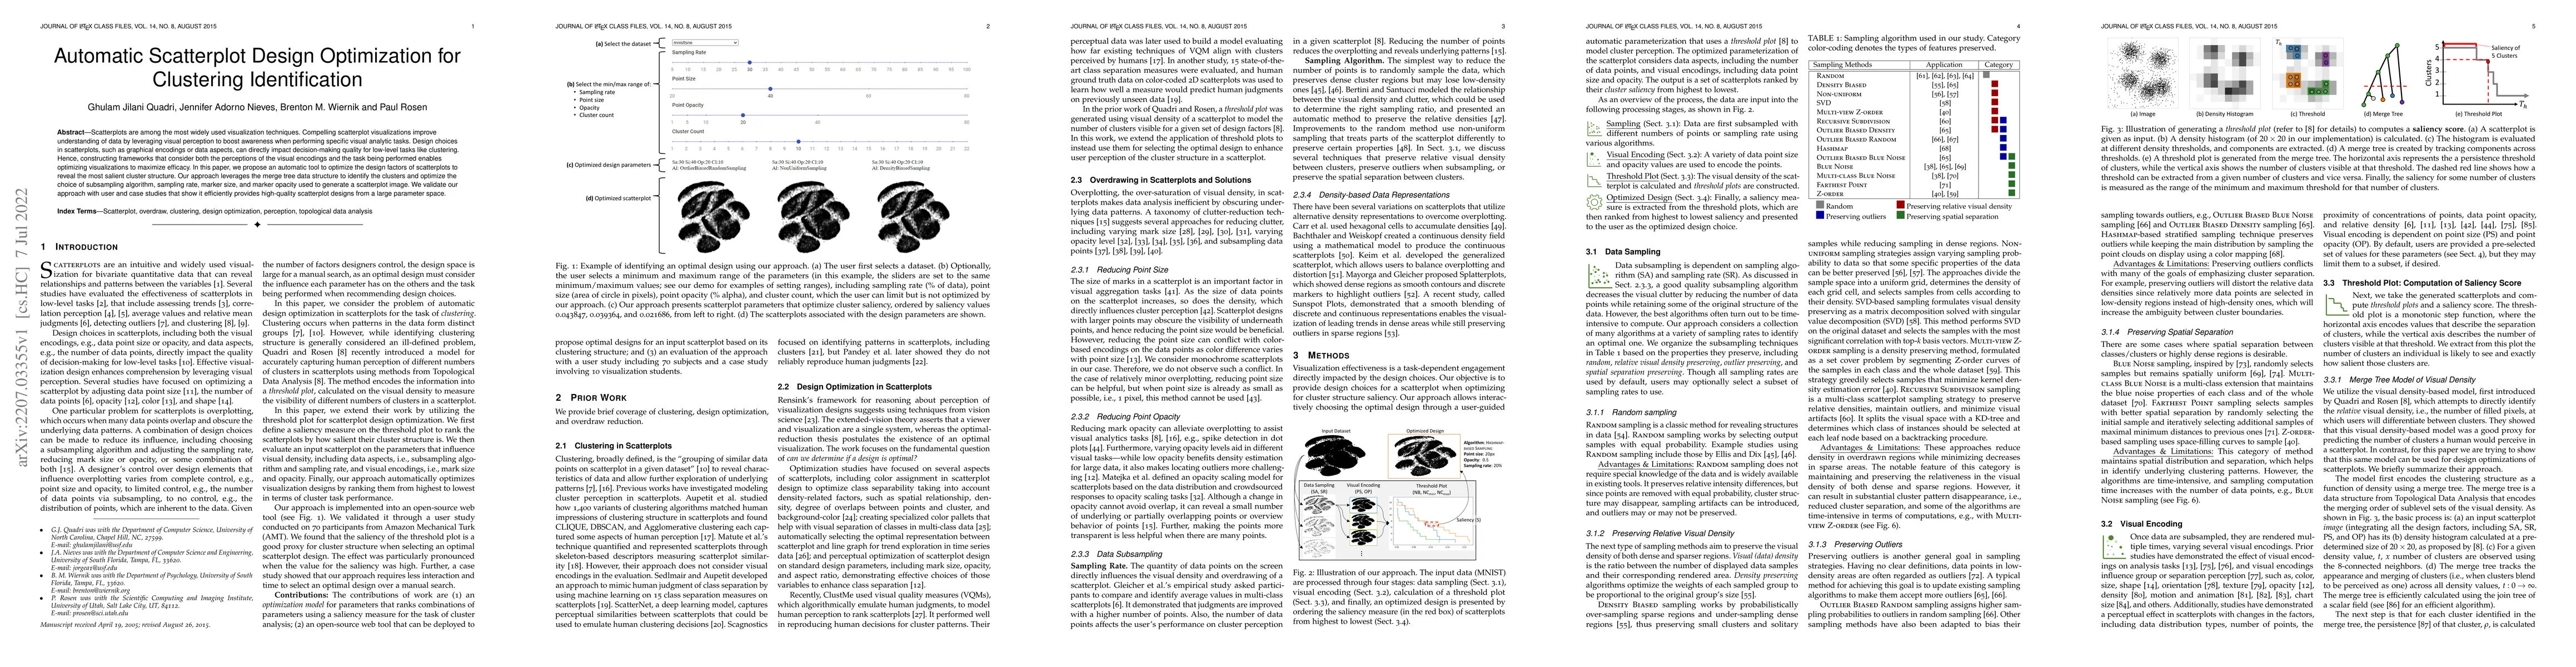
Scatterplots are among the most widely used visualization techniques. Compelling scatterplot visualizations improve understanding of data by leveraging visual perception to boost awareness when perf...
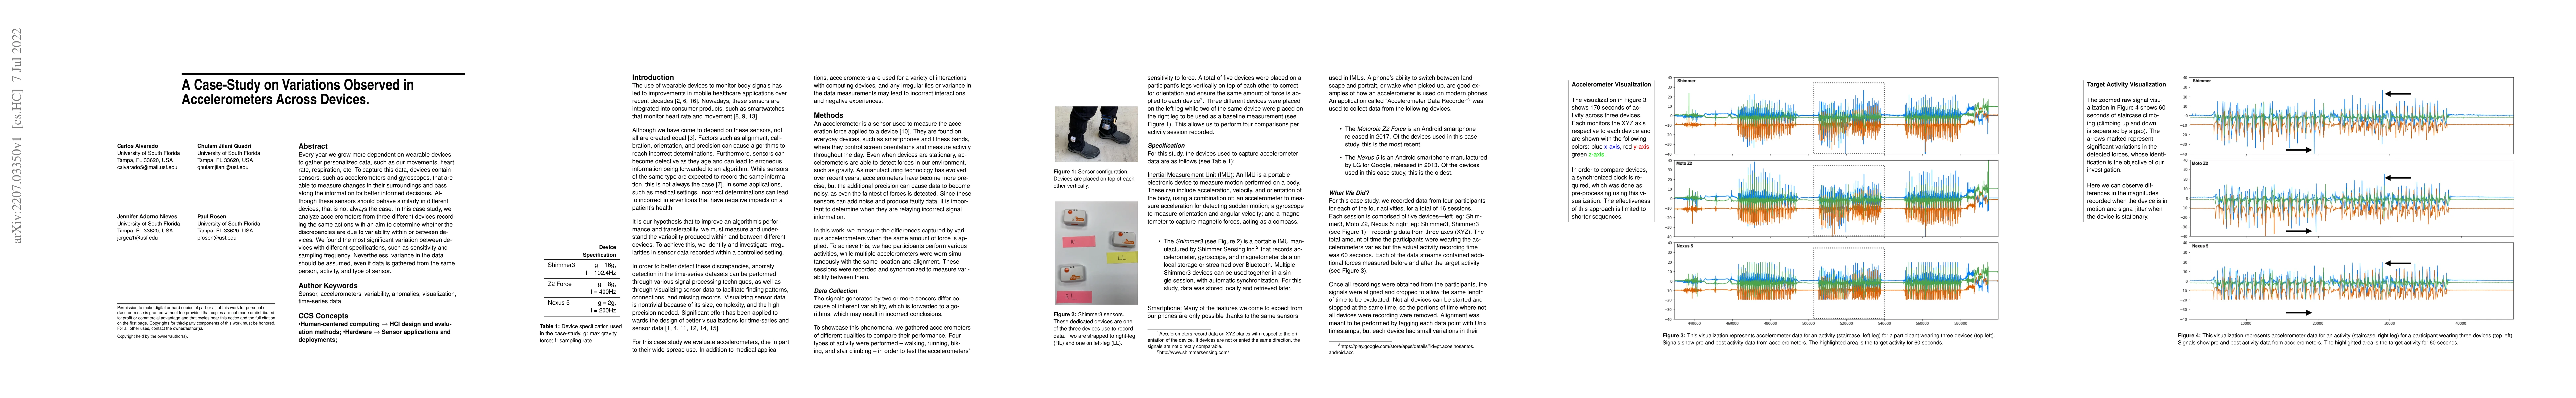
Every year we grow more dependent on wearable devices to gather personalized data, such as our movements, heart rate, respiration, etc. To capture this data, devices contain sensors, such as acceler...
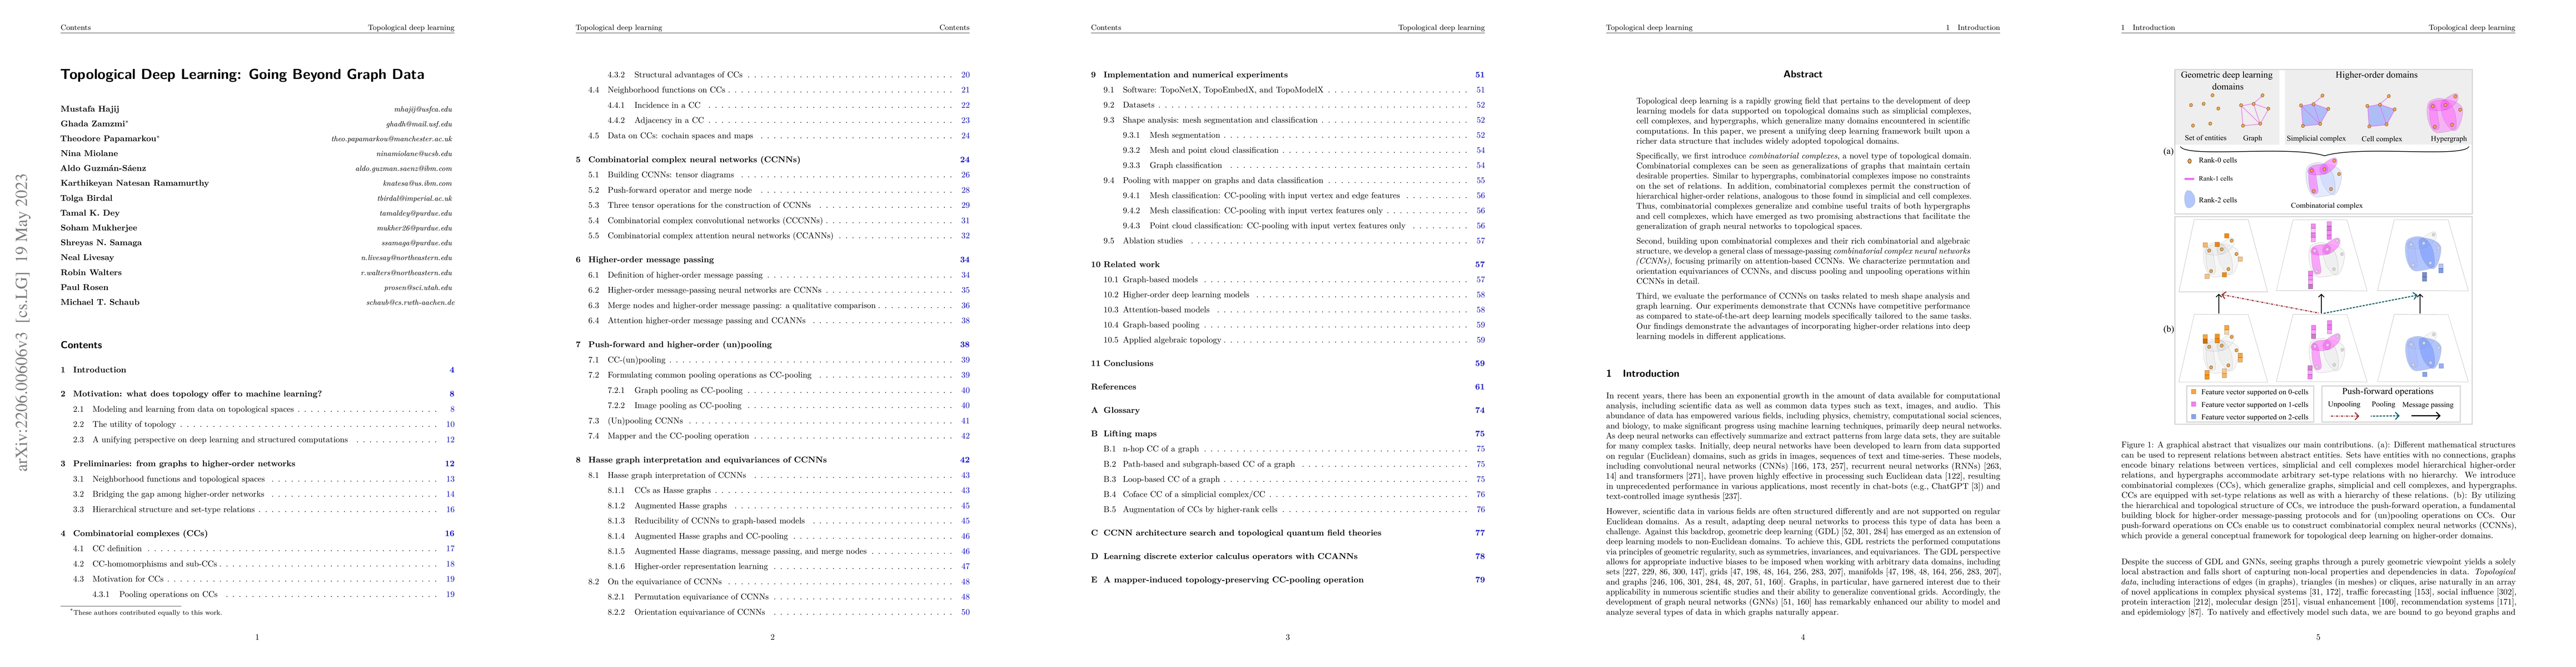
Topological deep learning is a rapidly growing field that pertains to the development of deep learning models for data supported on topological domains such as simplicial complexes, cell complexes, ...
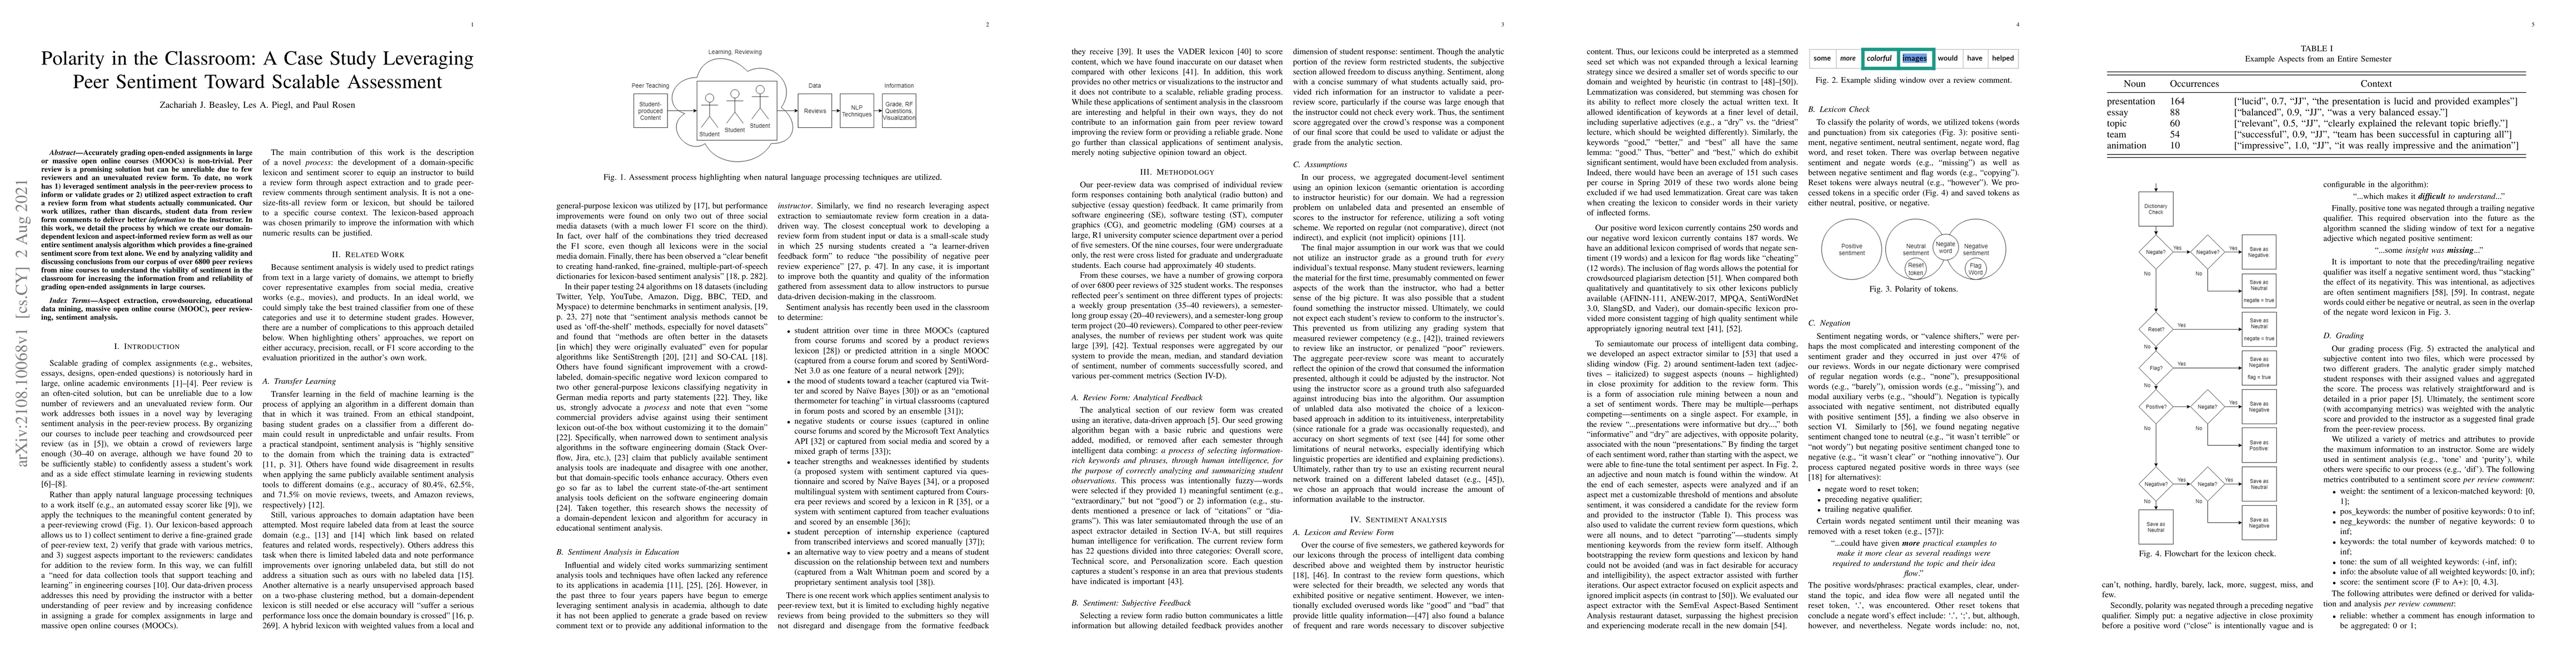
Accurately grading open-ended assignments in large or massive open online courses (MOOCs) is non-trivial. Peer review is a promising solution but can be unreliable due to few reviewers and an uneval...
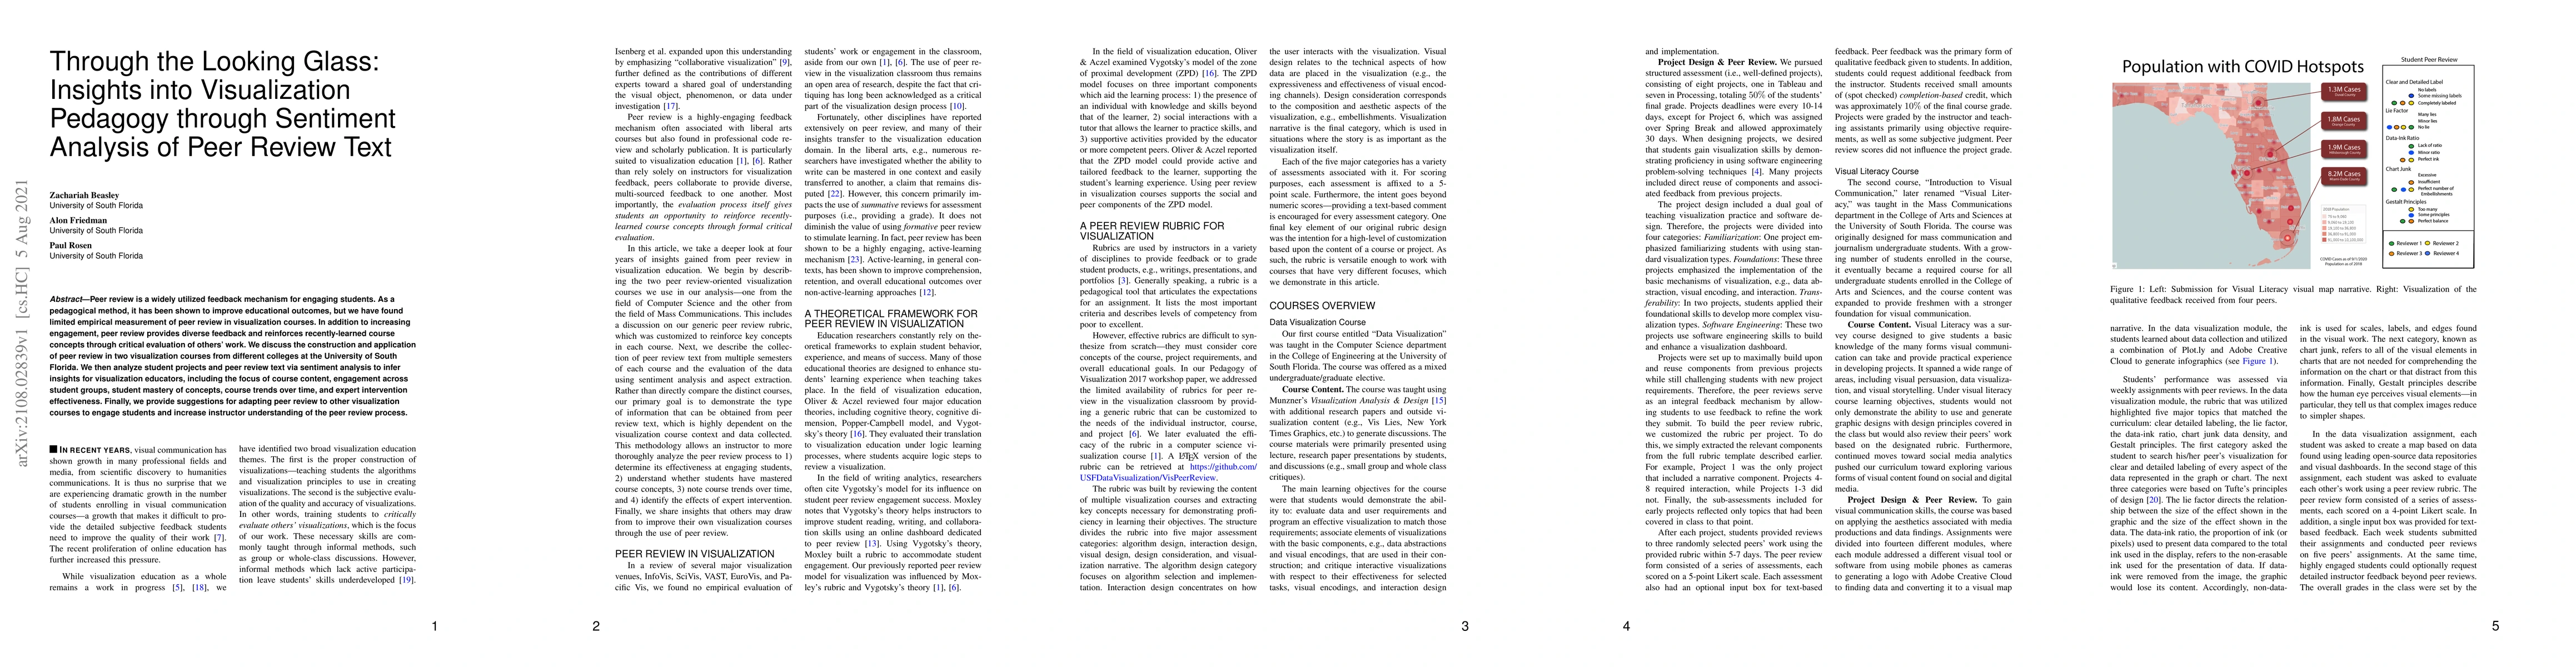
Peer review is a widely utilized feedback mechanism for engaging students. As a pedagogical method, it has been shown to improve educational outcomes, but we have found limited empirical measurement...
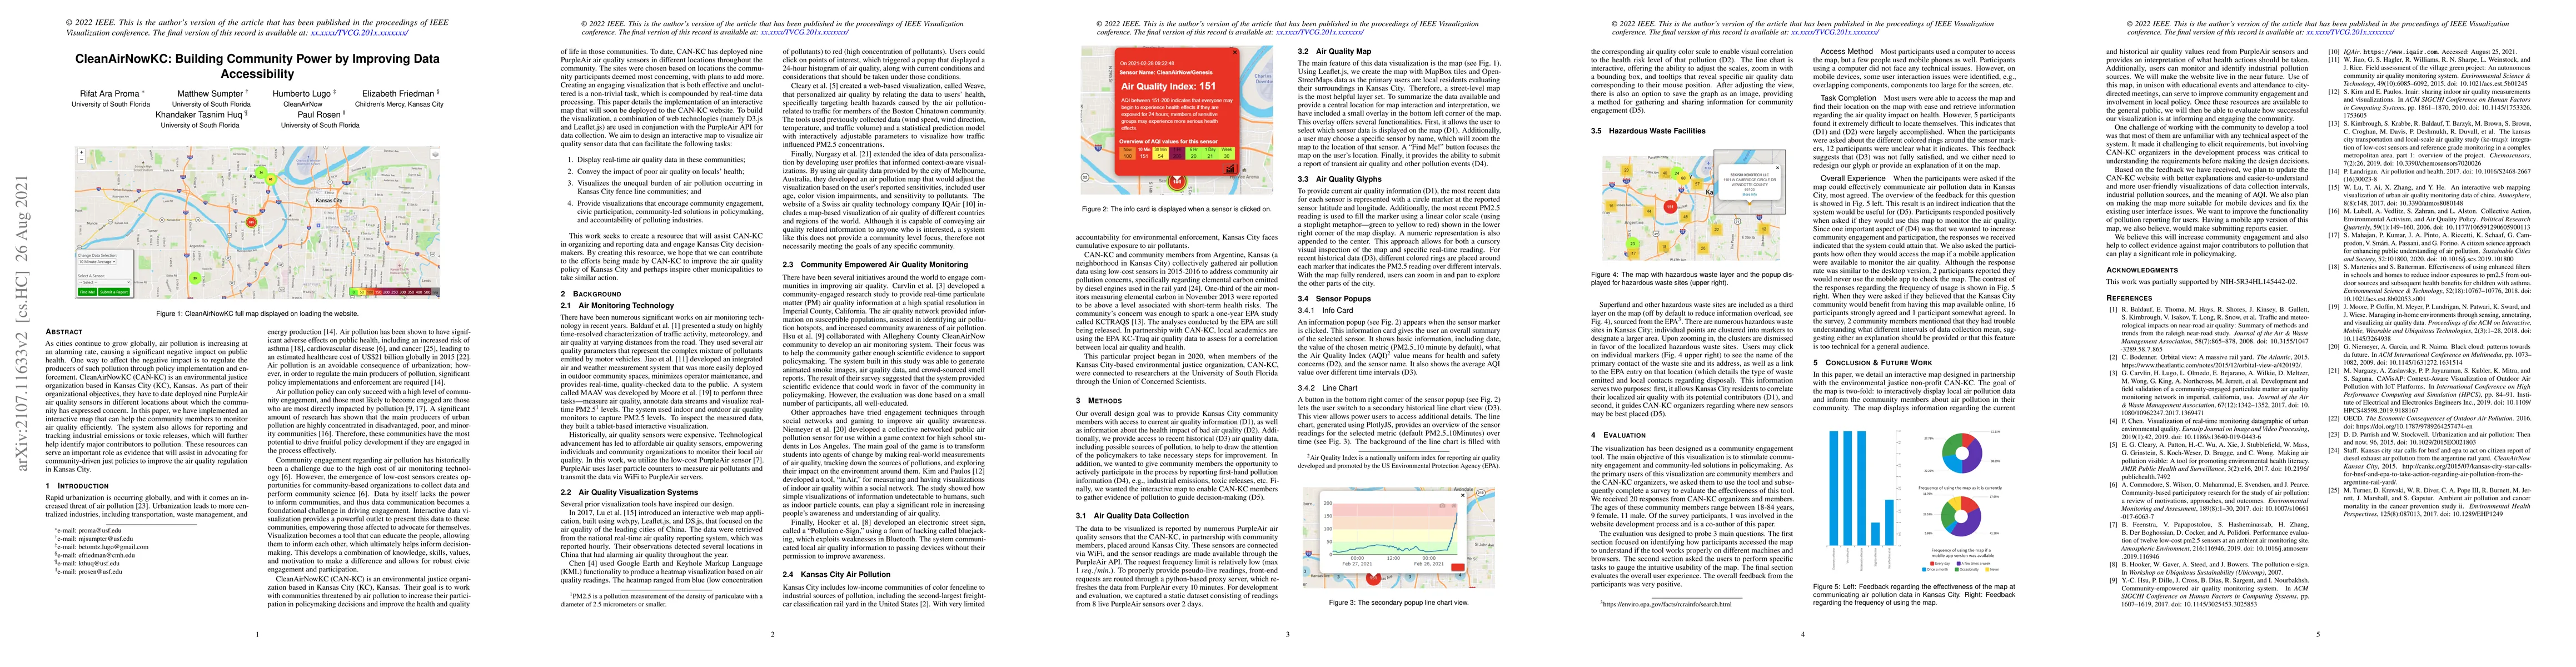
As cities continue to grow globally, air pollution is increasing at an alarming rate, causing a significant negative impact on public health. One way to affect the negative impact is to regulate the...
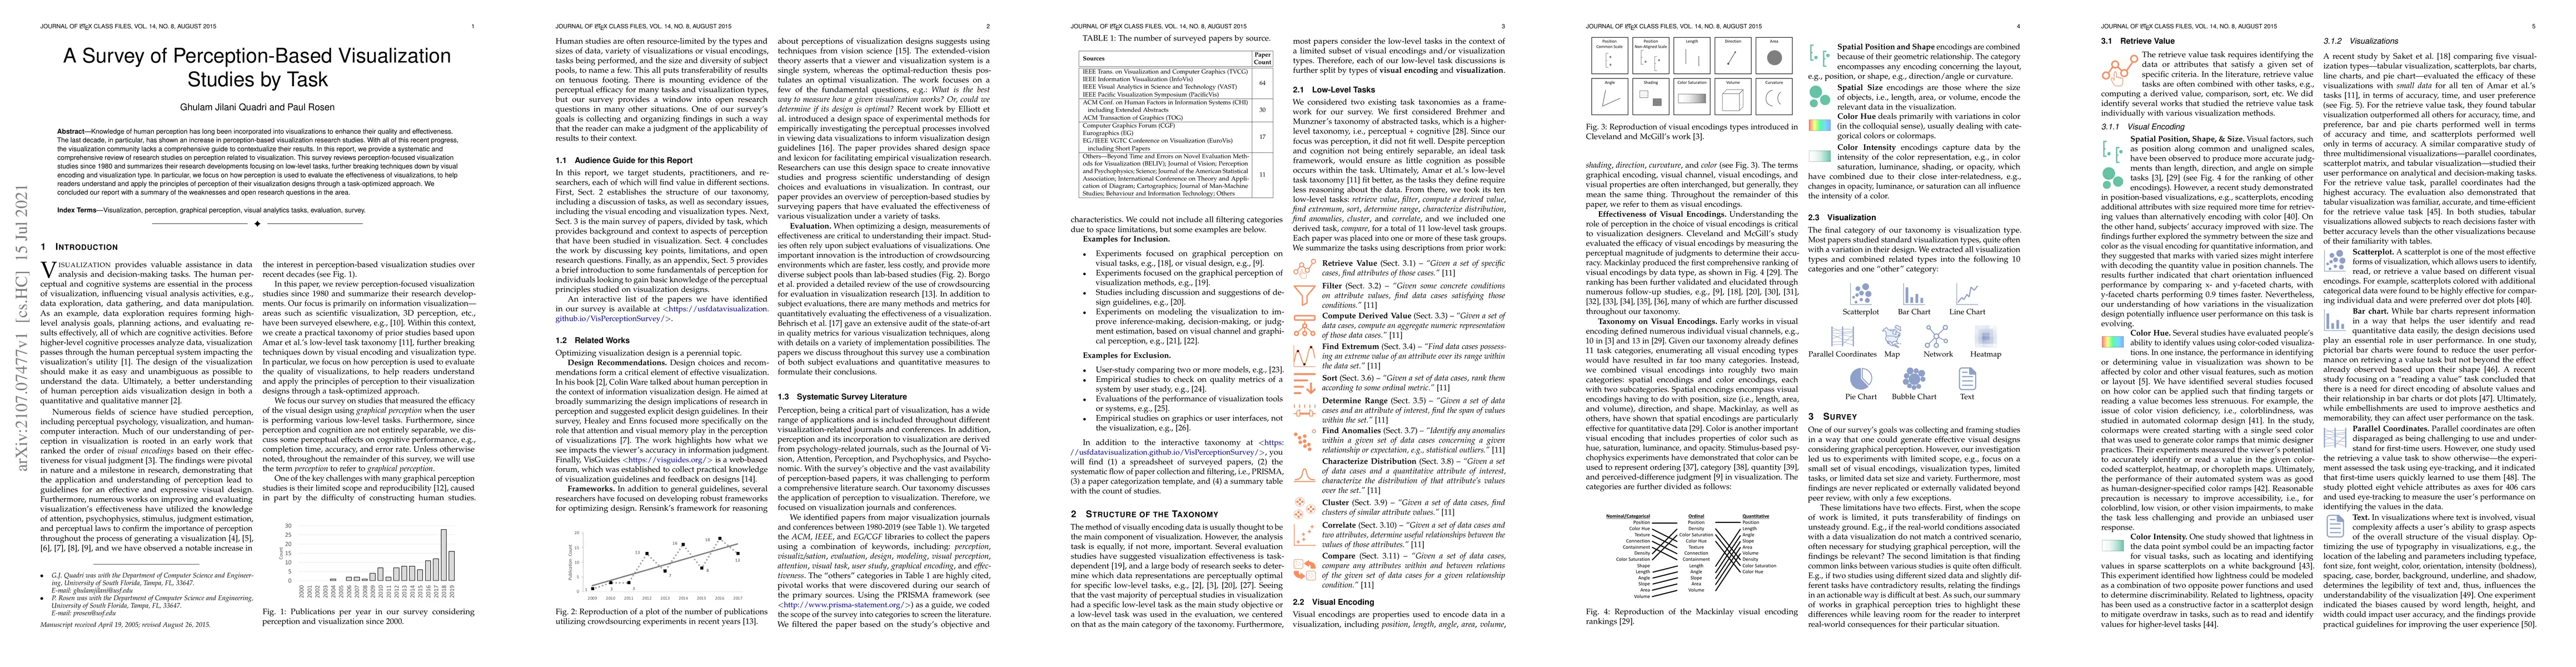
Knowledge of human perception has long been incorporated into visualizations to enhance their quality and effectiveness. The last decade, in particular, has shown an increase in perception-based vis...
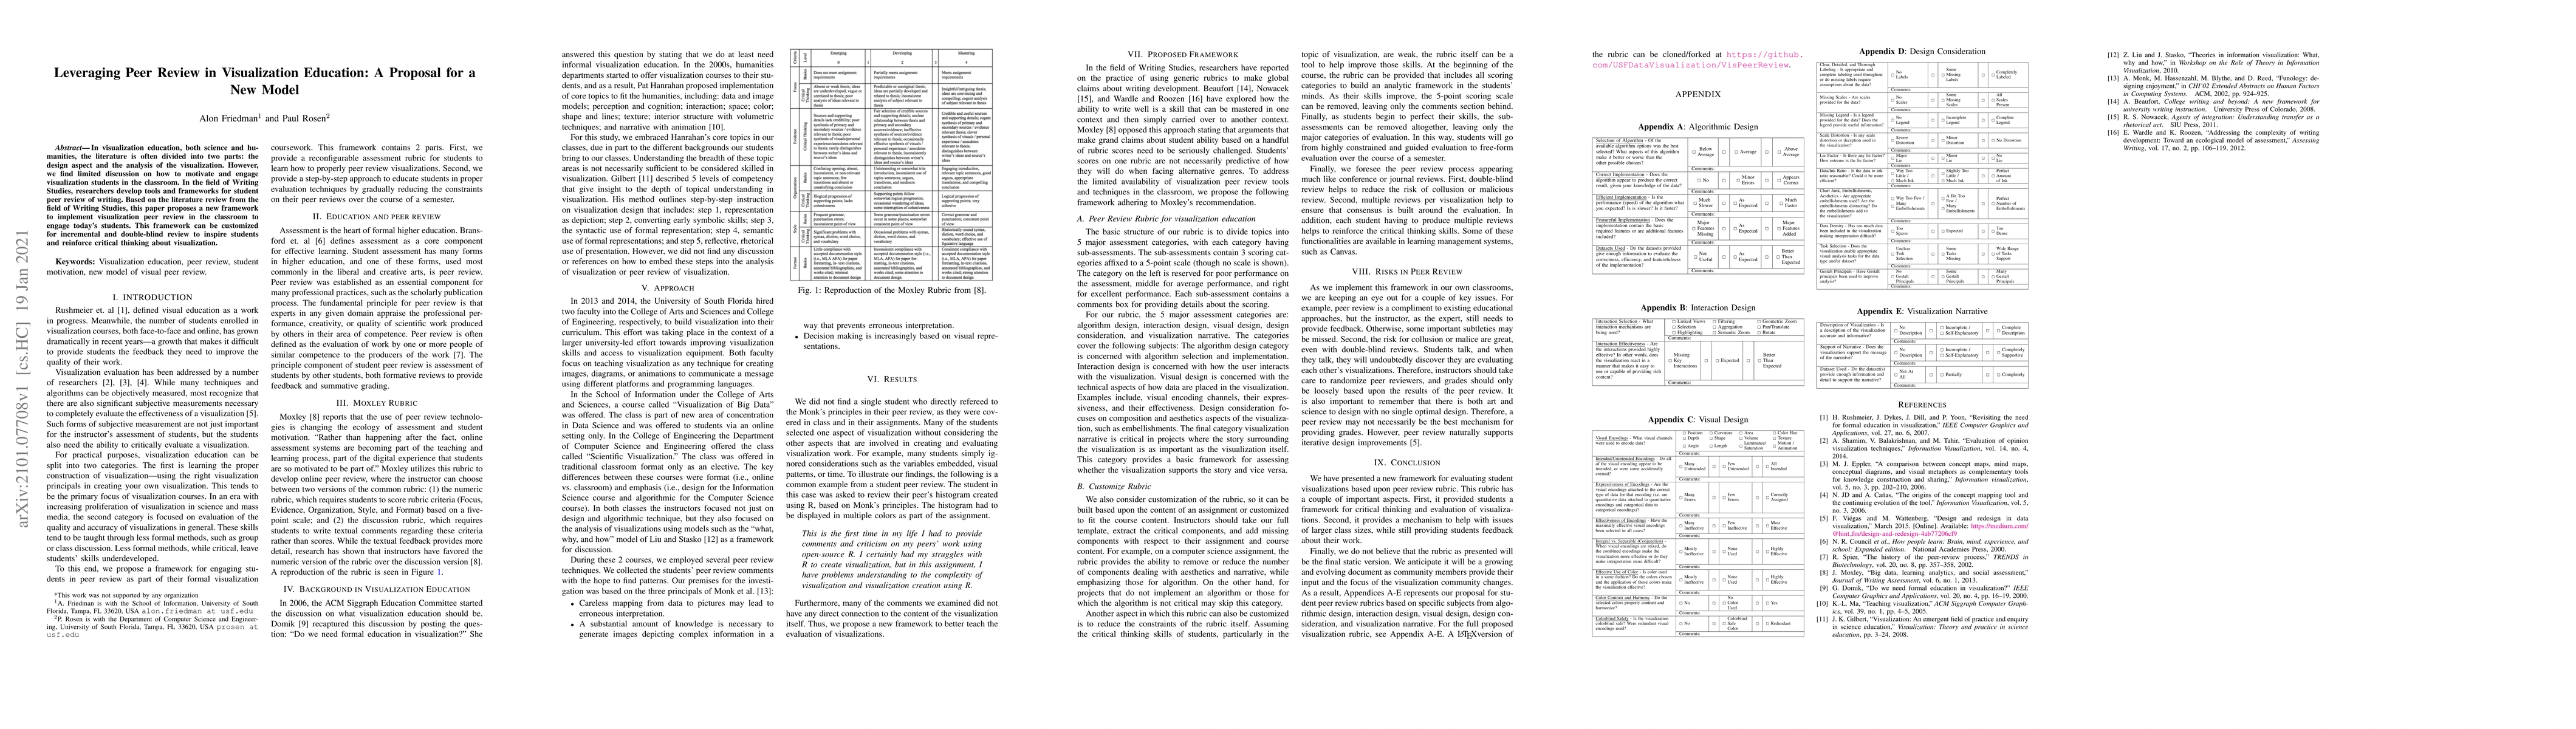
In visualization education, both science and humanities, the literature is often divided into two parts: the design aspect and the analysis of the visualization. However, we find limited discussion ...
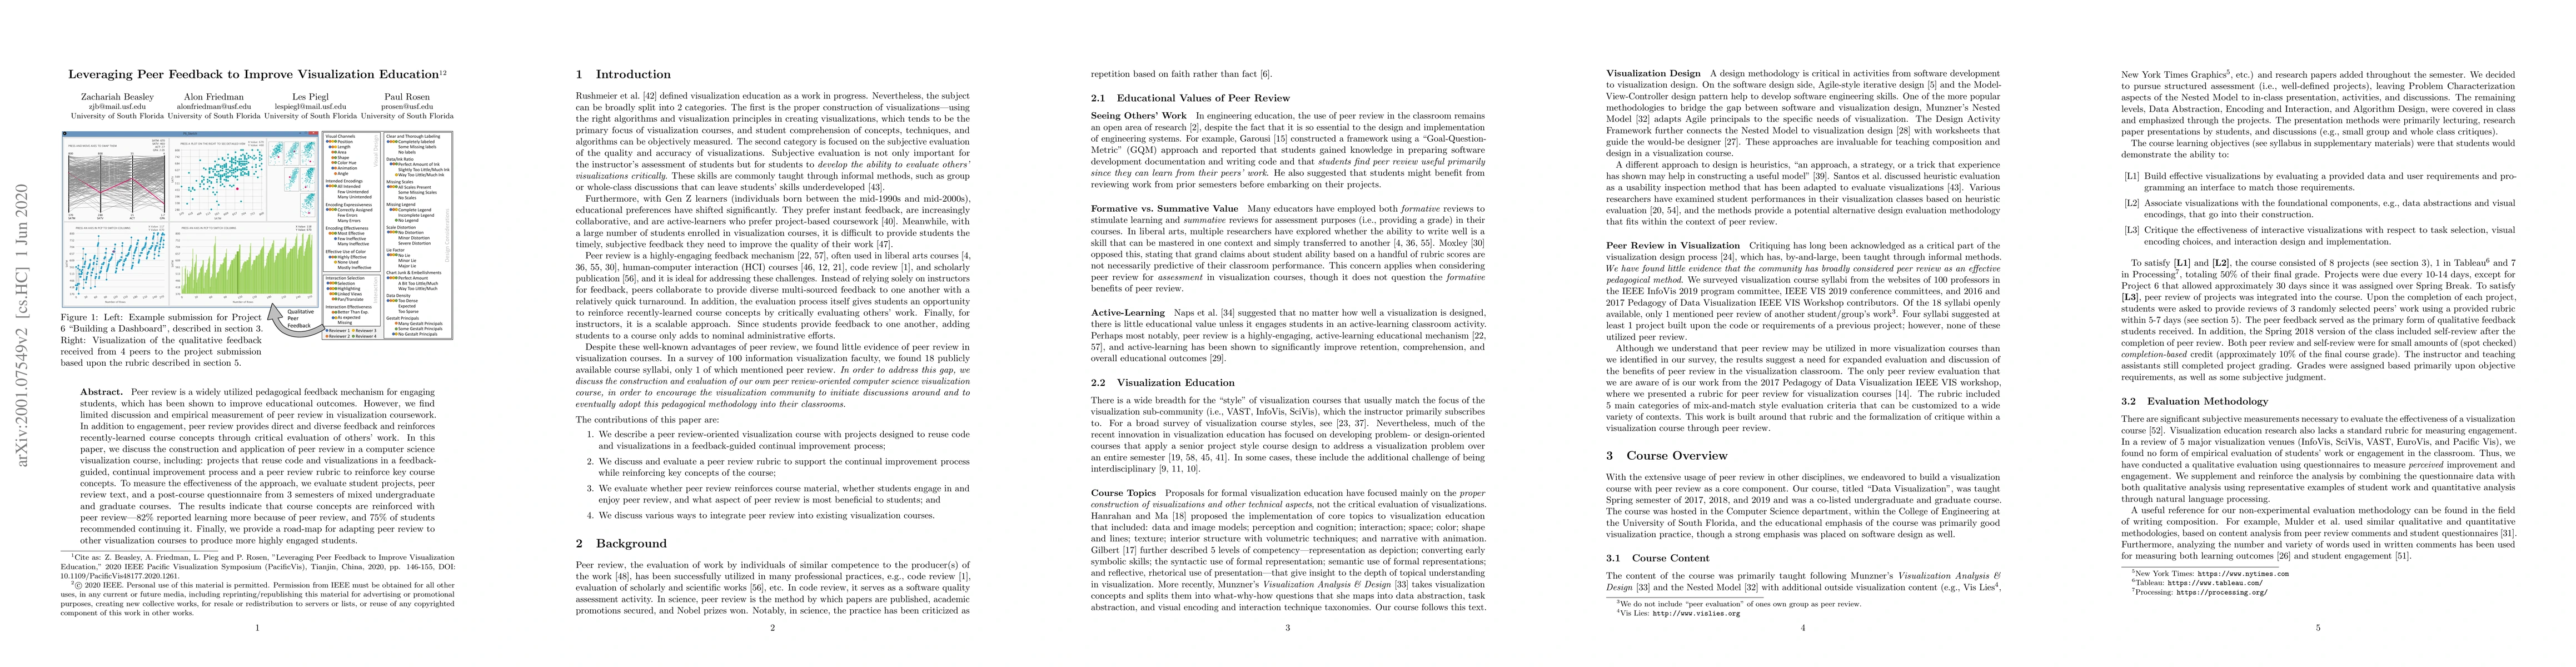
Peer review is a widely utilized pedagogical feedback mechanism for engaging students, which has been shown to improve educational outcomes. However, we find limited discussion and empirical measure...
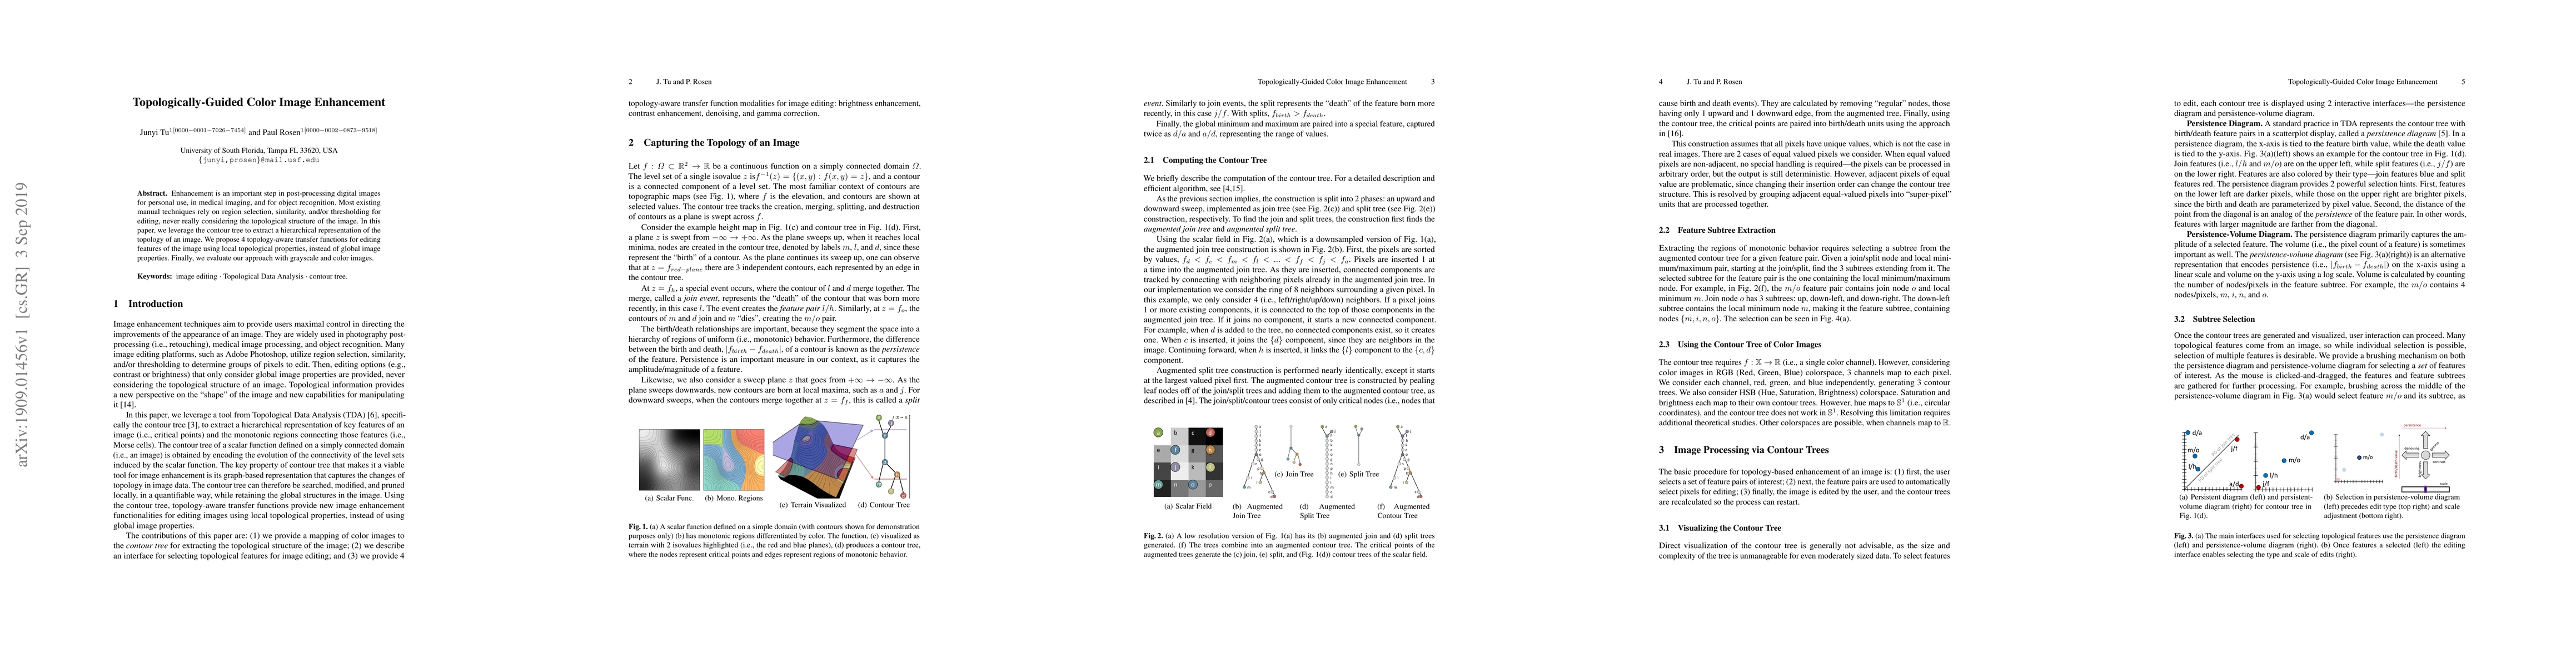
Enhancement is an important step in post-processing digital images for personal use, in medical imaging, and for object recognition. Most existing manual techniques rely on region selection, similar...
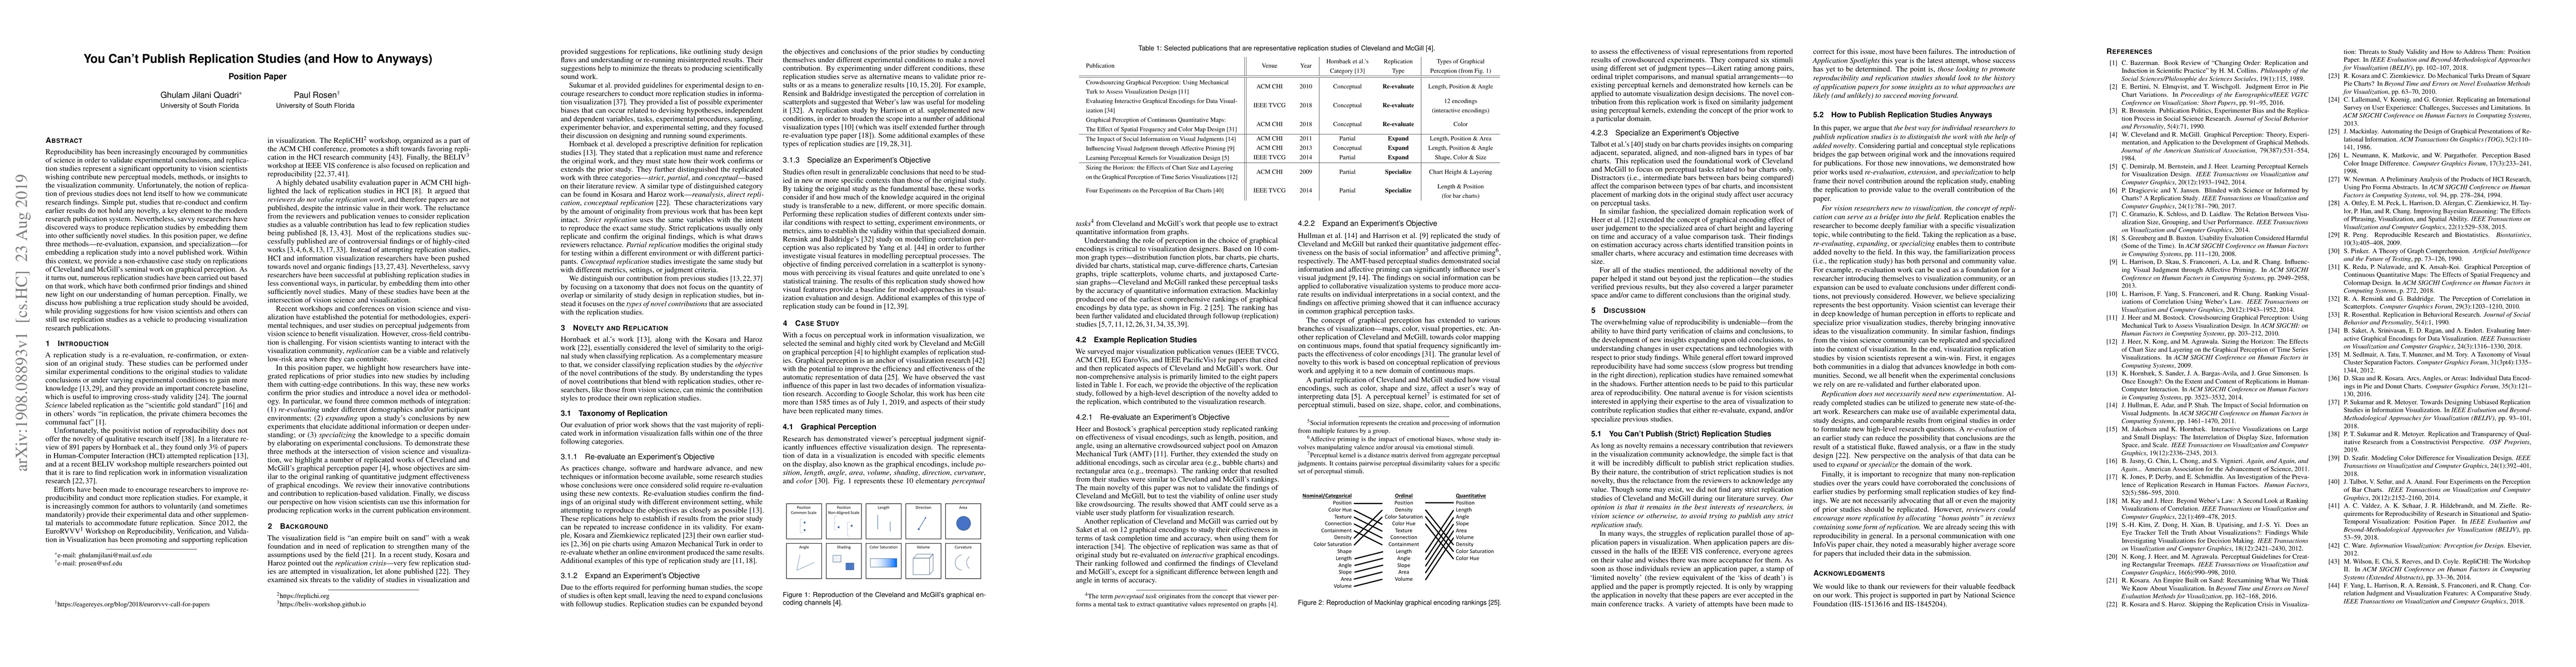
Reproducibility has been increasingly encouraged by communities of science in order to validate experimental conclusions, and replication studies represent a significant opportunity to vision scient...
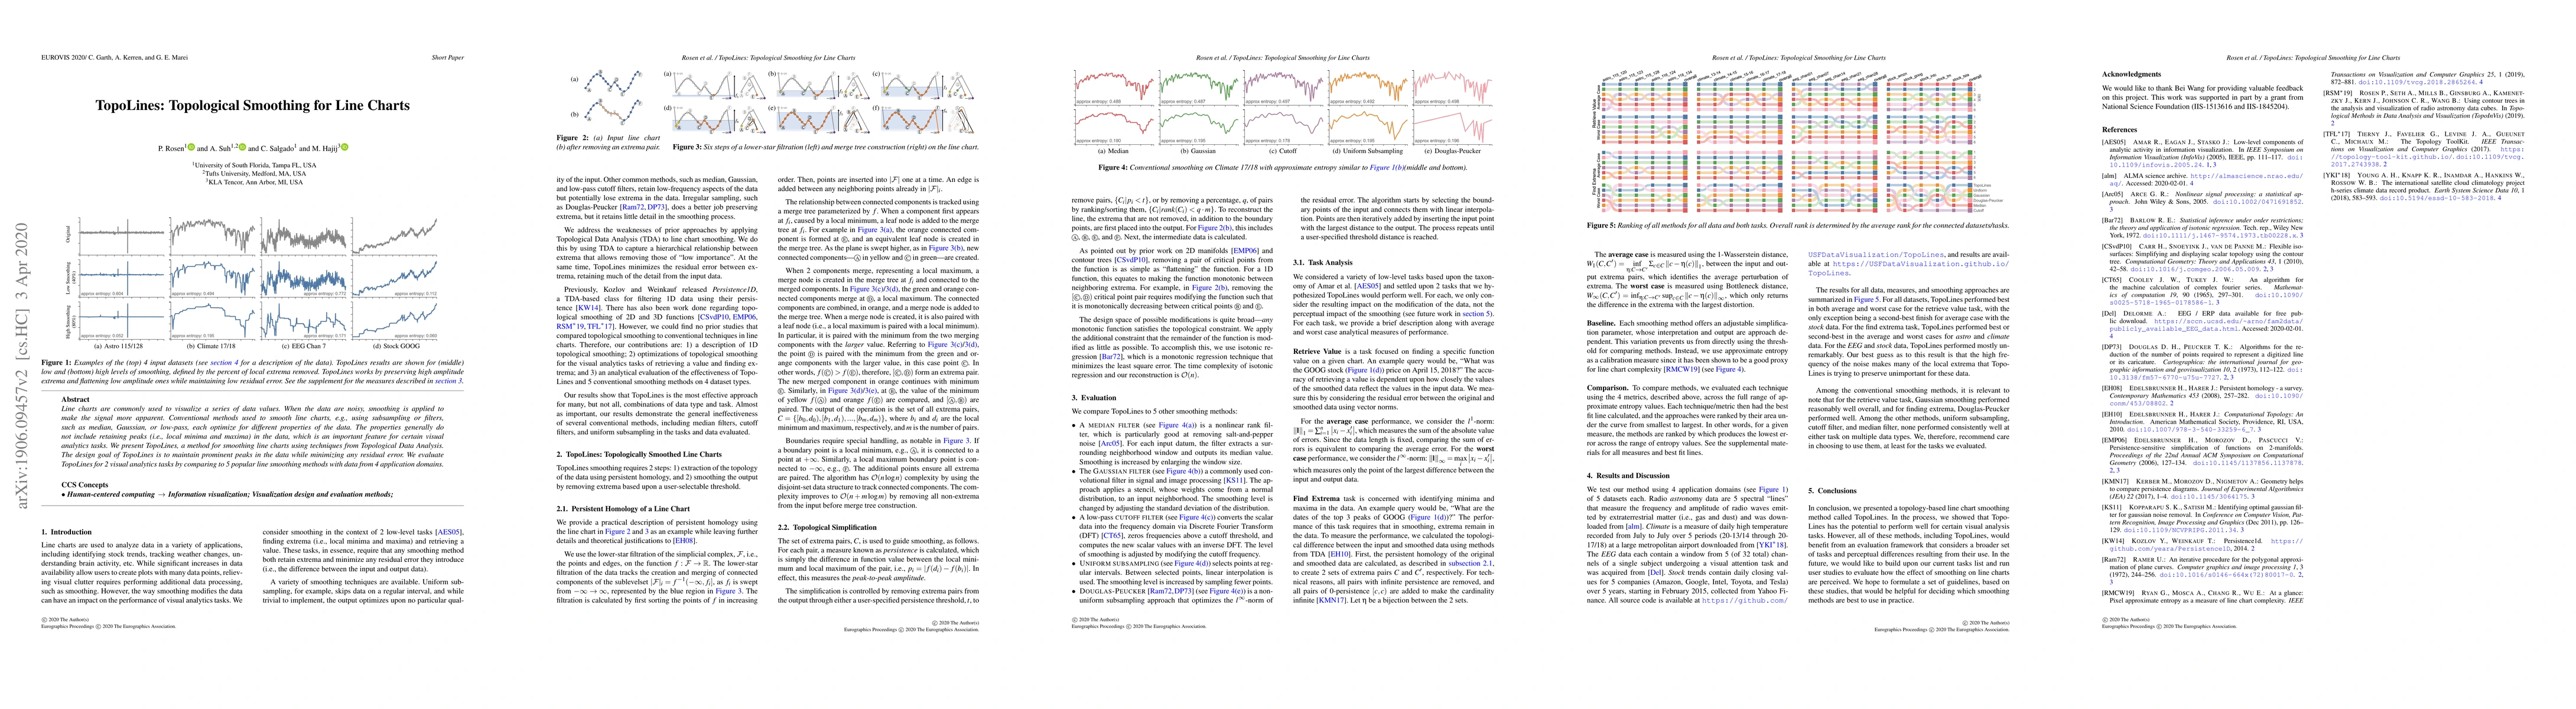
Line charts are commonly used to visualize a series of data values. When the data are noisy, smoothing is applied to make the signal more apparent. Conventional methods used to smooth line charts, e...
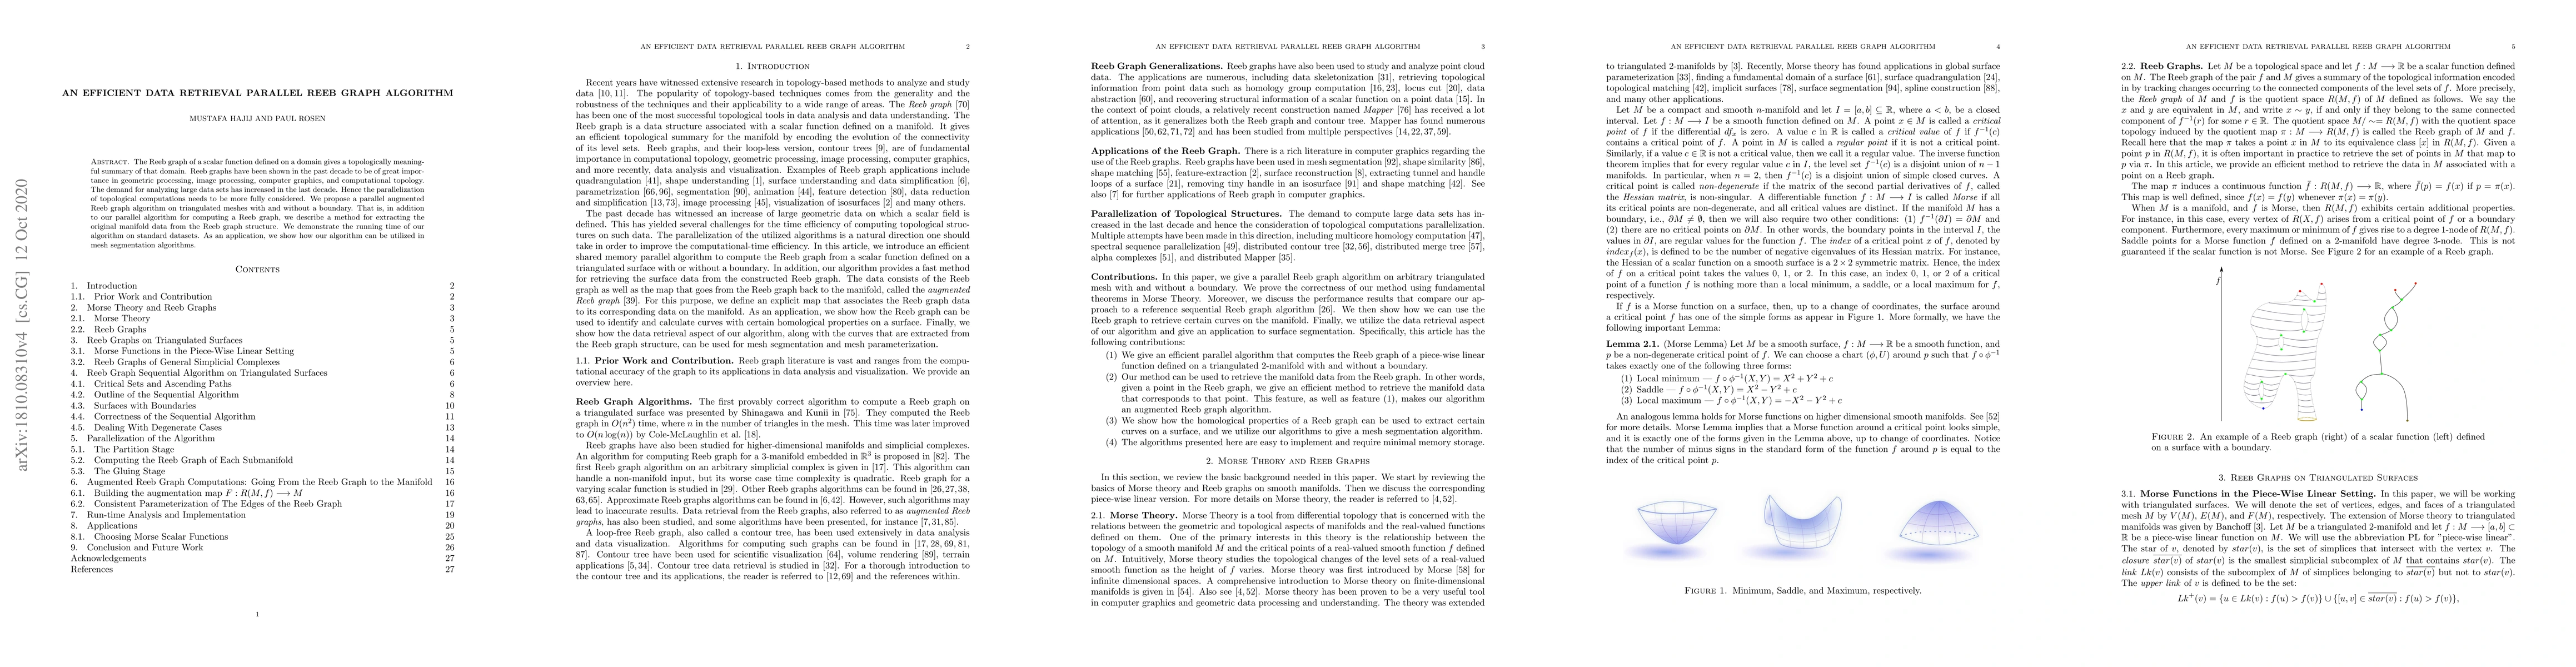
The Reeb graph of a scalar function defined on a domain gives a topologically meaningful summary of that domain. Reeb graphs have been shown in the past decade to be of great importance in geometric...
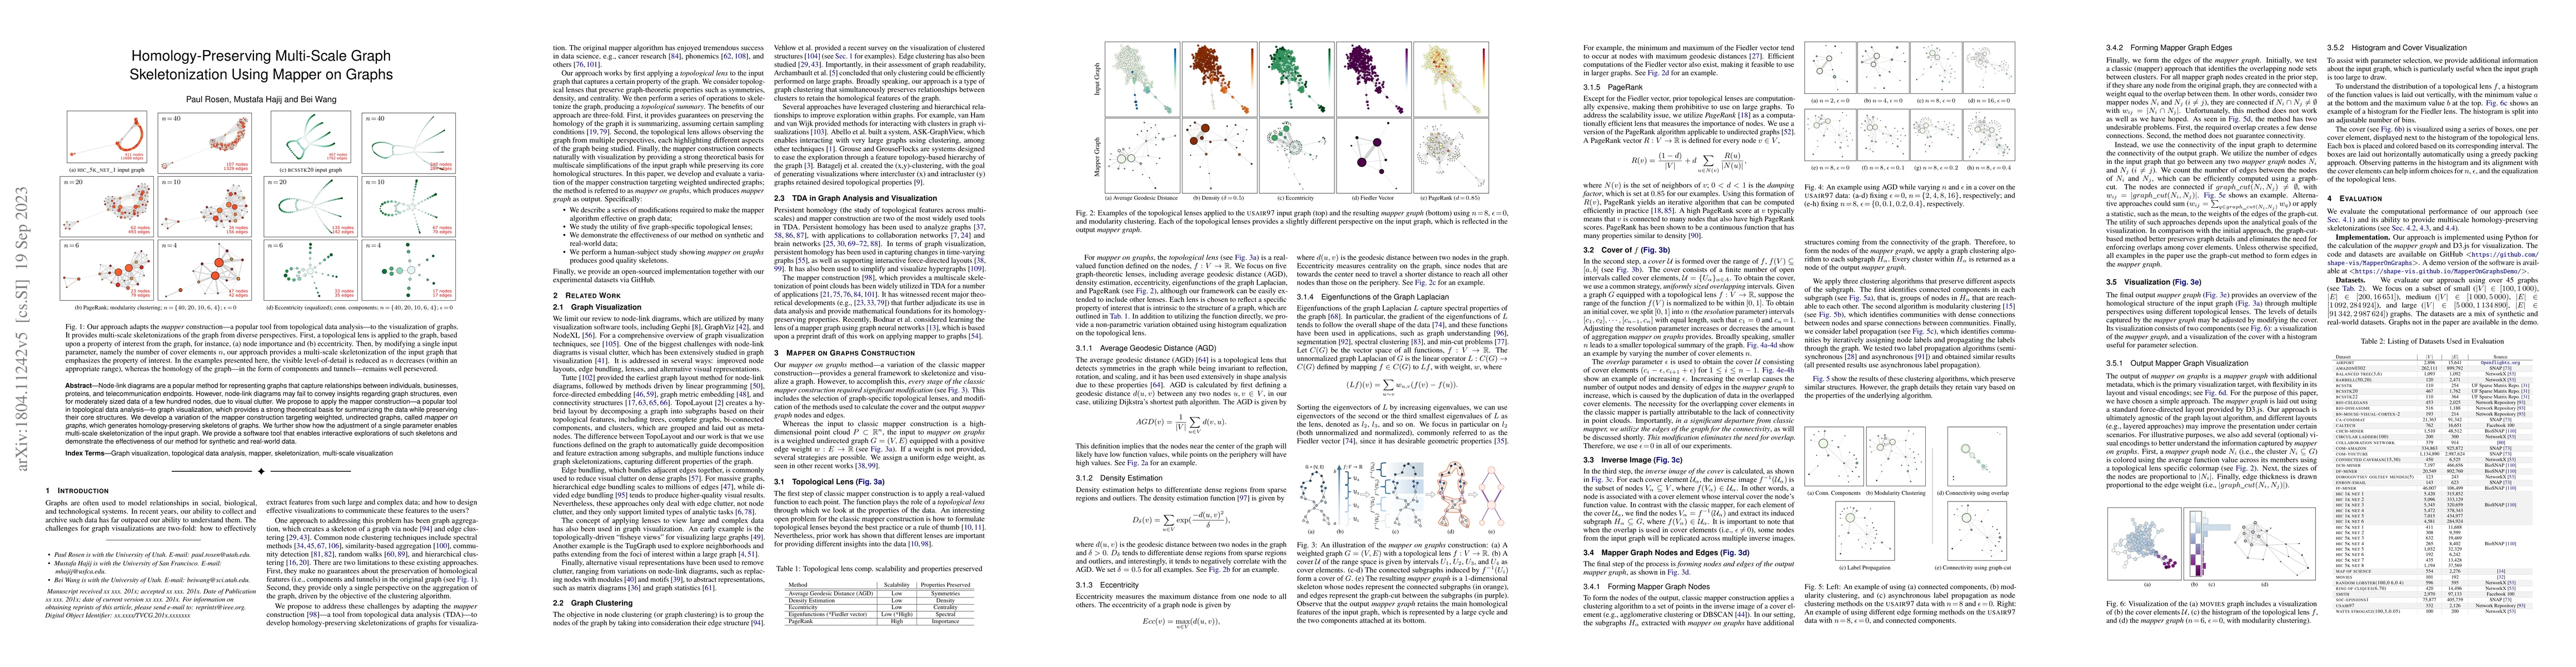
Node-link diagrams are a popular method for representing graphs that capture relationships between individuals, businesses, proteins, and telecommunication endpoints. However, node-link diagrams may...
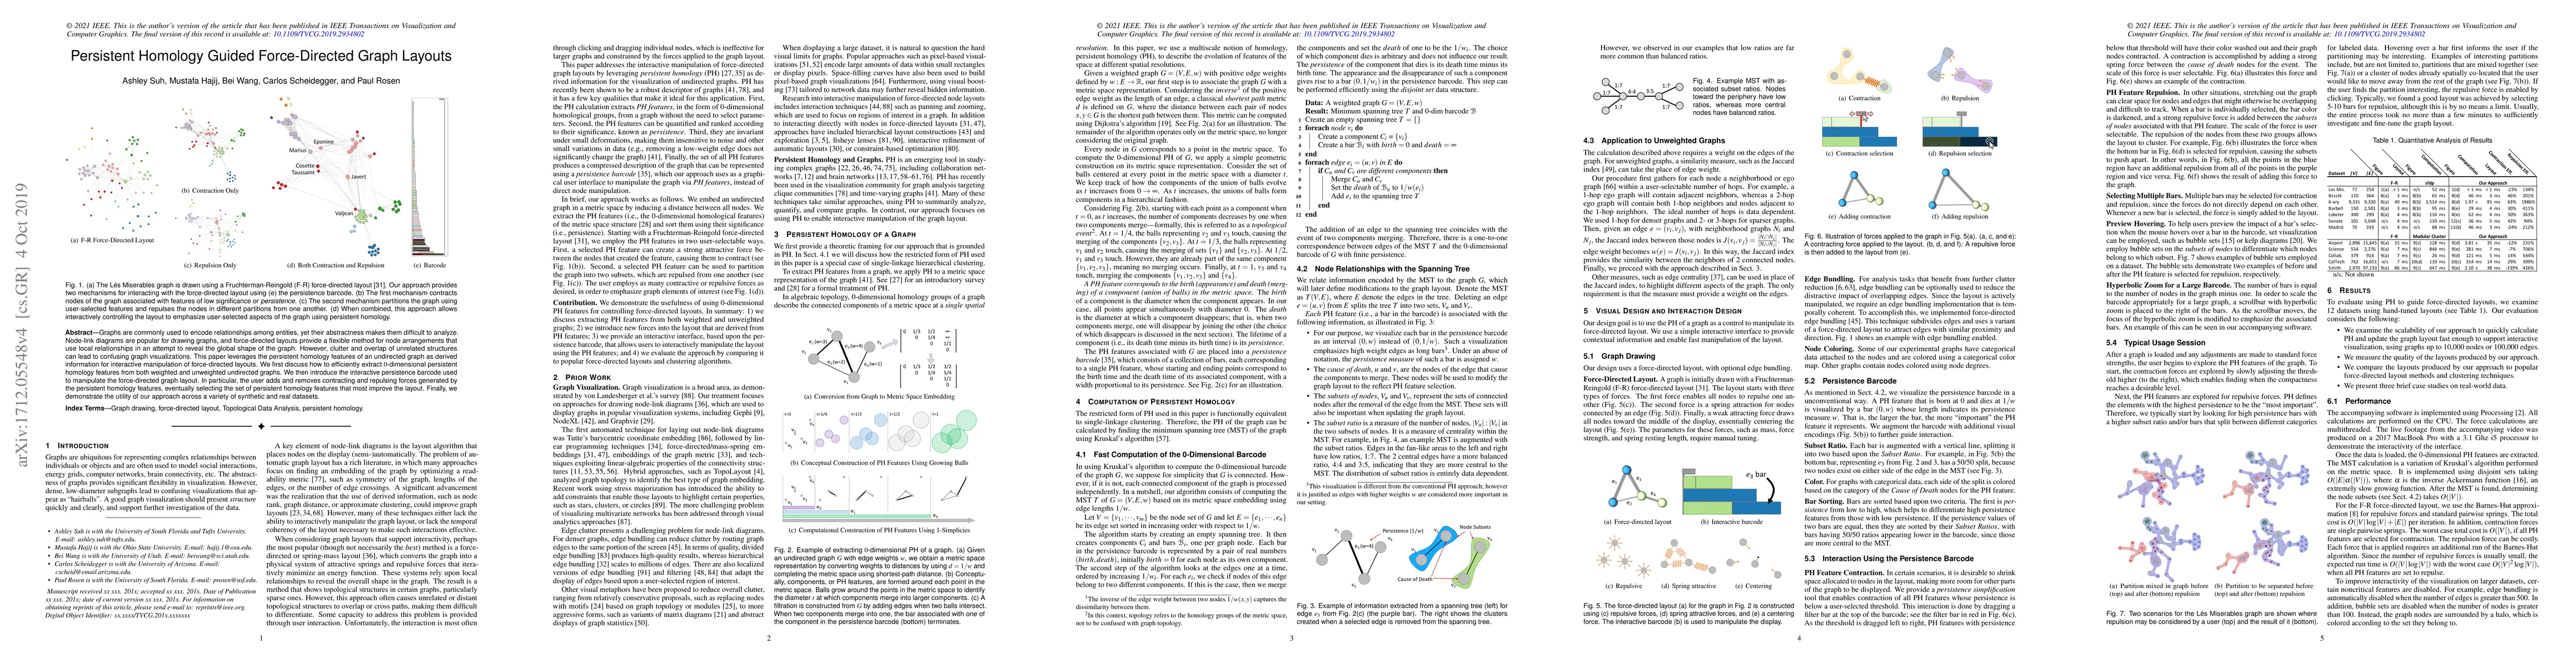
Graphs are commonly used to encode relationships among entities, yet their abstractness makes them difficult to analyze. Node-link diagrams are popular for drawing graphs, and force-directed layouts...
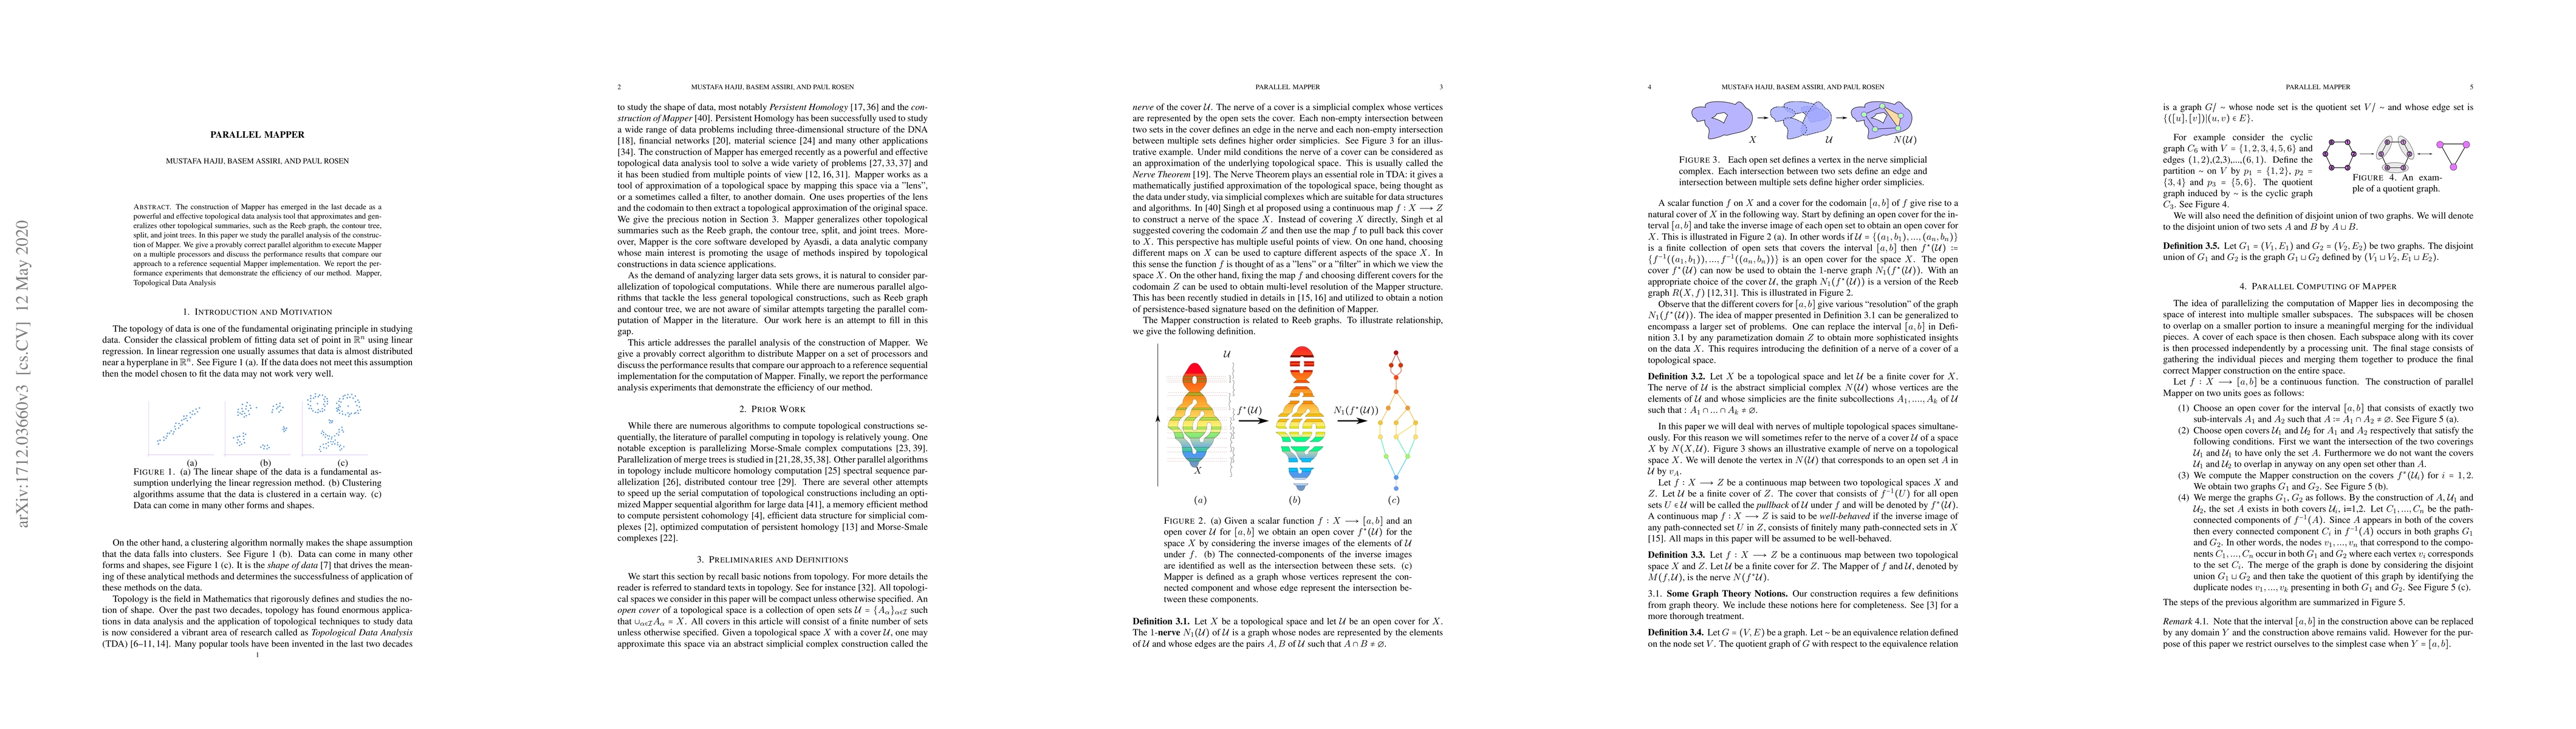
The construction of Mapper has emerged in the last decade as a powerful and effective topological data analysis tool that approximates and generalizes other topological summaries, such as the Reeb g...
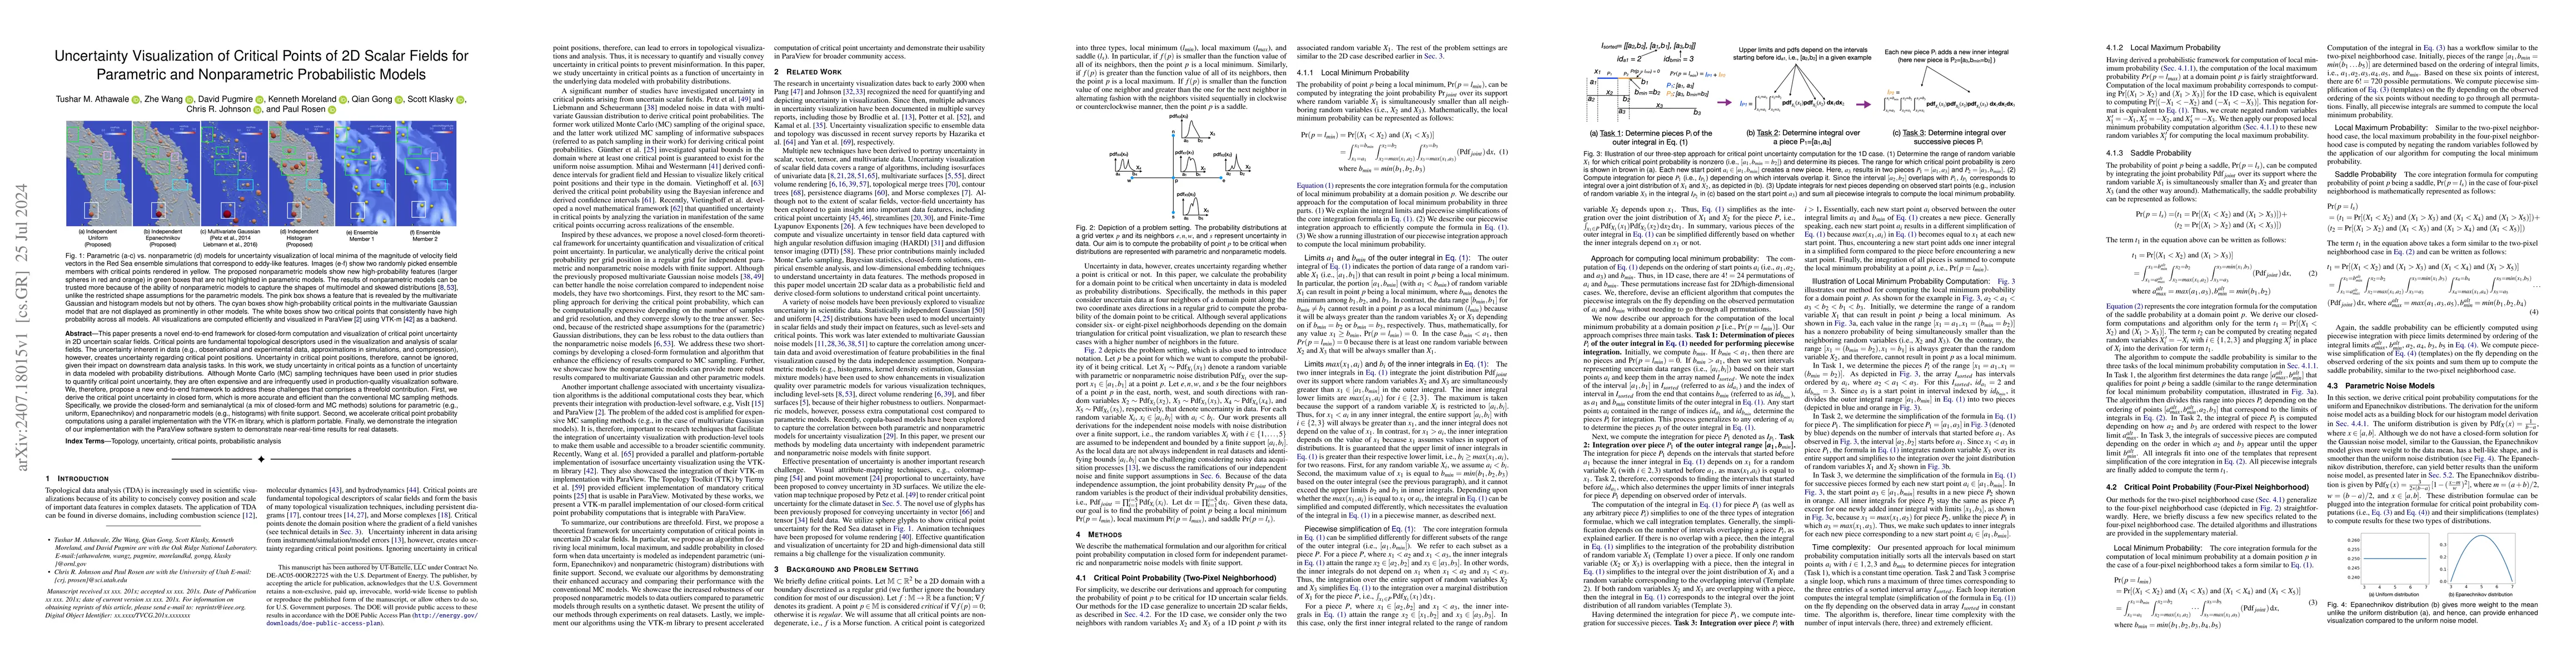
This paper presents a novel end-to-end framework for closed-form computation and visualization of critical point uncertainty in 2D uncertain scalar fields. Critical points are fundamental topological ...
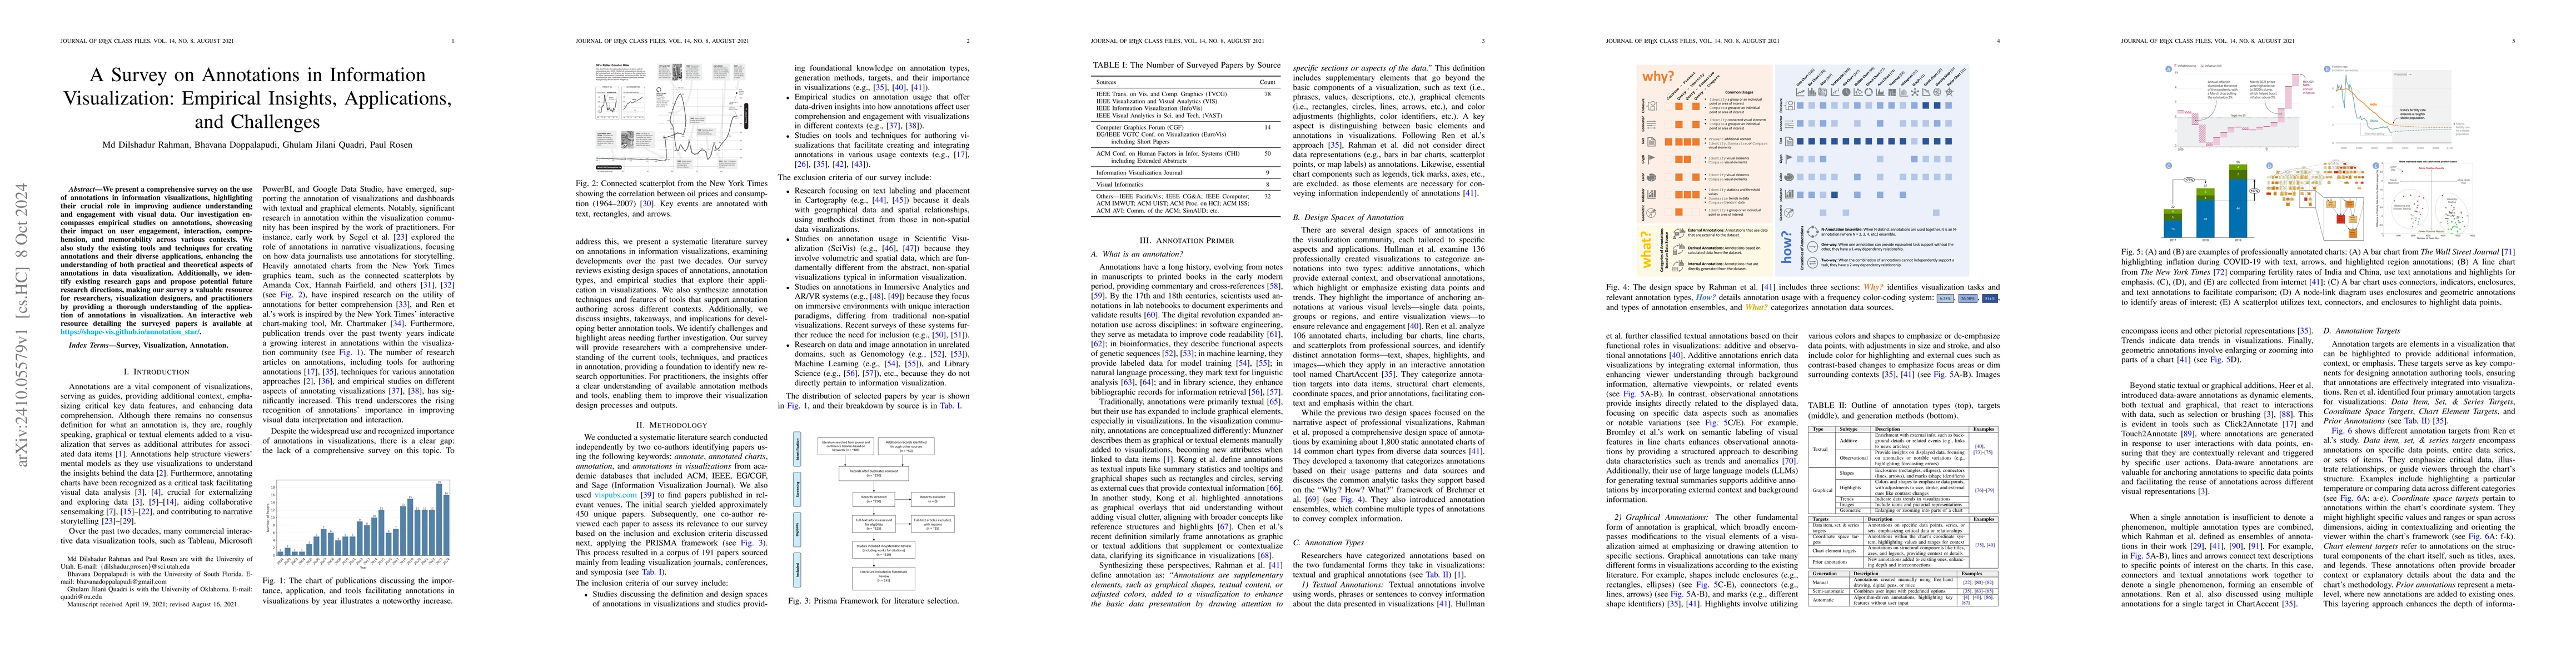
We present a comprehensive survey on the use of annotations in information visualizations, highlighting their crucial role in improving audience understanding and engagement with visual data. Our inve...
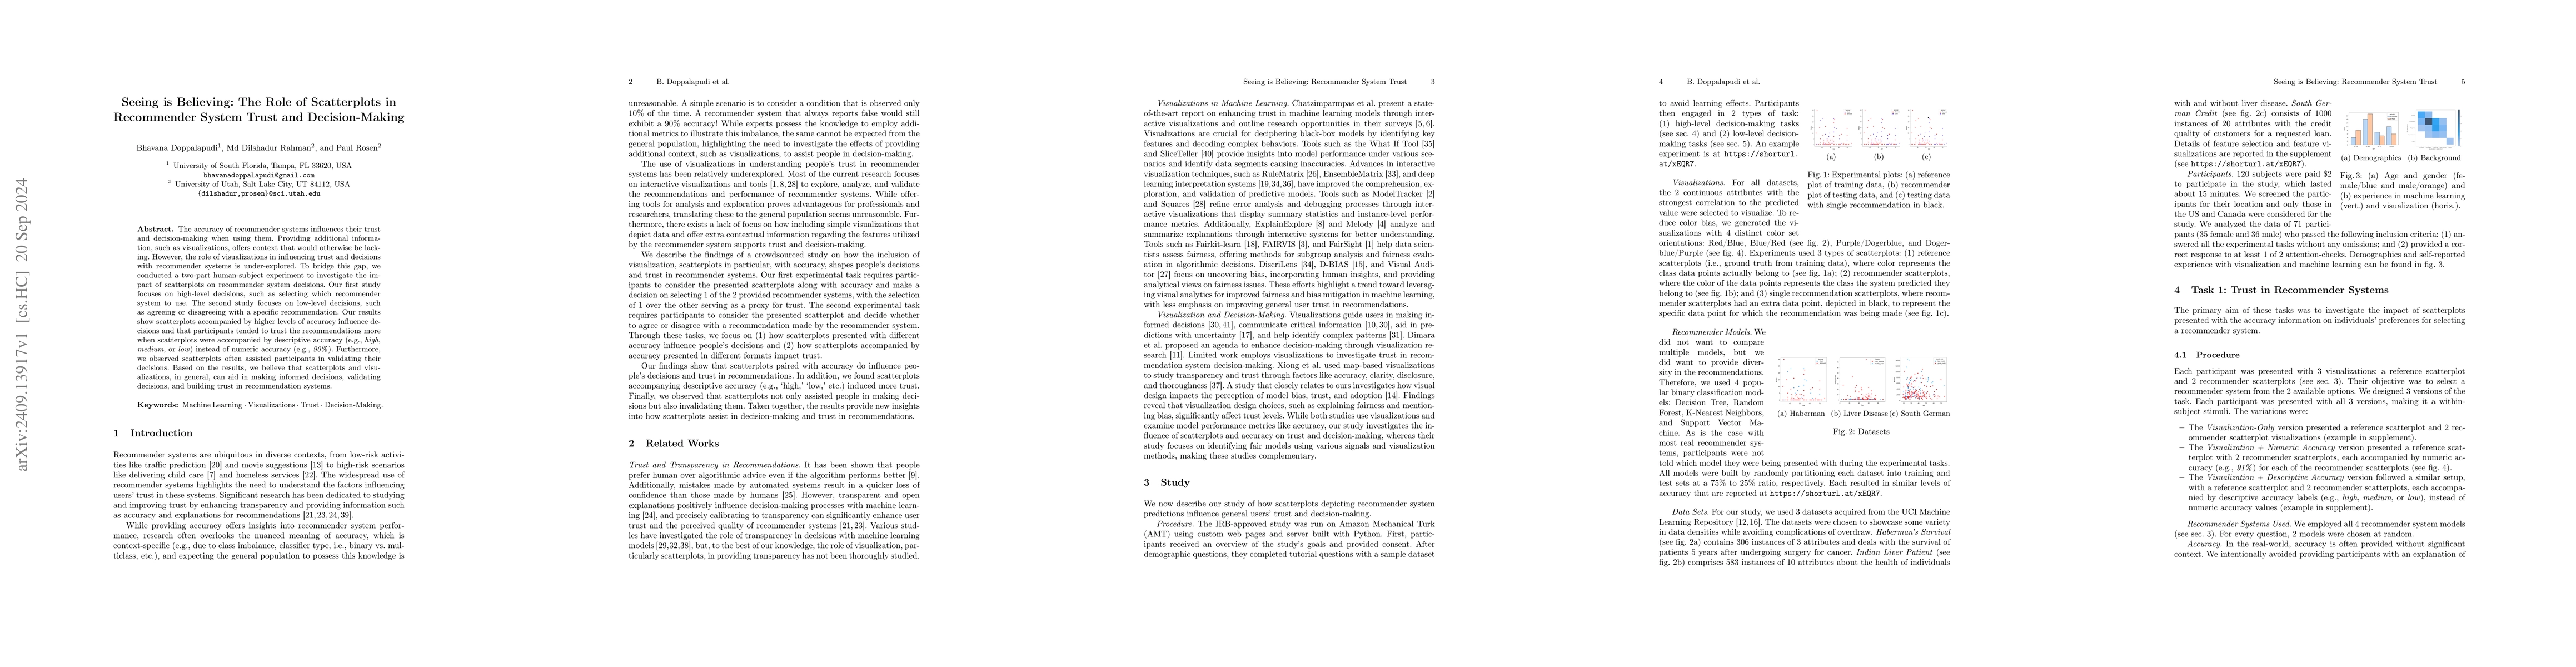
The accuracy of recommender systems influences their trust and decision-making when using them. Providing additional information, such as visualizations, offers context that would otherwise be lacking...
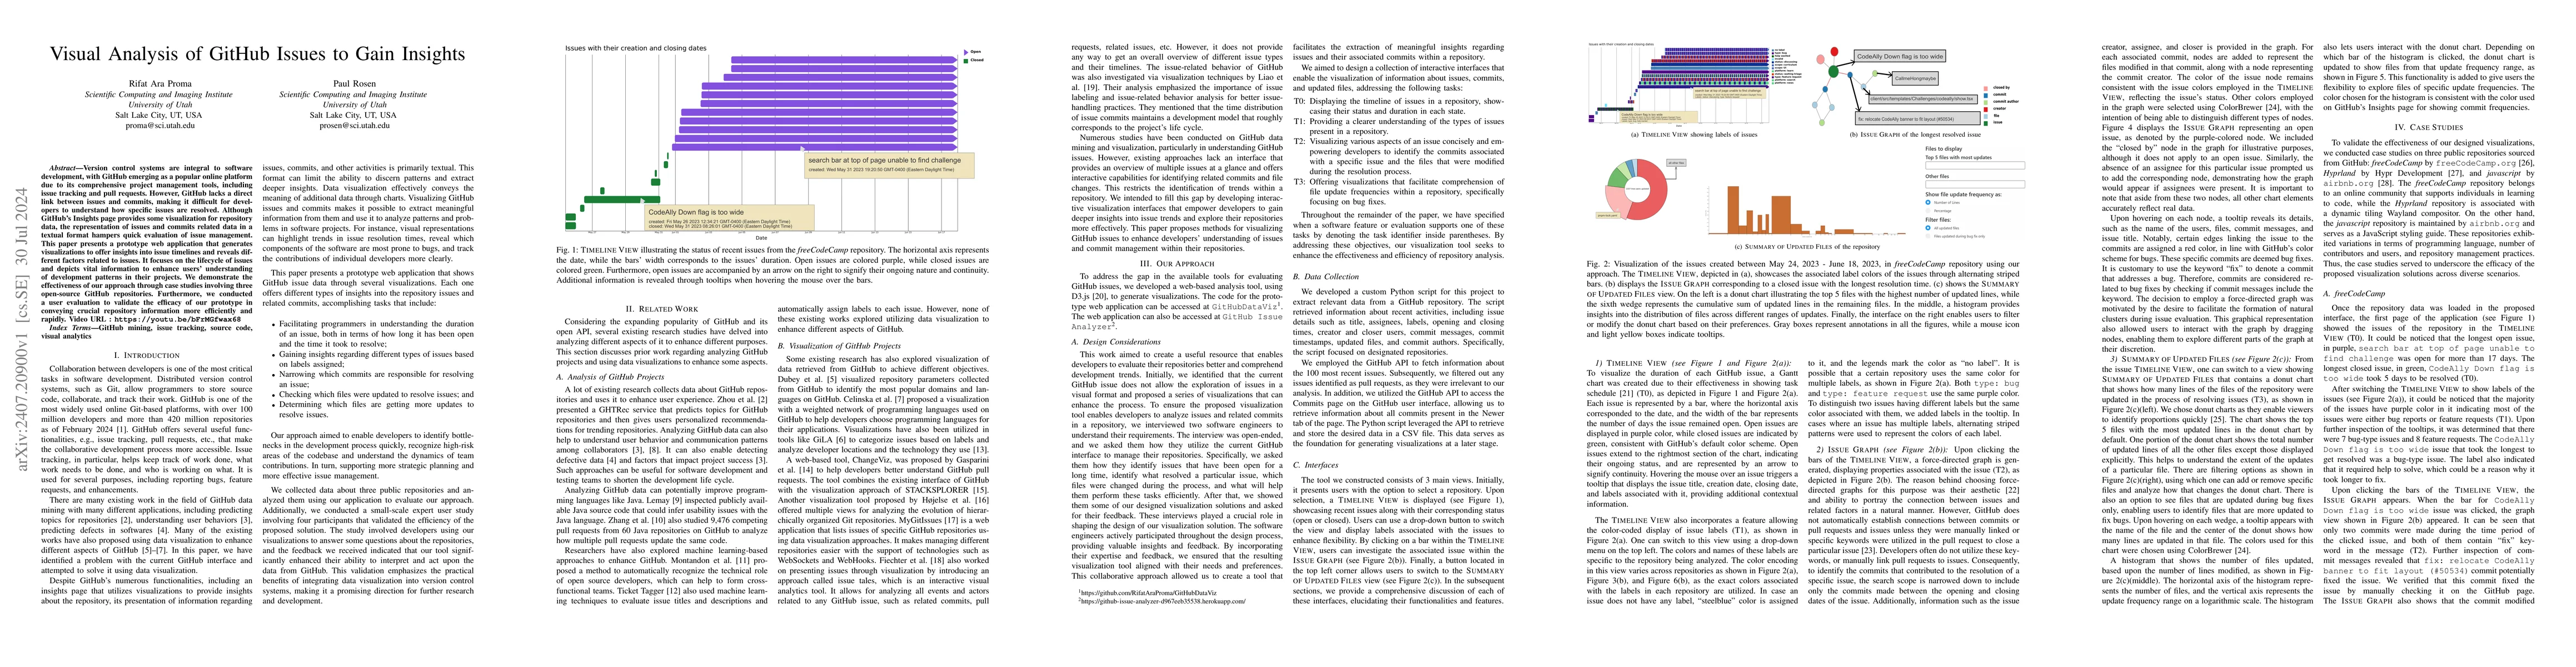
Version control systems are integral to software development, with GitHub emerging as a popular online platform due to its comprehensive project management tools, including issue tracking and pull req...
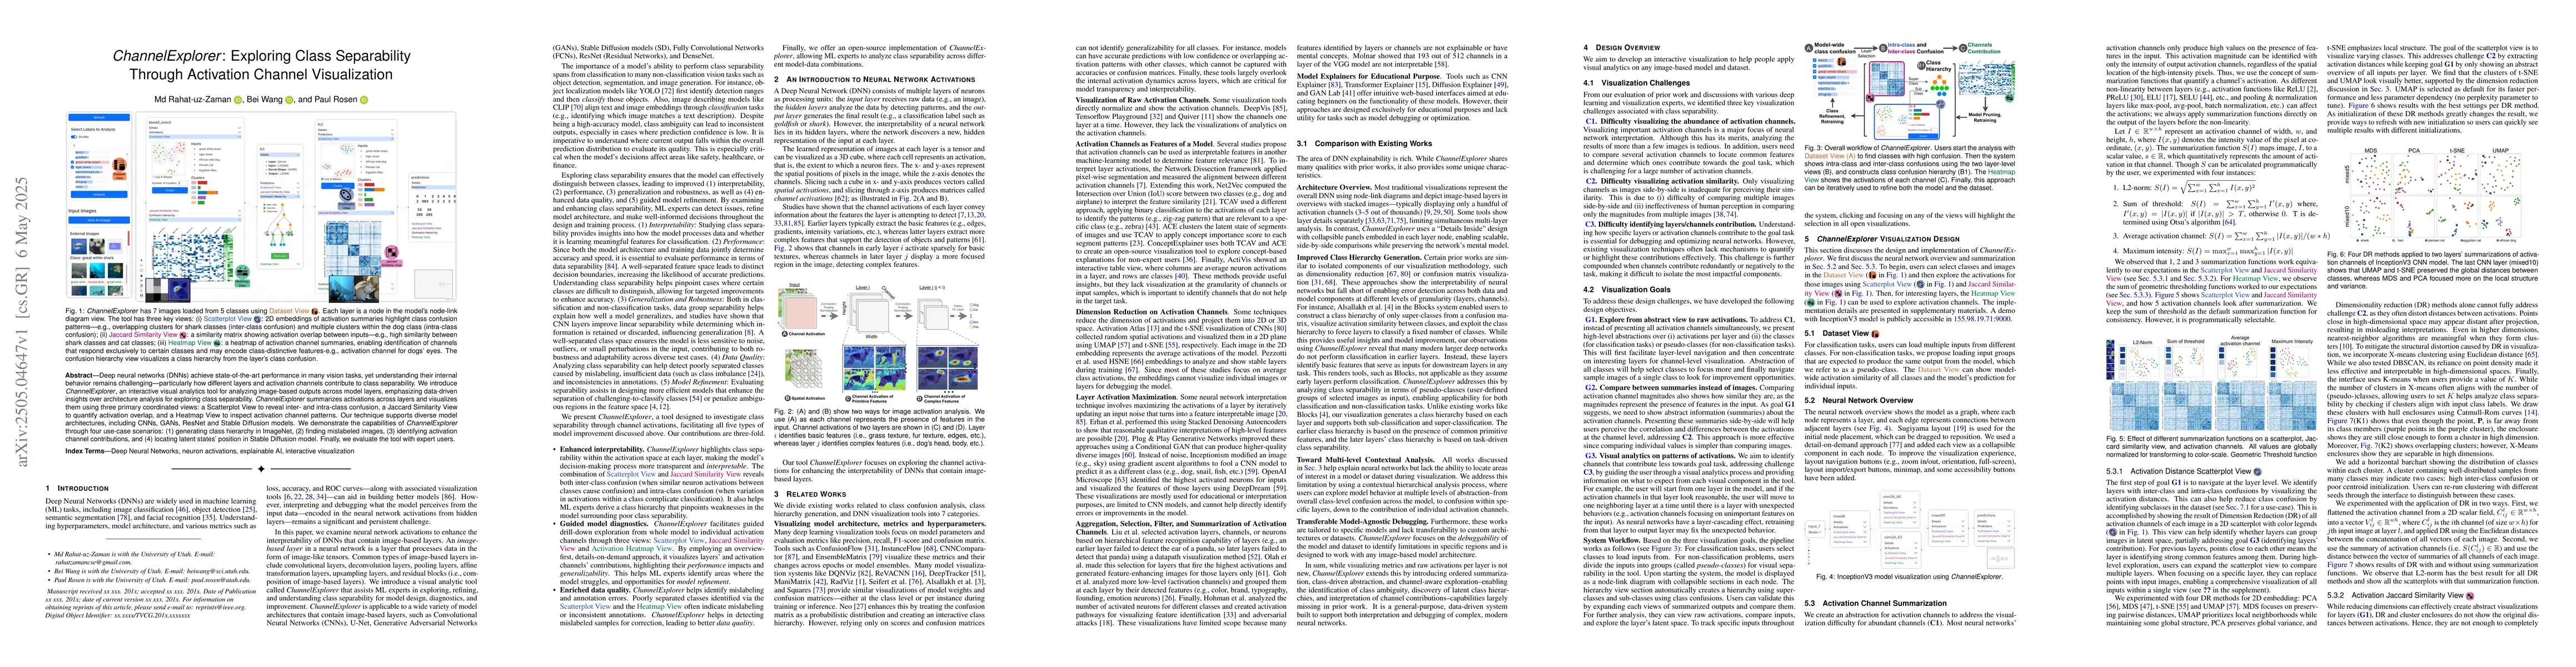
Deep neural networks (DNNs) achieve state-of-the-art performance in many vision tasks, yet understanding their internal behavior remains challenging, particularly how different layers and activation c...
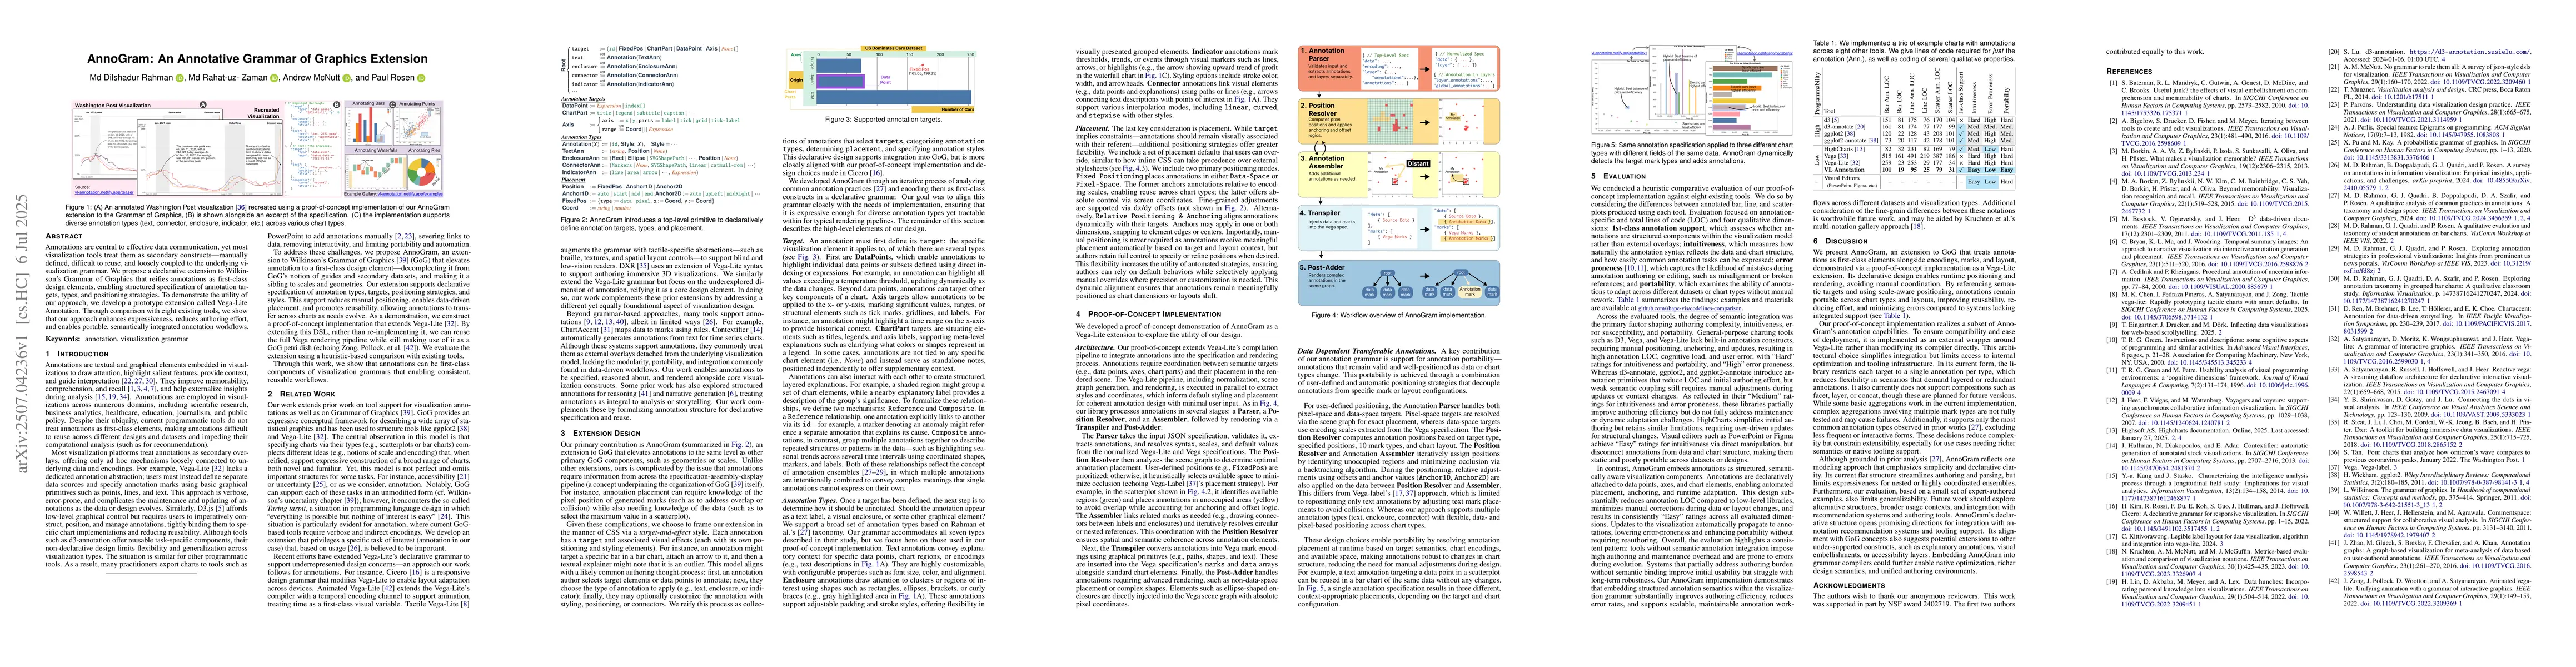
Annotations are central to effective data communication, yet most visualization tools treat them as secondary constructs -- manually defined, difficult to reuse, and loosely coupled to the underlying ...
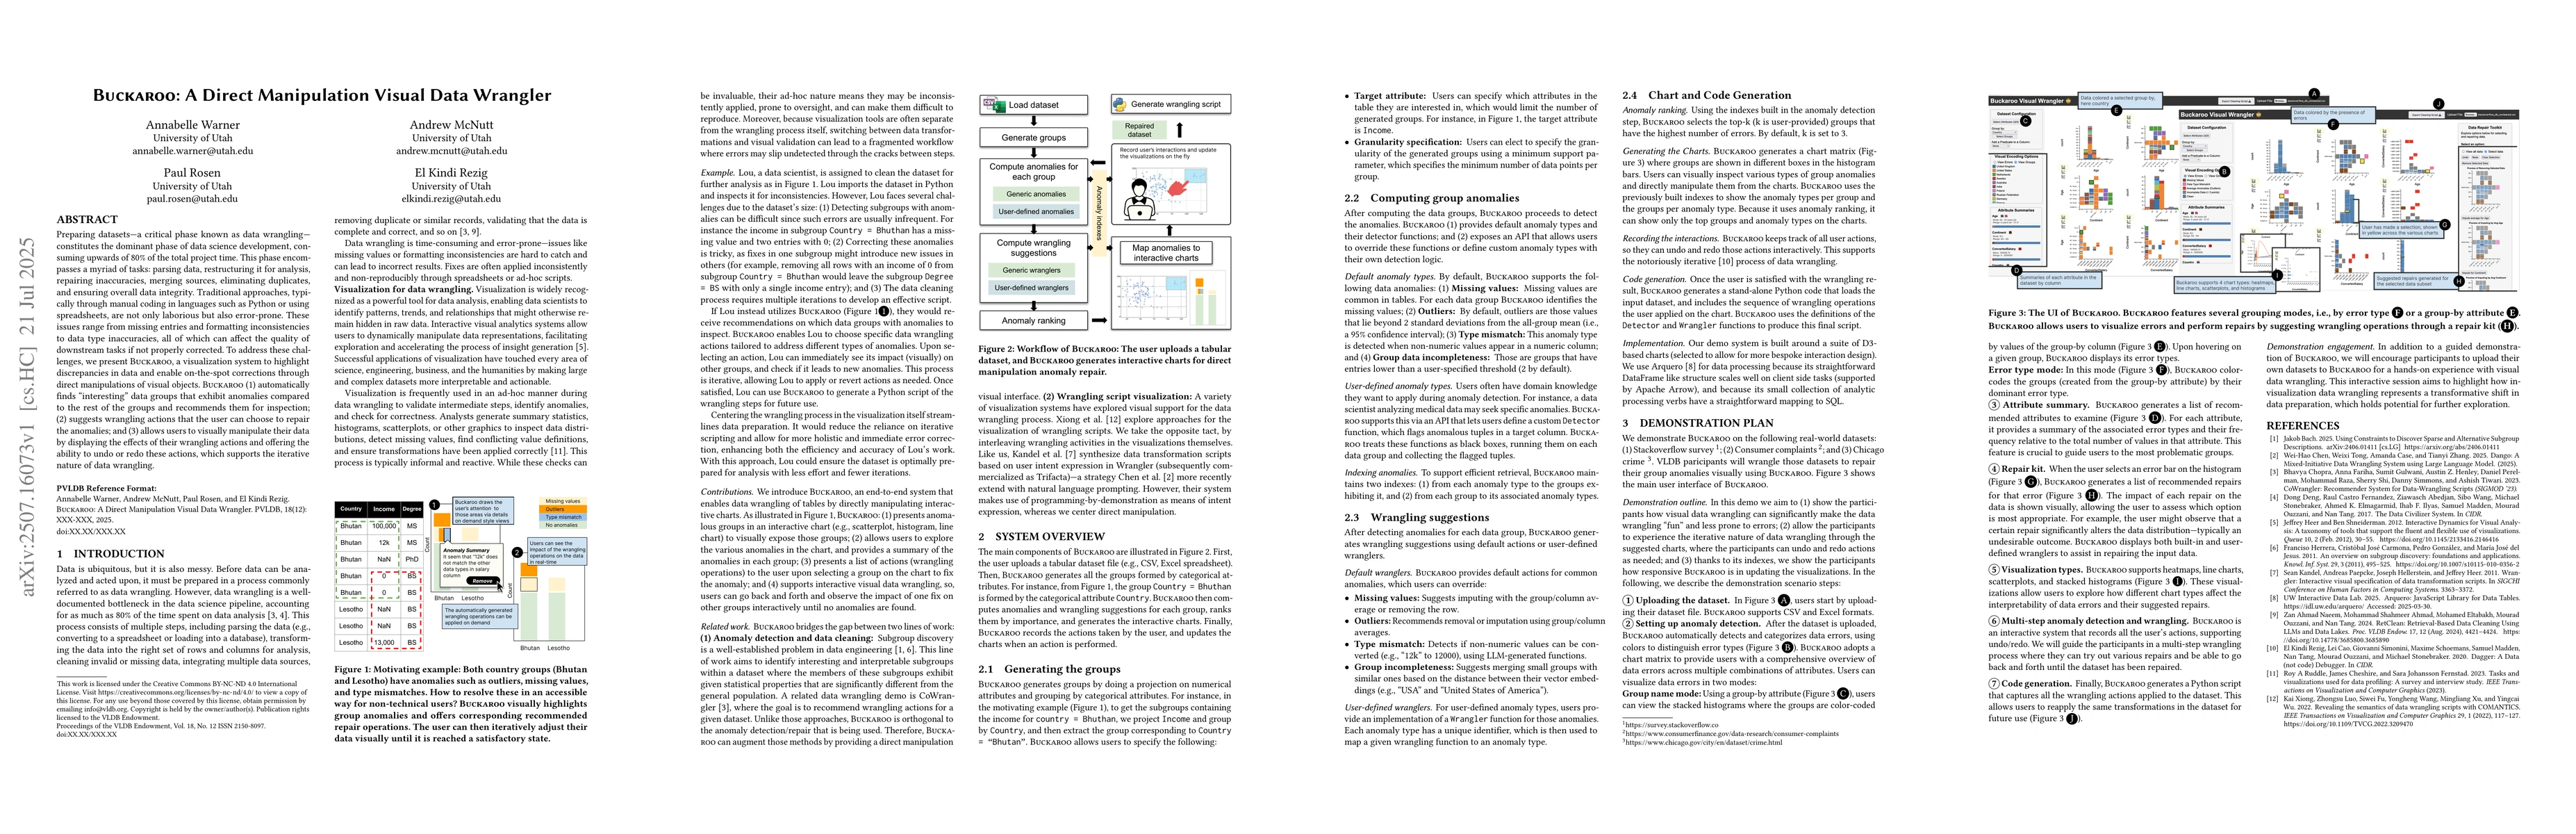
Preparing datasets -- a critical phase known as data wrangling -- constitutes the dominant phase of data science development, consuming upwards of 80% of the total project time. This phase encompasses...
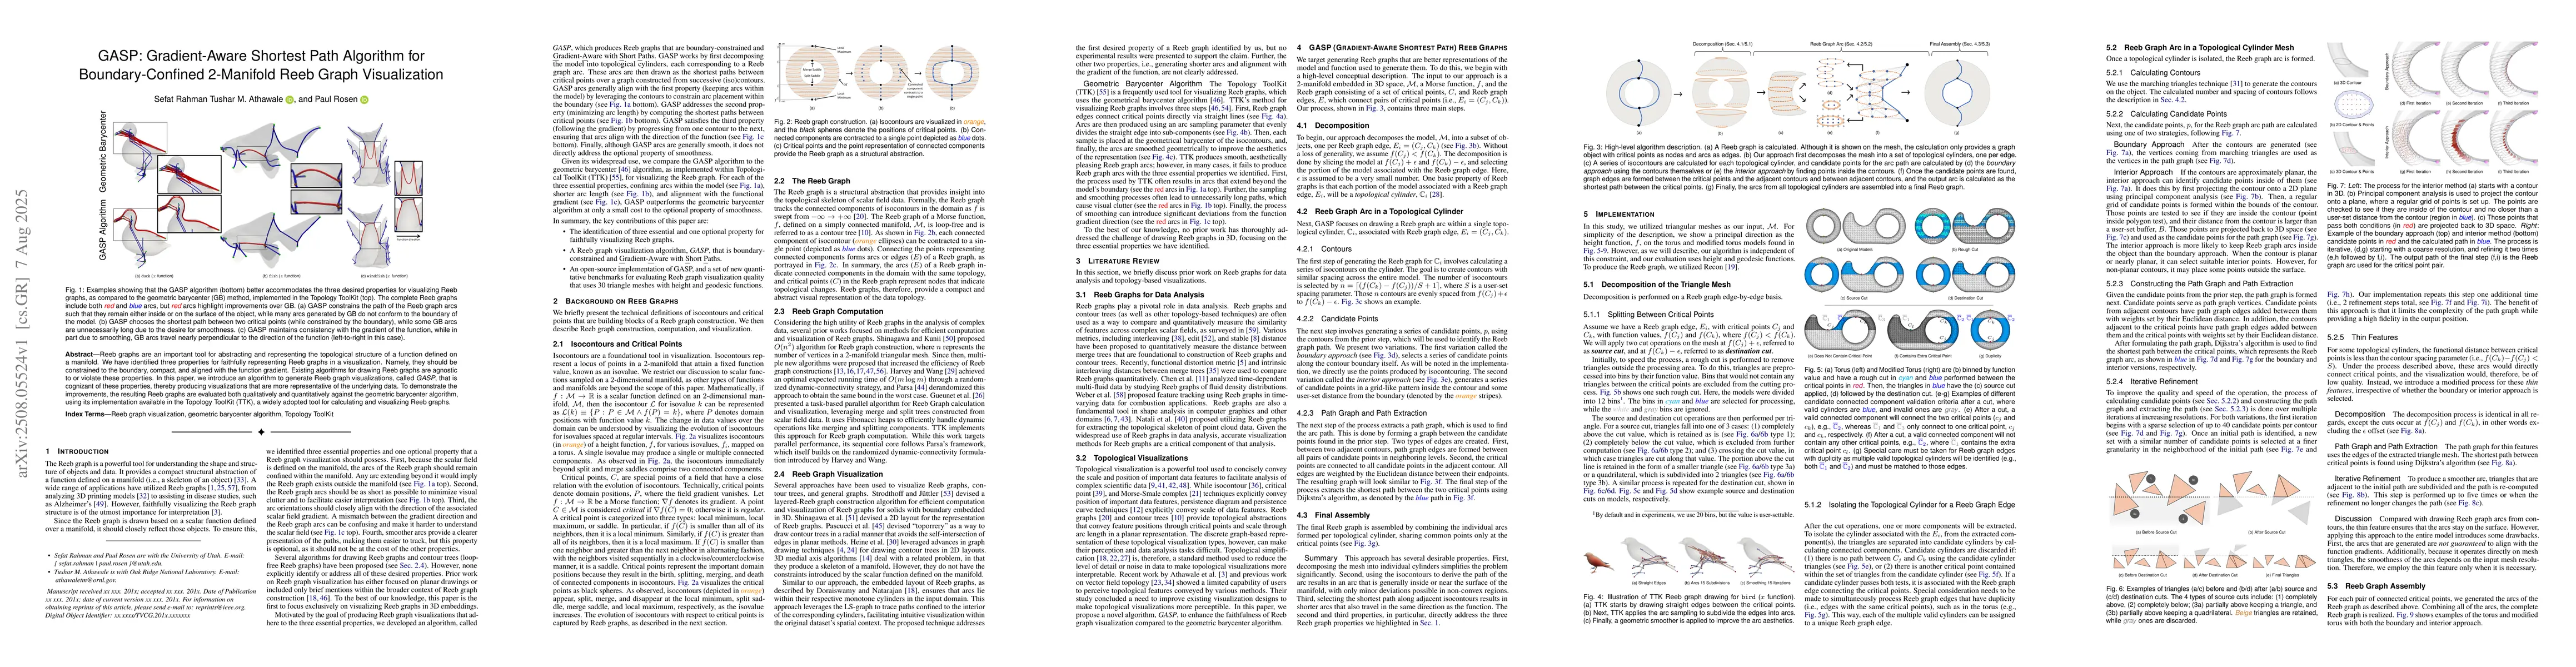
Reeb graphs are an important tool for abstracting and representing the topological structure of a function defined on a manifold. We have identified three properties for faithfully representing Reeb g...
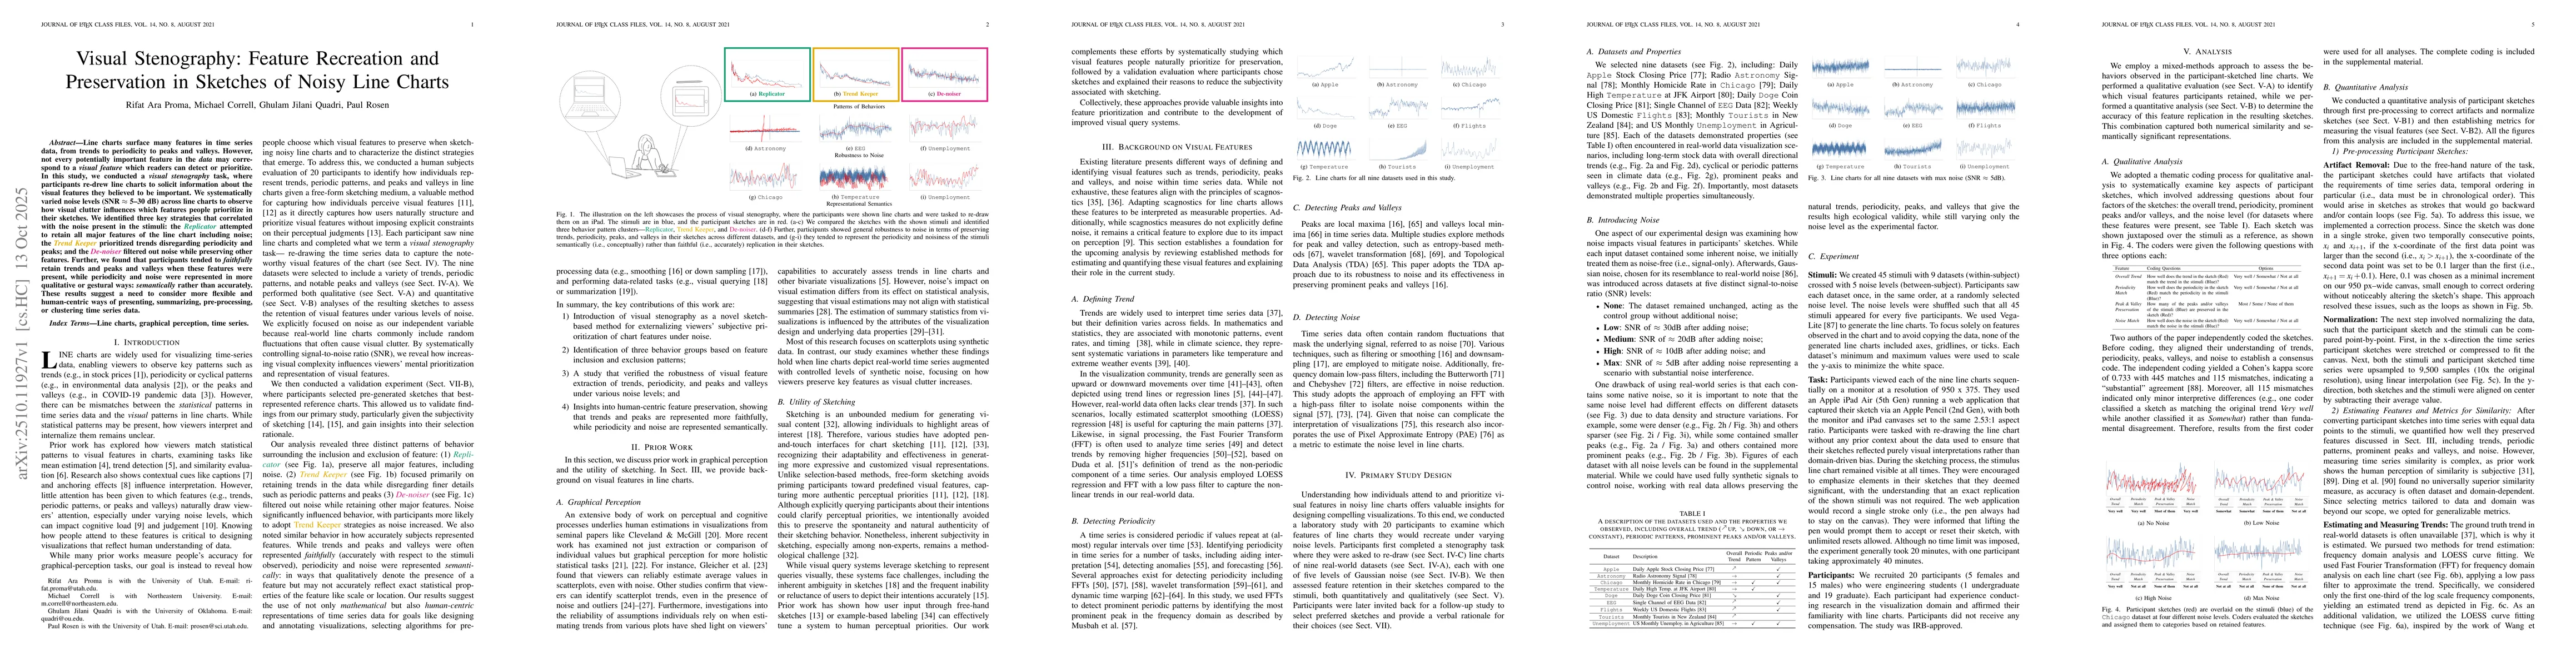
Line charts surface many features in time series data, from trends to periodicity to peaks and valleys. However, not every potentially important feature in the data may correspond to a visual feature ...
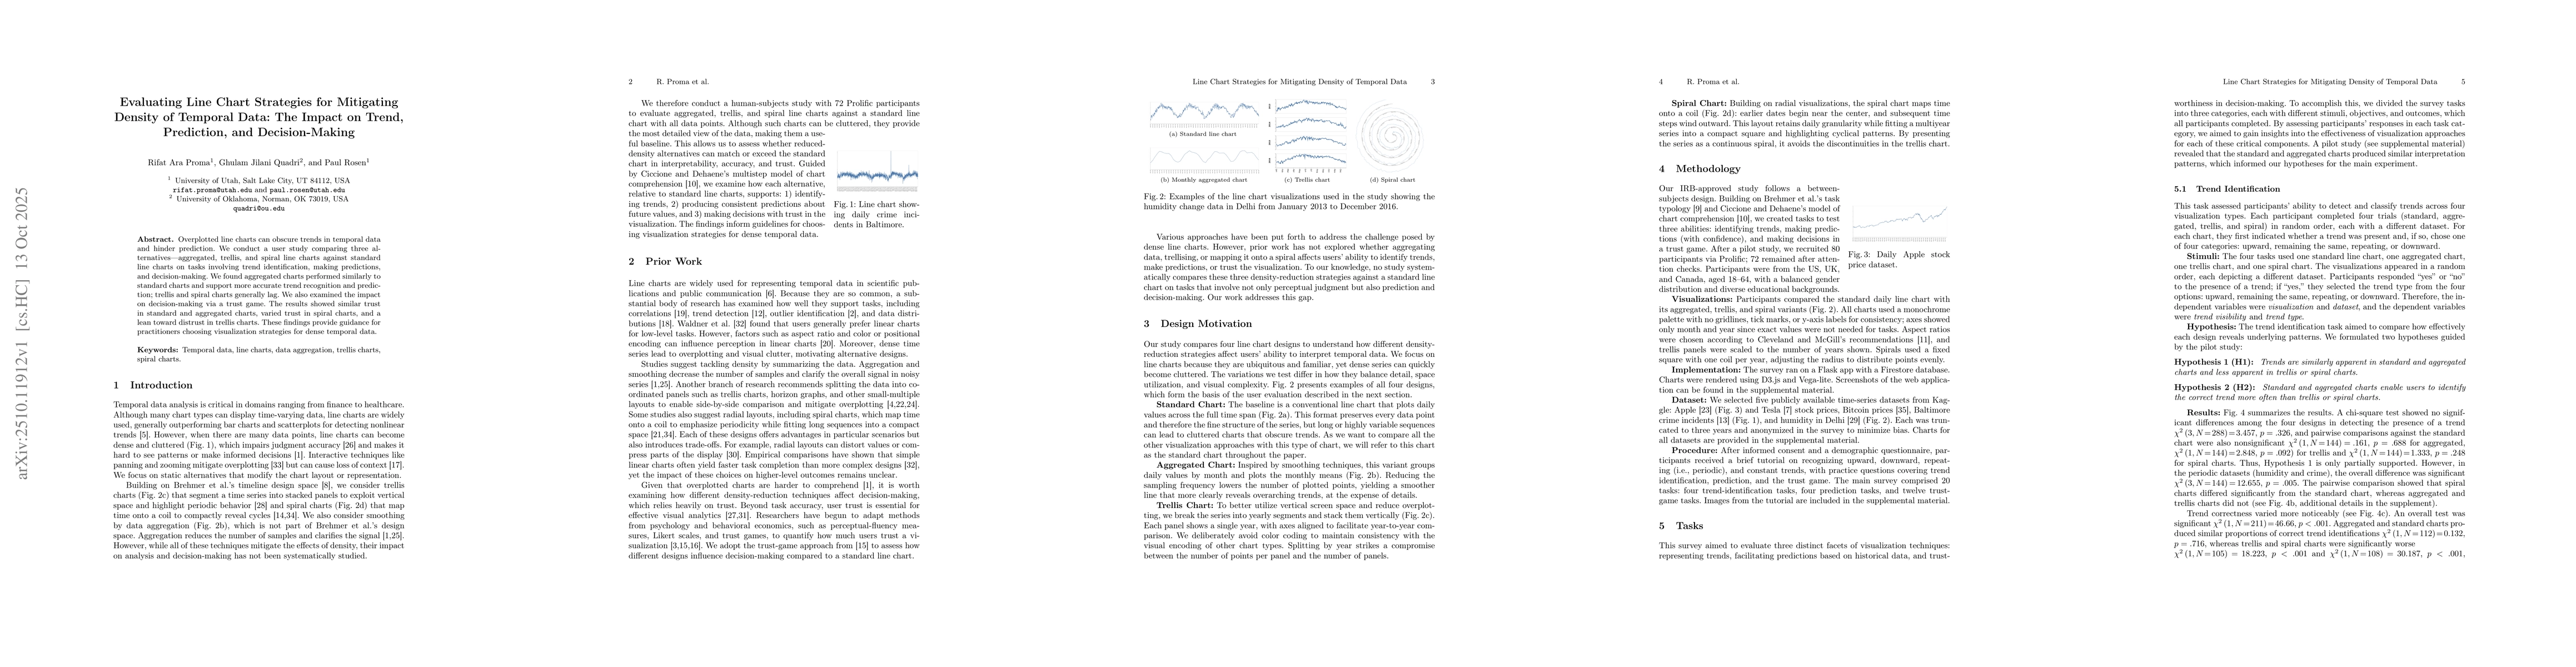
Overplotted line charts can obscure trends in temporal data and hinder prediction. We conduct a user study comparing three alternatives-aggregated, trellis, and spiral line charts against standard lin...
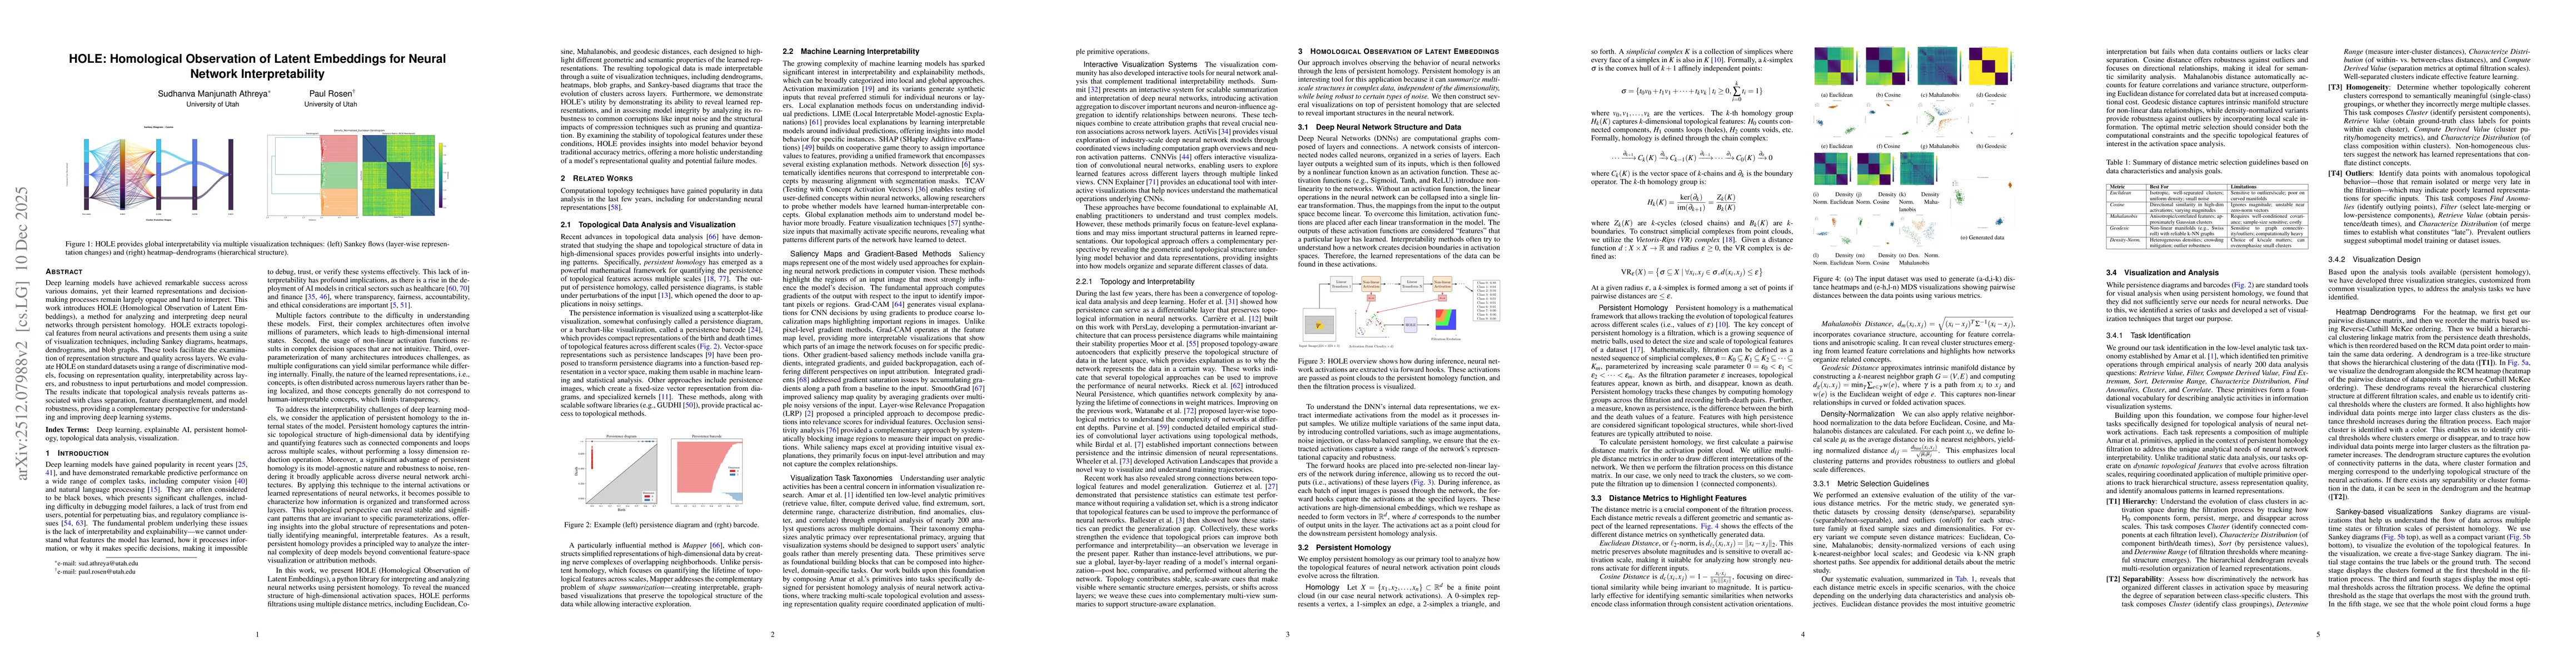
Deep learning models have achieved remarkable success across various domains, yet their learned representations and decision-making processes remain largely opaque and hard to interpret. This work int...
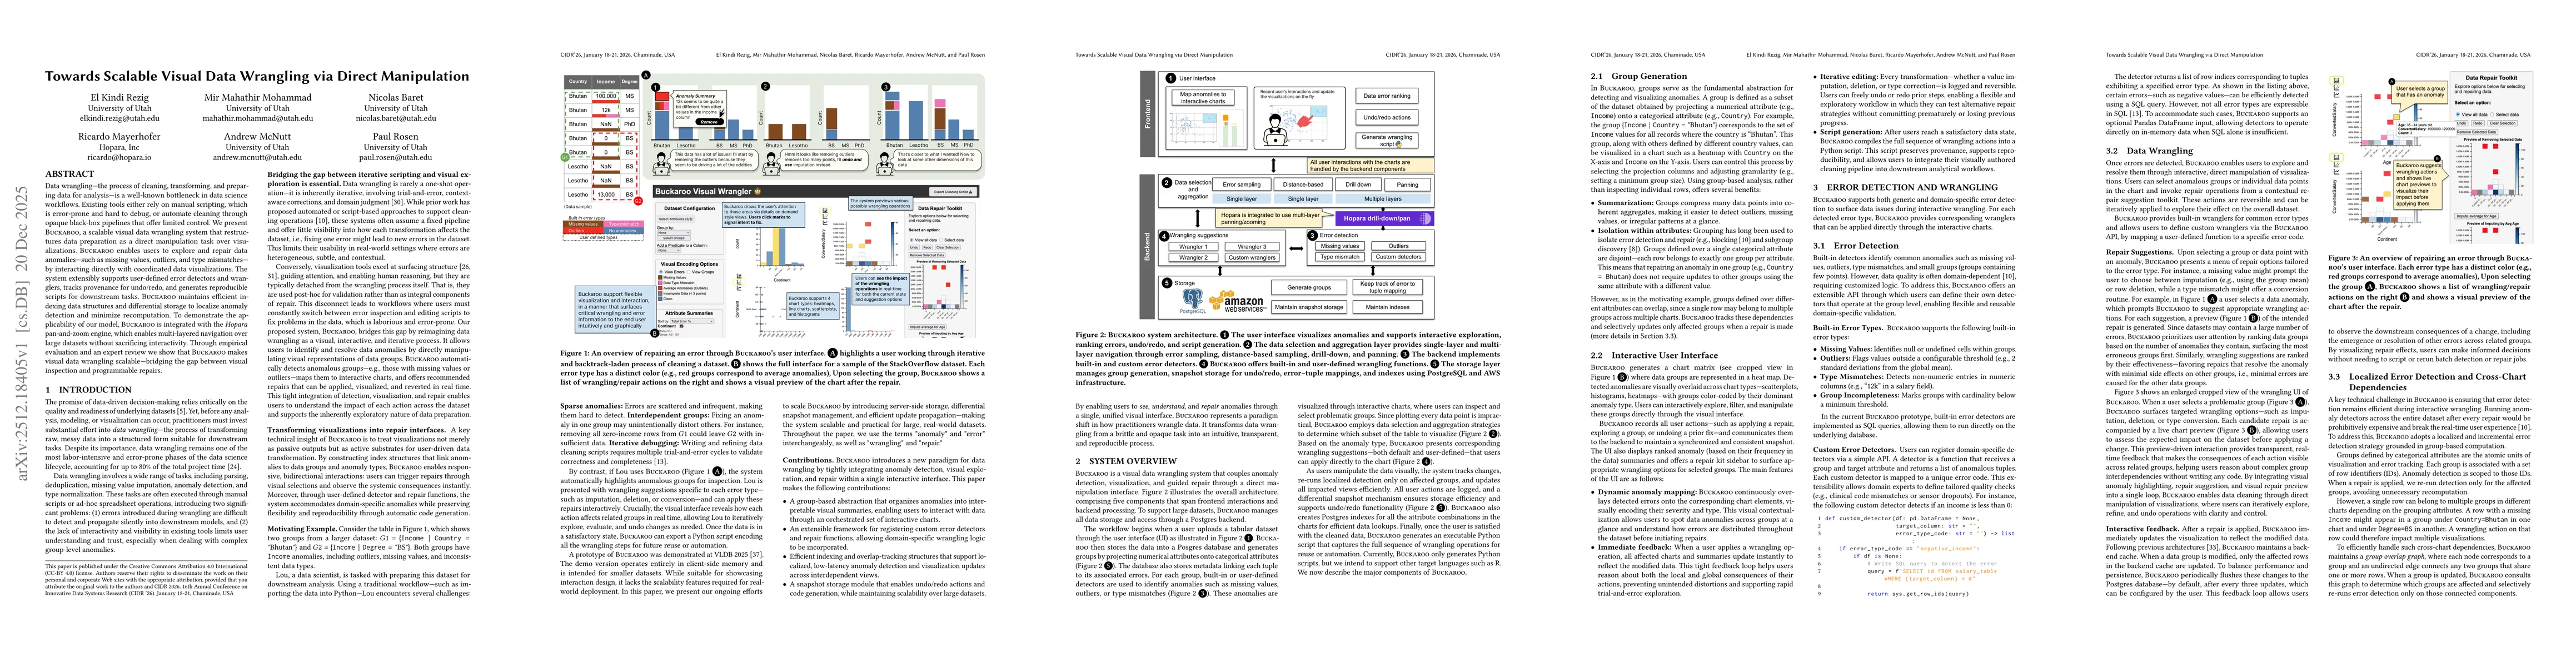
Data wrangling - the process of cleaning, transforming, and preparing data for analysis - is a well-known bottleneck in data science workflows. Existing tools either rely on manual scripting, which is...
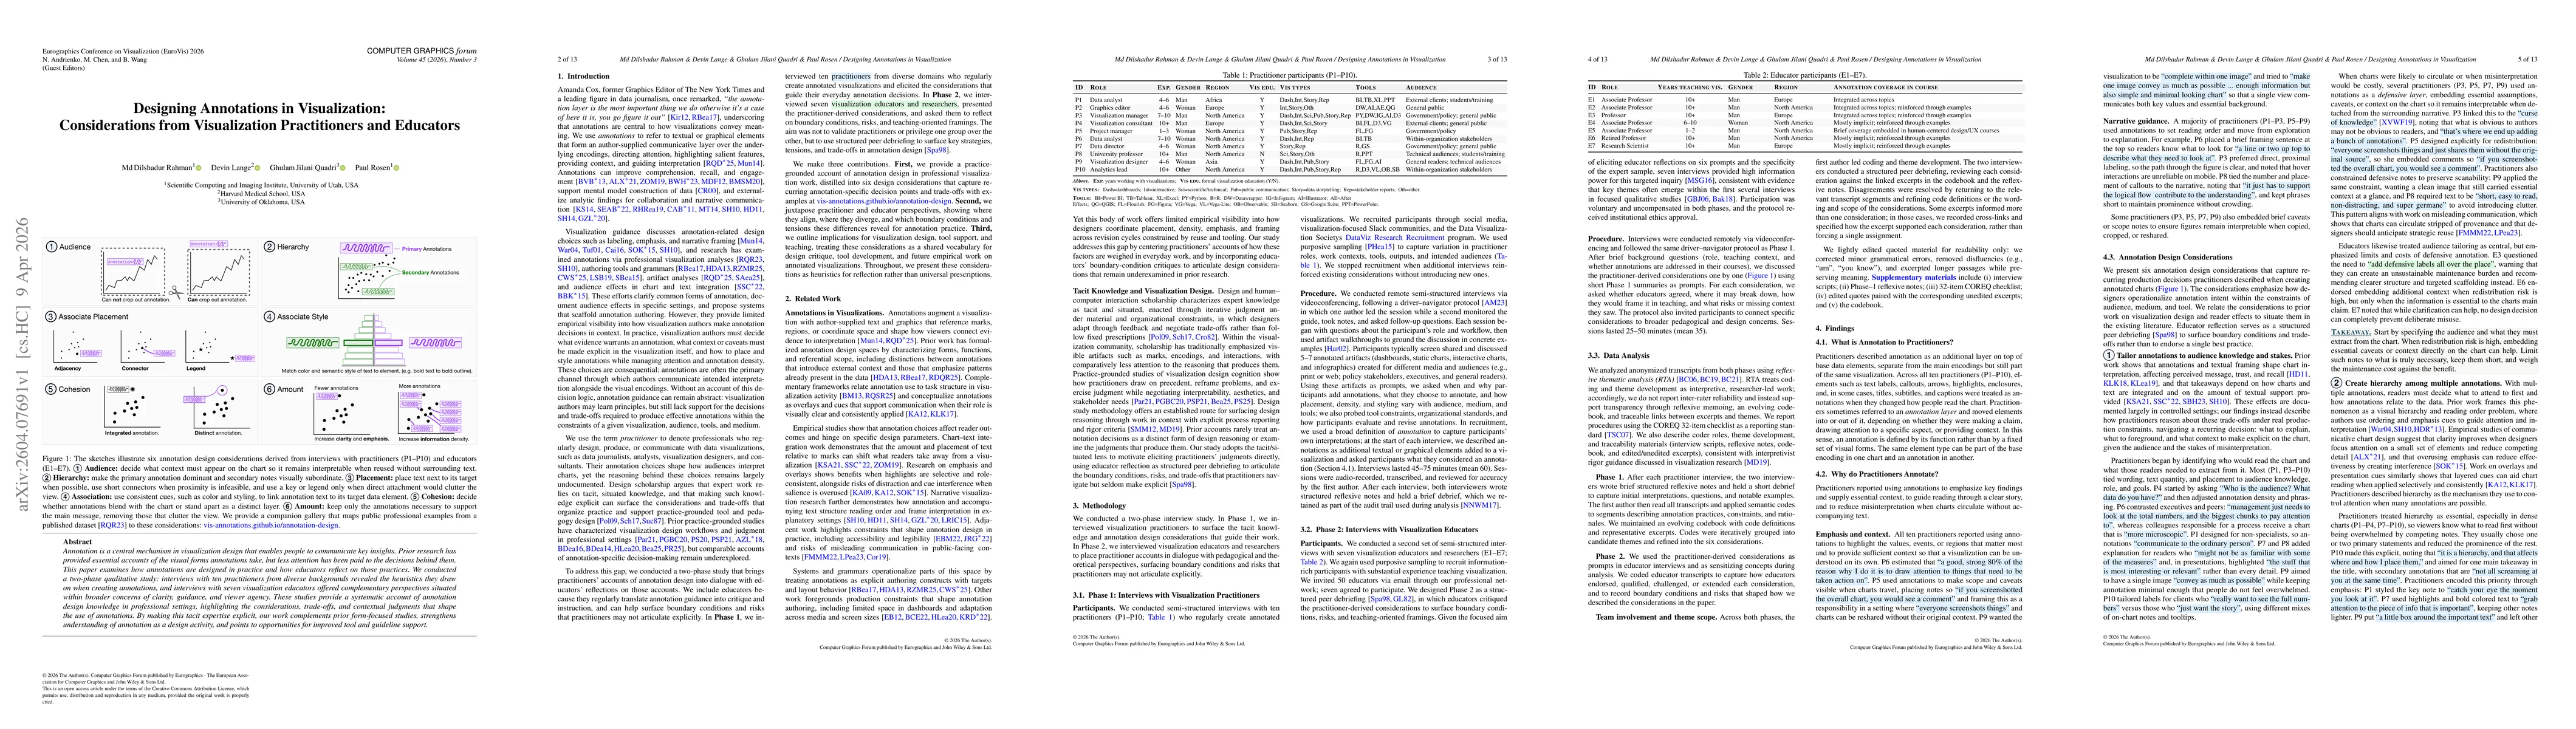
Annotation is a central mechanism in visualization design that enables people to communicate key insights. Prior research has provided essential accounts of the visual forms annotations take, but less...
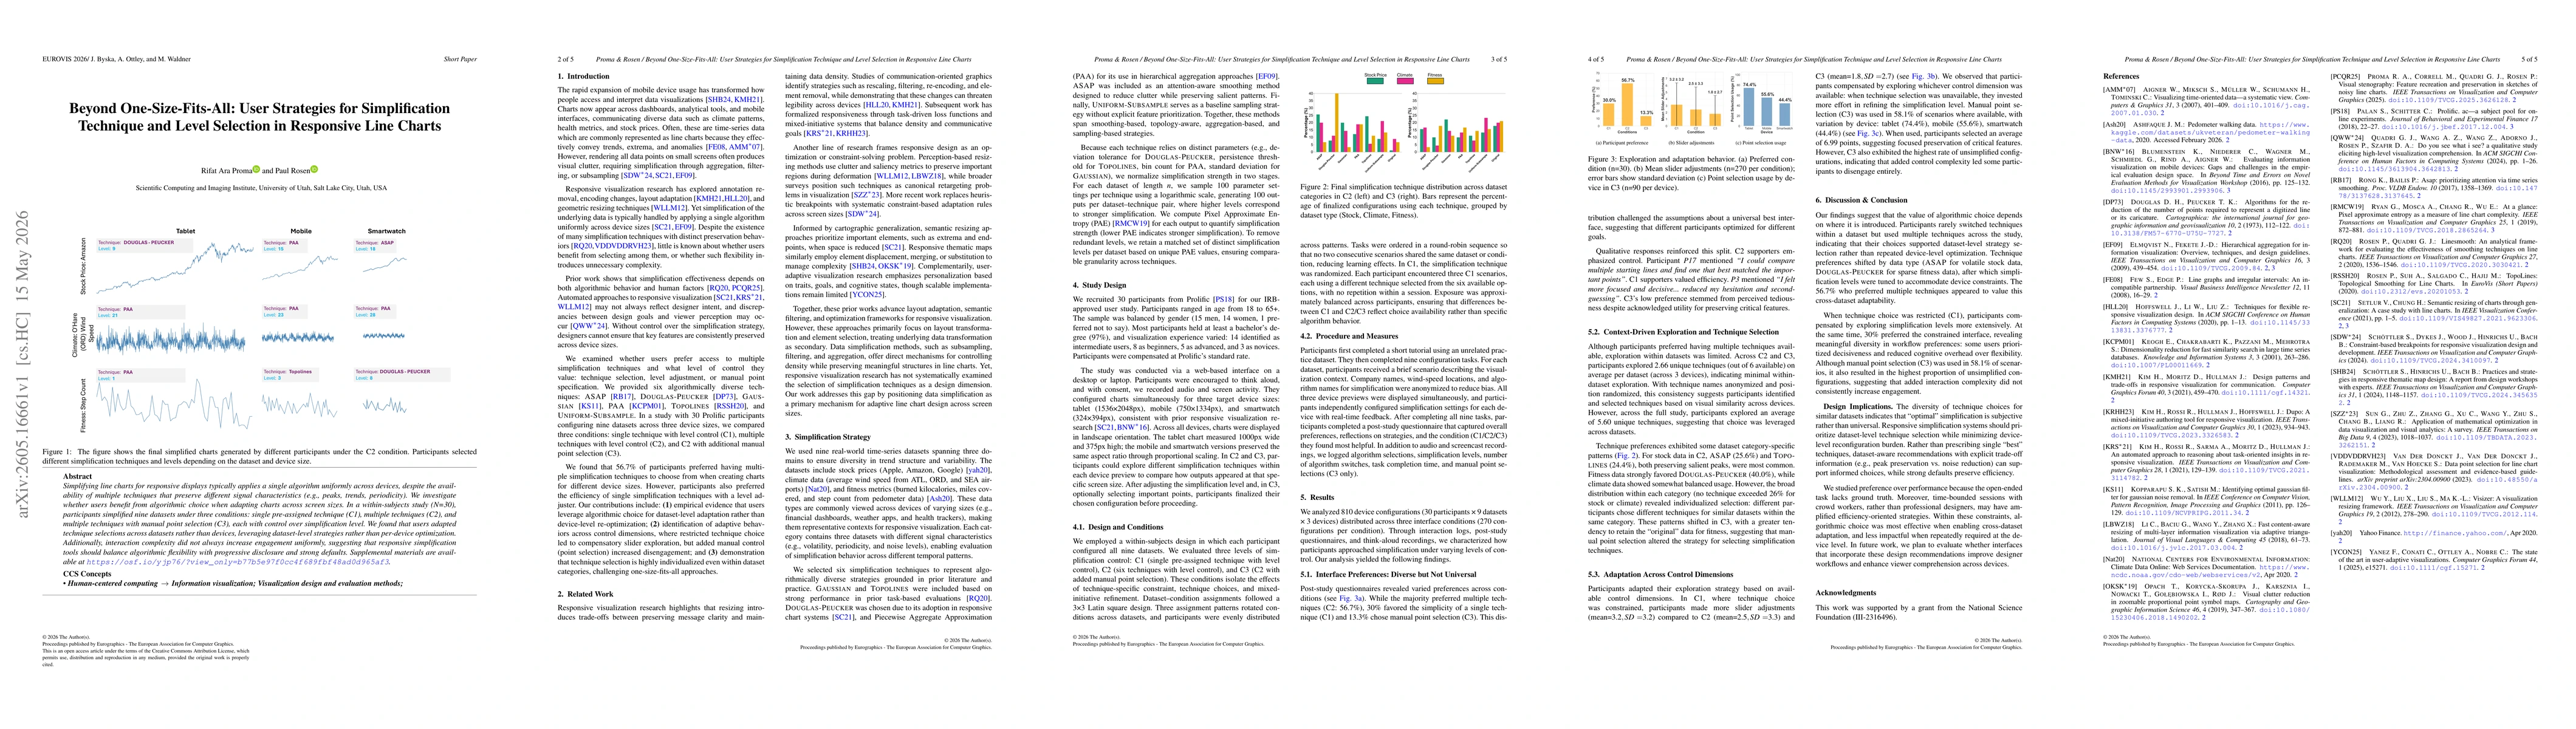
Simplifying line charts for responsive displays typically applies a single algorithm uniformly across devices, despite the availability of multiple techniques that preserve different signal characteri...