Automatic Scatterplot Design Optimization for Clustering Identification
Publication
Metrics
AI Quick Summary
This paper proposes an automatic tool to optimize scatterplot design factors to enhance clustering identification. The tool leverages merge trees and optimizes parameters like subsampling, sampling rate, marker size, and opacity, validated through user and case studies showing effective, high-quality visualizations.
Paper Preview
Abstract
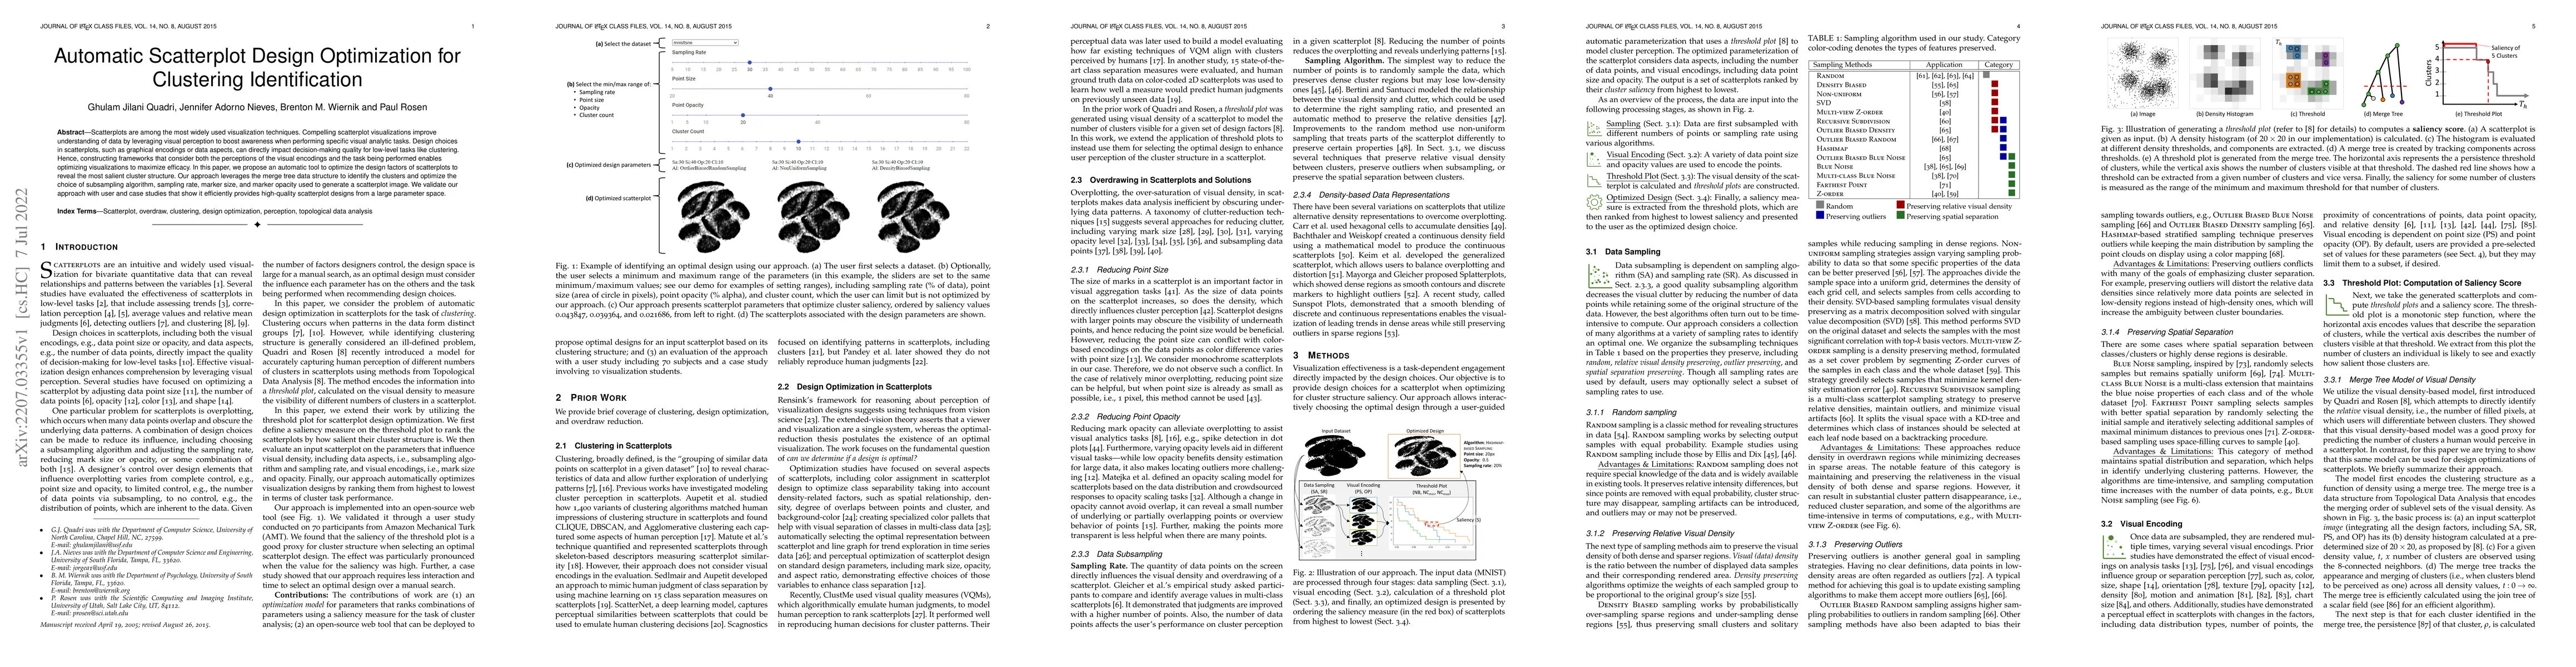
Scatterplots are among the most widely used visualization techniques. Compelling scatterplot visualizations improve understanding of data by leveraging visual perception to boost awareness when performing specific visual analytic tasks. Design choices in scatterplots, such as graphical encodings or data aspects, can directly impact decision-making quality for low-level tasks like clustering. Hence, constructing frameworks that consider both the perceptions of the visual encodings and the task being performed enables optimizing visualizations to maximize efficacy. In this paper, we propose an automatic tool to optimize the design factors of scatterplots to reveal the most salient cluster structure. Our approach leverages the merge tree data structure to identify the clusters and optimize the choice of subsampling algorithm, sampling rate, marker size, and marker opacity used to generate a scatterplot image. We validate our approach with user and case studies that show it efficiently provides high-quality scatterplot designs from a large parameter space.
AI Key Findings
Get AI-generated insights about this paper's methodology, results, significance, and more — seven facets brought into focus.
Impact
Paper Details
Authors
PDF Preview
Key Terms
Citation Network
Current paper (gray), citations (green), references (blue)
Display is limited for performance on very large graphs.
Discussion 0