This survey investigates the role of annotations in information visualization, assessing their impact on user engagement, comprehension, and memorability. It also reviews tools and applications for annotations, identifies research gaps, and proposes future research directions to guide visualization designers and practitioners.
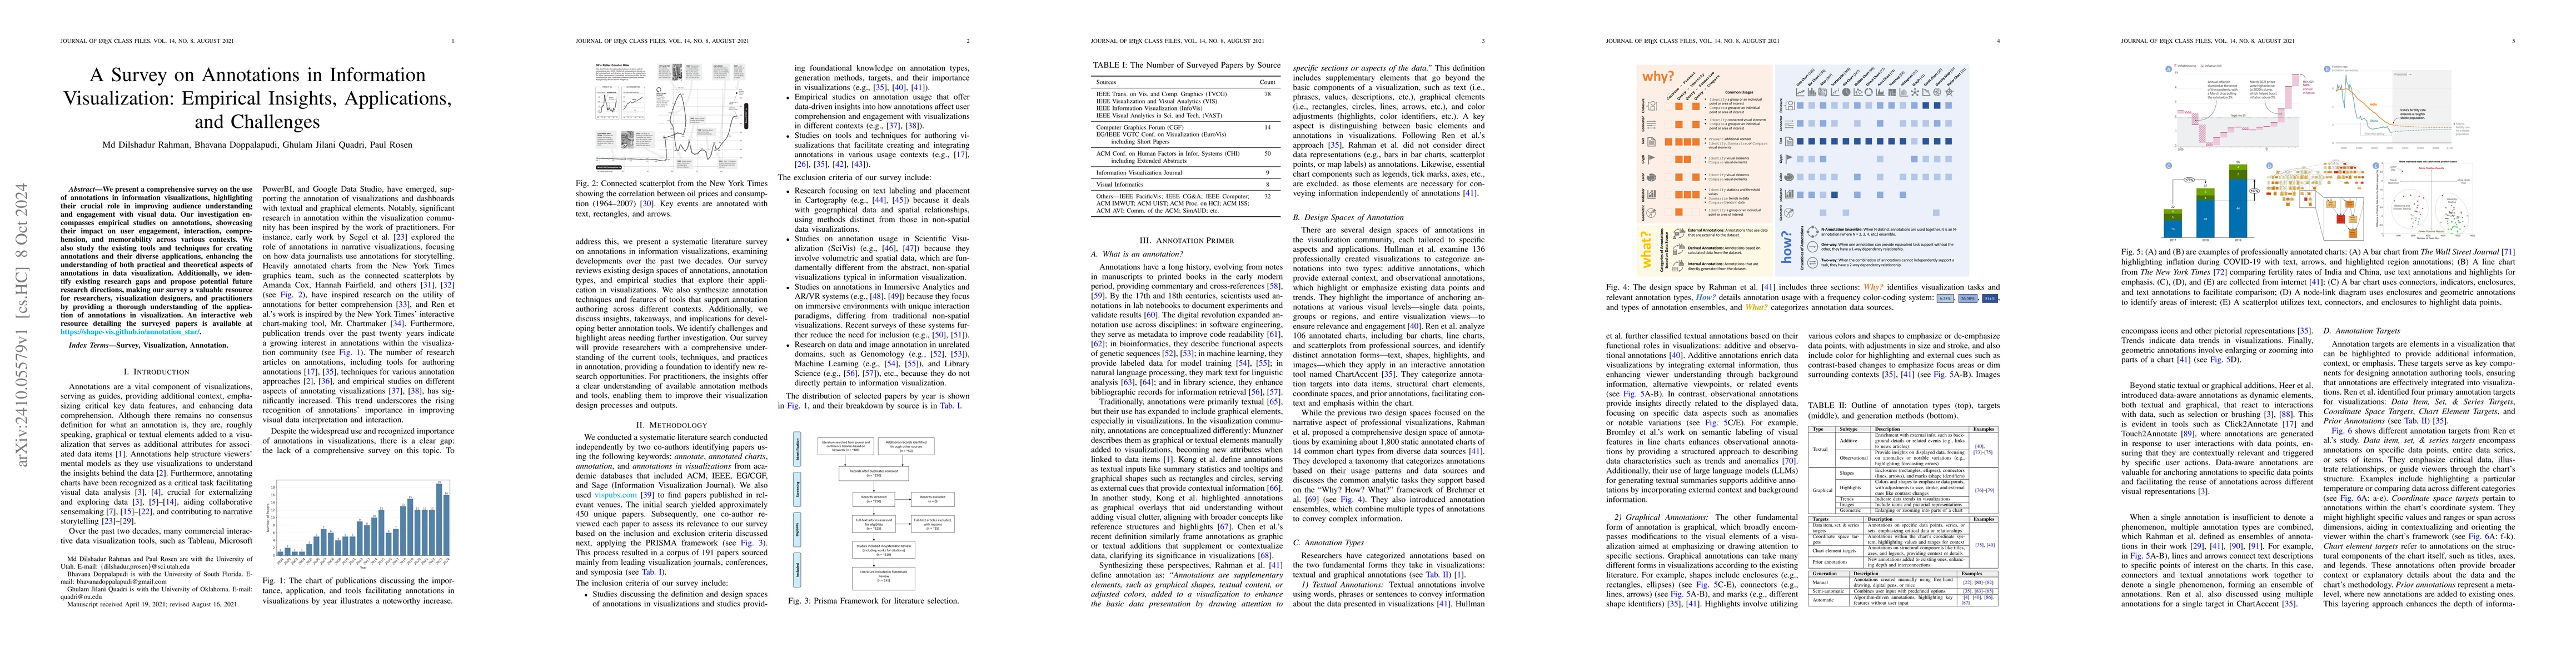
We present a comprehensive survey on the use of annotations in information visualizations, highlighting their crucial role in improving audience understanding and engagement with visual data. Our investigation encompasses empirical studies on annotations, showcasing their impact on user engagement, interaction, comprehension, and memorability across various contexts. We also study the existing tools and techniques for creating annotations and their diverse applications, enhancing the understanding of both practical and theoretical aspects of annotations in data visualization. Additionally, we identify existing research gaps and propose potential future research directions, making our survey a valuable resource for researchers, visualization designers, and practitioners by providing a thorough understanding of the application of annotations in visualization.
Get AI-generated insights about this paper's methodology, results, and significance.
Current paper (gray), citations (green), references (blue)
Dongxiao He, Di Jin, Zhidong Zhao et al.
Li Dong, Feibo Jiang, Dusit Niyato et al.
Shahabedin Nabavi, Mohsen Ebrahimi Moghaddam, Atefe Aghaei et al.
Ye Yuan, Dacheng Tao, Qingqing Long et al.
Title | Authors | Year | Actions |
---|---|---|---|
CHART-6: Human-Centered Evaluation of Data Visualization Understanding in Vision-Language Models
|
Arnav Verma, Kushin Mukherjee, Christopher Potts, Elisa Kreiss, J. E. Fan
|
2025
|
View Paper |
PyNarrative: A Python Library for Data Storytelling
|
A. L. Duca, Roberto Barsotti
|
2025
|
View Paper |
Title | Authors | Year | Actions |
---|---|---|---|
Exploring annotation taxonomy in grouped bar charts: A qualitative classroom study
|
Md Dilshadur Rahman, Ghulam Jilani Quadri, D. Szafir, Paul Rosen
|
2024
|
View Paper |
A Deixis-Centered Approach for Documenting Remote Synchronous Communication Around Data Visualizations
|
Chang Han, Katherine E. Isaacs
|
2024
|
View Paper |
Discursive Patinas: Anchoring Discussions in Data Visualizations
|
Tobias Kauer, Derya Akbaba, M. Dörk, Benjamin Bach
|
2024
|
View Paper |
Enhancing Data Literacy On-demand: LLMs as Guides for Novices in Chart Interpretation.
|
Kiroong Choe, Chaerin Lee, S. Lee, Jiwon Song, Aeri Cho, Nam Wook Kim, Jinwook Seo
|
2024
|
View Paper |
Linking Text and Visualizations via Contextual Knowledge Graph.
|
Xiwen Cai, Di Weng, Taotao Fu, Siwei Fu, Yongheng Wang, Yingcai Wu
|
2024
|
View Paper |
Exploring the Capability of LLMs in Performing Low-Level Visual Analytic Tasks on SVG Data Visualizations
|
Zhongzhen Xu, Emily Wall
|
2024
|
View Paper |
Understanding and Automating Graphical Annotations on Animated Scatterplots
|
Danqing Shi, Antti Oulasvirta, T. Weinkauf, Nan Cao
|
2024
|
View Paper |
What We Augment When We Augment Visualizations: A Design Elicitation Study of How We Visually Express Data Relationships
|
G. Guo, J. Stasko, A. Endert
|
2024
|
View Paper |
Understanding Reader Takeaways in Thematic Maps Under Varying Text, Detail, and Spatial Autocorrelation
|
Arlen Fan, Fan Lei, M. Mancenido, A. Maceachren, Ross Maciejewski
|
2024
|
View Paper |
Do You See What I See? A Qualitative Study Eliciting High-Level Visualization Comprehension
|
Ghulam Jilani Quadri, Arran Zeyu Wang, Zhehao Wang, Jennifer Adorno, Paul Rosen, D. Szafir
|
2024
|
View Paper |
Almanac: An API for Recommending Text Annotations For Time-Series Charts Using News Headlines
|
Terrell Ibanez, V. Setlur, Maneesh Agrawala
|
2023
|
View Paper |
The Role of Text in Visualizations: How Annotations Shape Perceptions of Bias and Influence Predictions
|
Chase Stokes, Cindy Xiong Bearfield, Marti A. Hearst
|
2023
|
View Paper |
Swaying the Public? Impacts of Election Forecast Visualizations on Emotion, Trust, and Intention in the 2022 U.S. Midterms
|
Midterms, Fumeng Yang, Mandi Cai, C. Mortenson, Hoda Fakhari, A. Lokmanoglu, J. Hullman, S. Franconeri, Nicholas Diakopoulos, E. Nisbet, Matthew Kay
|
2023
|
View Paper |
TimeSplines: Sketch-Based Authoring of Flexible and Idiosyncratic Timelines
|
A. Offenwanger, M. Brehmer, Fanny Chevalier, Theophanis Tsandilas
|
2023
|
View Paper |
Embellishments Revisited: Perceptions of Embellished Visualisations Through the Viewer's Lens
|
Muna Alebri, Enrico Costanza, Georgia Panagiotidou, Duncan P. Brumby
|
2023
|
View Paper |
Natural Language Dataset Generation Framework for Visualizations Powered by Large Language Models
|
Hyung-Kwon Ko, Hyeon Jeon, Gwanmo Park, Dae Hyun Kim, Nam Wook Kim, Juho Kim, Jinwook Seo
|
2023
|
View Paper |
VisAhoi: Towards a Library to Generate and Integrate Visualization Onboarding Using High-level Visualization Grammars
|
C. Stoiber, Daniela Moitzi, Holger Stitz, Florian Grassinger, Anto Silviya Geo Prakash, Dominic Girardi, M. Streit, W. Aigner
|
2023
|
View Paper |
Calliope-Net: Automatic Generation of Graph Data Facts via Annotated Node-Link Diagrams
|
Qing Chen, Nan Chen, W. Shuai, Guande Wu, Zhe Xu, H. Tong, Nana Cao
|
2023
|
View Paper |
What Is the Difference Between a Mountain and a Molehill? Quantifying Semantic Labeling of Visual Features in Line Charts
|
Dennis Bromley, V. Setlur
|
2023
|
View Paper |
Image or Information? Examining the Nature and Impact of Visualization Perceptual Classification
|
Anjana Arunkumar, Lace M. K. Padilla, Gi-Yeul Bae, Chris Bryan
|
2023
|
View Paper |
Survey of Annotations in Extended Reality Systems
|
Zahra Borhani, Prashast Sharma, F. Ortega
|
2023
|
View Paper |
A Qualitative Analysis of Common Practices in Annotations: A Taxonomy and Design Space
|
Md Dilshadur Rahman, Ghulam Jilani Quadri, Bhavana Doppalapudi, D. Szafir, Paul Rosen
|
2023
|
View Paper |
CALVI: Critical Thinking Assessment for Literacy in Visualizations
|
Lily W. Ge, Yuanling Cui, Matthew Kay
|
2023
|
View Paper |
We are the Data: Challenges and Opportunities for Creating Demographically Diverse Anthropographics
|
Priya Dhawka, H. He, Wesley Willett
|
2023
|
View Paper |
Misleading Beyond Visual Tricks: How People Actually Lie with Charts
|
Maxim Lisnic, Cole Polychronis, A. Lex, M. Kogan
|
2023
|
View Paper |
Charagraph: Interactive Generation of Charts for Realtime Annotation of Data-Rich Paragraphs
|
Damien Masson, Sylvain Malacria, Géry Casiez, Daniel Vogel
|
2023
|
View Paper |
Data Abstraction Elephants: The Initial Diversity of Data Representations and Mental Models
|
Katy Williams, Alex Bigelow, Katherine E. Isaacs
|
2023
|
View Paper |
What is the message? Perspectives on Visual Data Communication
|
Laura Koesten, Kathleen Gregory, Regina Schuster, Christian Knoll, Sarah Davies, T. Möller
|
2023
|
View Paper |
Knowledge Graphs in Practice: Characterizing their Users, Challenges, and Visualization Opportunities
|
Harry Li, G. Appleby, C. Brumar, Remco Chang, Ashley Suh
|
2023
|
View Paper |
NetworkNarratives: Data Tours for Visual Network Exploration and Analysis
|
Wenchao Li, Sarah Schöttler, James Scott-Brown, Yun Wang, Siming Chen, Huamin Qu, Benjamin Bach
|
2023
|
View Paper |
GeoCamera: Telling Stories in Geographic Visualizations with Camera Movements
|
Wenchao Li, Zhanyi Wang, Yun Wang, Di Weng, Liwenhan Xie, Siming Chen, Haidong Zhang, Huamin Qu
|
2023
|
View Paper |
Why Combining Text and Visualization Could Improve Bayesian Reasoning: A Cognitive Load Perspective
|
Melanie Bancilhon, AJ Wright, Sunwoo Ha, Jordan Crouser, Alvitta Ottley
|
2023
|
View Paper |
Using Large Language Models to Generate Engaging Captions for Data Visualizations
|
A. Liew, Klaus Mueller
|
2022
|
View Paper |
From Invisible to Visible: Impacts of Metadata in Communicative Data Visualization
|
Alyxander Burns, C. Lee, Thai On, Cindy Xiong, Evan M. Peck, Narges Mahyar
|
2022
|
View Paper |
Using Annotations for Sensemaking About Code
|
Amber Horvath, B. Myers, A. Macvean, Imtiaz Rahman
|
2022
|
View Paper |
Geo-Storylines: Integrating Maps into Storyline Visualizations
|
Golina Hulstein, Vanessa Peña Araya, A. Bezerianos
|
2022
|
View Paper |
Striking a Balance: Reader Takeaways and Preferences when Integrating Text and Charts
|
Chase Stokes, V. Setlur, Bridget Cogley, Arvind Satyanarayan, Marti A. Hearst
|
2022
|
View Paper |
How Does Automation Shape the Process of Narrative Visualization: A Survey of Tools
|
Qing Chen, Shixiong Cao, Jiazhe Wang, Nan Cao
|
2022
|
View Paper |
Put a Label On It! Approaches for Constructing and Contextualizing Bar Chart Physicalizations
|
Kim Sauvé, A. Ramirez Gomez, Steven Houben
|
2022
|
View Paper |
Annotating Line Charts for Addressing Deception
|
Arlen Fan, Yuxin Ma, M. Mancenido, Ross Maciejewski
|
2022
|
View Paper |
Integrating annotations into multidimensional visual dashboards
|
Sriram Karthik Badam, Senthil K. Chandrasegaran, N. Elmqvist
|
2022
|
View Paper |
IRVINE: A Design Study on Analyzing Correlation Patterns of Electrical Engines
|
Joscha Eirich, Jakob Bonart, Dominik Jackle, M. Sedlmair, Ute Schmid, K. Fischbach, Tobias Schreck, J. Bernard
|
2021
|
View Paper |
Reusing Interactive Analysis Workflows
|
K. Gadhave, Zach Cutler, A. Lex
|
2021
|
View Paper |
Data Hunches: Incorporating Personal Knowledge into Visualizations
|
Haihan Lin, Derya Akbaba, Miriah D. Meyer, A. Lex
|
2021
|
View Paper |
Predicting intent behind selections in scatterplot visualizations
|
K. Gadhave, Jochen Görtler, Zach Cutler, C. Nobre, O. Deussen, Miriah D. Meyer, J. M. Phillips, A. Lex
|
2021
|
View Paper |
Understanding Data Visualization Design Practice
|
Paul C. Parsons
|
2021
|
View Paper |
VisInReport: Complementing Visual Discourse Analytics Through Personalized Insight Reports
|
R. Sevastjanova, Mennatallah El-Assady, A. Bradley, C. Collins, Miriam Butt, D. Keim
|
2021
|
View Paper |
Kori: Interactive Synthesis of Text and Charts in Data Documents
|
Shahid Latif, Zhengzhong Zhou, Yoon Kim, Fabian Beck, N. Kim
|
2021
|
View Paper |
Exploring the Personal Informatics Analysis Gap: “There's a Lot of Bacon”
|
Jimmy Moore, Pascal Goffin, Jason Wiese, Miriah D. Meyer
|
2021
|
View Paper |
Unification of functional annotation descriptions using text mining
|
P. Queirós, Polina V. Novikova, P. Wilmes, P. May
|
2021
|
View Paper |
Communicating with Motion: A Design Space for Animated Visual Narratives in Data Videos
|
Yang Shi, Xingyu Lan, Jingwen Li, Zhaorui Li, Nan Cao
|
2021
|
View Paper |
Sketchnote Components, Design Space Dimensions, and Strategies for Effective Visual Note Taking
|
Rebecca Zheng, Marina Fernández Camporro, Hugo Romat, Nathalie Henry Riche, Benjamin Bach, Fanny Chevalier, K. Hinckley, Nicolai Marquardt
|
2021
|
View Paper |
Declutter and Focus: Empirically Evaluating Design Guidelines for Effective Data Communication
|
Kiran Ajani, Elsie Lee, Cindy Xiong, Cole Nussbaumer Knaflic, William T. Kemper, S. Franconeri
|
2021
|
View Paper |
The Public Life of Data: Investigating Reactions to Visualizations on Reddit
|
Tobias Kauer, Arran L. Ridley, M. Dörk, B. Bach
|
2021
|
View Paper |
ChartStory: Automated Partitioning, Layout, and Captioning of Charts into Comic-Style Narratives
|
Jian Zhao, Shenyu Xu, Senthil K. Chandrasegaran, Chris Bryan, F. Du, Aditi Mishra, Xin Qian, Yiran Li, K. Ma
|
2021
|
View Paper |
Survey of Immersive Analytics
|
A. Fonnet, Yannick Prié
|
2021
|
View Paper |
Towards Understanding How Readers Integrate Charts and Captions: A Case Study with Line Charts
|
Dae Hyun Kim, V. Setlur, Maneesh Agrawala
|
2021
|
View Paper |
Sanguine: Visual analysis for patient blood management
|
Haihan Lin, R. Metcalf, Jack Wilburn, A. Lex
|
2020
|
View Paper |
Touch and Beyond: Comparing Physical and Virtual Reality Visualizations
|
K. Danyluk, T. Ulusoy, Wei Wei, Wesley Willett
|
2020
|
View Paper |
VisConnect: Distributed Event Synchronization for Collaborative Visualization
|
Michail Schwab, David Saffo, Yixuan Zhang, Shash Sinha, C. Nita-Rotaru, J. Tompkin, Cody Dunne, M. Borkin
|
2020
|
View Paper |
Data Visualization Practitioners’ Perspectives on Chartjunk
|
Paul C. Parsons, P. Shukla
|
2020
|
View Paper |
ChartSeer: Interactive Steering Exploratory Visual Analysis With Machine Intelligence
|
Jian Zhao, Mingming Fan, Mi Feng
|
2020
|
View Paper |
Analyzing gaze behavior for text-embellished narrative visualizations under different task scenarios
|
Chris Bryan, Aditi Mishra, Hidekazu Shidara, K. Ma
|
2020
|
View Paper |
A Visual Analytics Approach to Facilitate Crime Hotspot Analysis
|
J. Q. Neto, E. Santos, C. Vidal, D. Ebert
|
2020
|
View Paper |
Canis: A High‐Level Language for Data‐Driven Chart Animations
|
Tong Ge, Yue Zhao, Bongshin Lee, Donghao Ren, Baoquan Chen, Yunhai Wang
|
2020
|
View Paper |
Automatic Annotation Synchronizing with Textual Description for Visualization
|
Chufan Lai, Zhixian Lin, Ruike Jiang, Yun Han, Can Liu, Xiaoru Yuan
|
2020
|
View Paper |
From Data to Insights: A Layered Storytelling Approach for Multimodal Learning Analytics
|
Roberto Martínez Maldonado, Vanessa Echeverría, G. Fernandez-Nieto, S. B. Shum
|
2020
|
View Paper |
Giving Guidance to Graphs: Evaluating Annotations of Data Visualizations for the News
|
R. Chun
|
2020
|
View Paper |
VisuaLint: Sketchy In Situ Annotations of Chart Construction Errors
|
Aspen K. Hopkins, M. Correll, Arvind Satyanarayan
|
2020
|
View Paper |
PixelClipper: Supporting Public Engagement and Conversation About Visualizations
|
Jagoda Walny, Sarah Storteboom, R. Pusch, Steven Munsu Hwang, S. Knudsen, Sheelagh Carpendale, Wesley Willett
|
2020
|
View Paper |
Cheat Sheets for Data Visualization Techniques
|
Zezhong Wang, Lovisa Sundin, Dave Murray-Rust, Benjamin Bach
|
2020
|
View Paper |
ggplot2
|
R. Irizarry
|
2019
|
View Paper |
Inking Your Insights: Investigating Digital Externalization Behaviors During Data Analysis
|
Yea-Seul Kim, N. Riche, Bongshin Lee, M. Brehmer, M. Pahud, K. Hinckley, J. Hullman
|
2019
|
View Paper |
Thumbnails for Data Stories: A Survey of Current Practices
|
Hwiyeon Kim, J. Oh, Yunha Han, Sungahn Ko, M. Brehmer, Bum Chul Kwon
|
2019
|
View Paper |
InsideInsights: Integrating Data‐Driven Reporting in Collaborative Visual Analytics
|
Andreas Mathisen, Tom Horak, C. Klokmose, Kaj Grønbæk, N. Elmqvist
|
2019
|
View Paper |
Linking and Layout: Exploring the Integration of Text and Visualization in Storytelling
|
Qiyu Zhi, Alvitta Ottley, Ronald A. Metoyer
|
2019
|
View Paper |
Comparing Effectiveness and Engagement of Data Comics and Infographics
|
Zezhong Wang, Shun-Ho Wang, Matteo Farinella, Dave Murray-Rust, N. Riche, Benjamin Bach
|
2019
|
View Paper |
A Lie Reveals the Truth: Quasimodes for Task-Aligned Data Presentation
|
Jacob Ritchie, Daniel J. Wigdor, Fanny Chevalier
|
2019
|
View Paper |
Trust and Recall of Information across Varying Degrees of Title-Visualization Misalignment
|
H. Kong, Zhicheng Liu, Karrie Karahalios
|
2019
|
View Paper |
DataToon: Drawing Dynamic Network Comics With Pen + Touch Interaction
|
N. Kim, N. Riche, Benjamin Bach, Guanpeng Xu, M. Brehmer, K. Hinckley, M. Pahud, Haijun Xia, Michael J. McGuffin, H. Pfister
|
2019
|
View Paper |
ActiveInk: (Th)Inking with Data
|
Hugo Romat, N. Riche, K. Hinckley, Bongshin Lee, Caroline Appert, Emmanuel Pietriga, Christopher Collins
|
2019
|
View Paper |
Understanding Visual Cues in Visualizations Accompanied by Audio Narrations
|
H. Kong, Wenjie Zhu, Zhicheng Liu, Karrie Karahalios
|
2019
|
View Paper |
KnowledgePearls: Provenance-Based Visualization Retrieval
|
Holger Stitz, S. Gratzl, H. Piringer, T. Zichner, M. Streit
|
2019
|
View Paper |
Where's My Data? Evaluating Visualizations with Missing Data
|
Hayeong Song, D. Szafir
|
2019
|
View Paper |
Visualizing Uncertain Tropical Cyclone Predictions using Representative Samples from Ensembles of Forecast Tracks
|
Le Liu, Lace M. K. Padilla, Sarah H. Creem-Regehr, D. House
|
2019
|
View Paper |
Narvis: Authoring Narrative Slideshows for Introducing Data Visualization Designs
|
Qianwen Wang, Z. Li, Siwei Fu, Weiwei Cui, Huamin Qu
|
2019
|
View Paper |
SmartCues: A Multitouch Query Approach for Details-on-Demand through Dynamically Computed Overlays
|
Hariharan Subramonyam, Eytan Adar
|
2019
|
View Paper |
Timeline Storyteller: The Design & Deployment of an Interactive Authoring Tool for Expressive Timeline Narratives
|
M. Brehmer, Bongshin Lee, N. Riche, D. Tittsworth, Kate Lytvynets, D. Edge, Christopher M. White
|
2018
|
View Paper |
Concise provenance of interactive network analysis
|
Takanori Fujiwara, Tarik Crnovrsanin, K. Ma
|
2018
|
View Paper |
A Visual Analytics Framework for Identifying Topic Drivers in Media Events
|
Yafeng Lu, Hong Wang, Steven T. Landis, Ross Maciejewski
|
2018
|
View Paper |
Chart Constellations: Effective Chart Summarization for Collaborative and Multi‐User Analyses
|
Shenyu Xu, Chris Bryan, J. Li, Jian Zhao, K. Ma
|
2018
|
View Paper |
Frames and Slants in Titles of Visualizations on Controversial Topics
|
H. Kong, Zhicheng Liu, Karrie Karahalios
|
2018
|
View Paper |
Rethinking Engagement with Online News through Social and Visual Co-Annotation
|
Gavin Wood, Kiel S. Long, Tom Feltwell, Scarlett Rowland, Phillip Brooker, Jamie Mahoney, John Vines, J. Barnett, S. Lawson
|
2018
|
View Paper |
DataInk: Direct and Creative Data-Oriented Drawing
|
Haijun Xia, N. Riche, Fanny Chevalier, B. Araújo, Daniel J. Wigdor
|
2018
|
View Paper |
Design Patterns for Data Comics
|
Benjamin Bach, Zezhong Wang, Matteo Farinella, Dave Murray-Rust, N. Riche
|
2018
|
View Paper |
Google Data Studio
|
Genifer Snipes
|
2018
|
View Paper |
Visualizing Dataflow Graphs of Deep Learning Models in TensorFlow
|
Kanit Wongsuphasawat, D. Smilkov, James Wexler, Jimbo Wilson, Dandelion Mané, Doug Fritz, Dilip Krishnan, F. Viégas, M. Wattenberg
|
2018
|
View Paper |
Uncertainty Visualization by Representative Sampling from Prediction Ensembles
|
Le Liu, Alexander P. Boone, Ian T. Ruginski, Lace M. K. Padilla, M. Hegarty, Sarah H. Creem-Regehr, W. Thompson, Cem Yuksel, D. House
|
2017
|
View Paper |
ClickPoints: an expandable toolbox for scientific image annotation and analysis
|
Richard C. Gerum, S. Richter, B. Fabry, D. Zitterbart
|
2017
|
View Paper |
Internal and External Visual Cue Preferences for Visualizations in Presentations
|
H. Kong, Zhicheng Liu, Karrie Karahalios
|
2017
|
View Paper |
Voyager 2: Augmenting Visual Analysis with Partial View Specifications
|
Kanit Wongsuphasawat, Zening Qu, Dominik Moritz, Riley Chang, Felix Ouk, Anushka Anand, J. Mackinlay, Bill Howe, Jeffrey Heer
|
2017
|
View Paper |
ChartAccent: Annotation for data-driven storytelling
|
Donghao Ren, M. Brehmer, Bongshin Lee, Tobias Höllerer, E. Choe
|
2017
|
View Paper |
The Connected Scatterplot for Presenting Paired Time Series
|
Steve Haroz, Robert Kosara, S. Franconeri
|
2016
|
View Paper |
Visual Debugging Techniques for Reactive Data Visualization
|
J. Hoffswell, Arvind Satyanarayan, Jeffrey Heer
|
2016
|
View Paper |
Telling Stories about Dynamic Networks with Graph Comics
|
Benjamin Bach, Natalie Kerracher, K. Hall, M. Carpendale, J. Kennedy, N. Riche
|
2016
|
View Paper |
From Visual Exploration to Storytelling and Back Again
|
S. Gratzl, A. Lex, Nils Gehlenborg, Nicola Cosgrove, M. Streit
|
2016
|
View Paper |
Emerging and Recurring Data-Driven Storytelling Techniques: Analysis of a Curated Collection of Recent Stories
|
Charles D. Stolper, Bongshin Lee, N. Riche, J. Stasko
|
2016
|
View Paper |
Beyond Memorability: Visualization Recognition and Recall
|
M. Borkin, Z. Bylinskii, N. Kim, C. Bainbridge, Chelsea S. Yeh, Daniel Borkin, H. Pfister, A. Oliva
|
2016
|
View Paper |
TimeLineCurator: Interactive Authoring of Visual Timelines from Unstructured Text
|
Johanna Fulda, M. Brehmer, T. Munzner
|
2016
|
View Paper |
Guidelines for Effective Usage of Text Highlighting Techniques
|
Hendrik Strobelt, Daniela Oelke, Bum Chul Kwon, Tobias Schreck, H. Pfister
|
2016
|
View Paper |
More Than Telling a Story: Transforming Data into Visually Shared Stories
|
Bongshin Lee, N. Riche, Petra Isenberg, Sheelagh Carpendale
|
2015
|
View Paper |
VisDock: A Toolkit for Cross-Cutting Interactions in Visualization
|
Jungu Choi, Deok Gun Park, Yuet Ling Wong, Eli Raymond Fisher, N. Elmqvist
|
2015
|
View Paper |
Characterizing Visualization Insights from Quantified Selfers' Personal Data Presentations
|
E. Choe, Bongshin Lee, M. Schraefel
|
2015
|
View Paper |
Exploring Interactions with Physically Dynamic Bar Charts
|
Faisal Taher, John Hardy, Abhijit Karnik, Christian Weichel, Yvonne Jansen, Kasper Hornbæk, Jason Alexander
|
2015
|
View Paper |
Storytelling in Information Visualizations: Does it Engage Users to Explore Data?
|
Jeremy Boy, F. Détienne, Jean-Daniel Fekete
|
2015
|
View Paper |
SketchInsight: Natural data exploration on interactive whiteboards leveraging pen and touch interaction
|
Bongshin Lee, Greg Smith, N. Riche, Amy K. Karlson, Sheelagh Carpendale
|
2015
|
View Paper |
Exploratory sequential data analysis for multi-agent occupancy simulation results
|
Simon Breslav, Rhys Goldstein, Azam Khan, Kasper Hornbæk
|
2015
|
View Paper |
Storyboarding for visual analytics
|
Rick Walker, L. A. Cenydd, S. Pop, Helen C. Miles, Chris J. Hughes, W. Teahan, Jonathan C. Roberts
|
2015
|
View Paper |
PanoramicData: Data Analysis through Pen & Touch
|
Emanuel Zgraggen, R. Zeleznik, S. Drucker
|
2014
|
View Paper |
Supporting Communication and Coordination in Collaborative Sensemaking
|
Narges Mahyar, Melanie Tory
|
2014
|
View Paper |
AnnotatedTimeTree: Visualization and annotation of news text and other heterogeneous document collections
|
Jing Xia, Jieqiong Zhao, Isaac Sheeley, J. Christopher, Qiaoying Wang, Chen Guo, Jiawei Zhang, D. Ebert, Victor Y. Chen, Cheryl Z. Qian
|
2014
|
View Paper |
An Annotation Process for Data Visualization Techniques
|
Geraldo Franciscani, Rodrygo L. T. Santos, Raphael Ottoni, João Paulo Pesce, Wagner Meira Jr, R. Melo-Minardi
|
2014
|
View Paper |
Lyra: An Interactive Visualization Design Environment
|
Arvind Satyanarayan, Jeffrey Heer
|
2014
|
View Paper |
Authoring Narrative Visualizations with Ellipsis
|
Arvind Satyanarayan, Jeffrey Heer
|
2014
|
View Paper |
Microsoft COCO: Common Objects in Context
|
Tsung-Yi Lin, M. Maire, Serge J. Belongie, James Hays, P. Perona, Deva Ramanan, Piotr Dollár, C. L. Zitnick
|
2014
|
View Paper |
NewsViews: an automated pipeline for creating custom geovisualizations for news
|
Tong Gao, J. Hullman, Eytan Adar, Brent J. Hecht, N. Diakopoulos
|
2014
|
View Paper |
Sample-oriented task-driven visualizations: allowing users to make better, more confident decisions
|
Nivan Ferreira, Danyel Fisher, A. König
|
2014
|
View Paper |
Characterizing the intelligence analysis process through a longitudinal field study: Implications for visual analytics
|
Youn ah Kang, J. Stasko
|
2014
|
View Paper |
A Multi-Level Typology of Abstract Visualization Tasks
|
M. Brehmer, T. Munzner
|
2013
|
View Paper |
A Deeper Understanding of Sequence in Narrative Visualization
|
J. Hullman, S. Drucker, N. Riche, Bongshin Lee, Danyel Fisher, Eytan Adar
|
2013
|
View Paper |
SketchStory: Telling More Engaging Stories with Data through Freeform Sketching
|
Bongshin Lee, Rubaiat Habib Kazi, Greg Smith
|
2013
|
View Paper |
Too Much to Know: Managing Scholarly Information Before the Modern Age
|
Jill Kraye
|
2013
|
View Paper |
Storytelling: The Next Step for Visualization
|
Robert Kosara, J. Mackinlay
|
2013
|
View Paper |
Contextifier: automatic generation of annotated stock visualizations
|
J. Hullman, N. Diakopoulos, Eytan Adar
|
2013
|
View Paper |
Facilitating Discourse Analysis with Interactive Visualization
|
Jian Zhao, Fanny Chevalier, C. Collins, Ravin Balakrishnan
|
2012
|
View Paper |
Graphical Overlays: Using Layered Elements to Aid Chart Reading
|
Nicholas Kong, Maneesh Agrawala
|
2012
|
View Paper |
Sketchy Rendering for Information Visualization
|
J. Wood, Petra Isenberg, Tobias Isenberg, J. Dykes, N. Boukhelifa, A. Slingsby
|
2012
|
View Paper |
Assessing the Effect of Visualizations on Bayesian Reasoning through Crowdsourcing
|
L. Micallef, Pierre Dragicevic, Jean-Daniel Fekete
|
2012
|
View Paper |
Just-in-time annotation of clusters, outliers, and trends in point-based data visualizations
|
Eser Kandogan
|
2012
|
View Paper |
Amanda Cox
|
J. Champkin
|
2012
|
View Paper |
Investigating the Effectiveness of an Efficient Label Placement Method Using Eye Movement Data
|
Kristien Ooms, P. Maeyer, V. Fack, E. V. Assche, F. Witlox
|
2012
|
View Paper |
Note-taking in co-located collaborative visual analytics: Analysis of an observational study
|
Narges Mahyar, Ali Sarvghad, Melanie Tory
|
2012
|
View Paper |
Semantic interaction for visual text analytics
|
A. Endert, Patrick Fiaux, Chris North
|
2012
|
View Paper |
Interactive dynamics for visual analysis
|
Jeffrey Heer, B. Shneiderman
|
2012
|
View Paper |
Supporting effective common ground construction in Asynchronous Collaborative Visual Analytics
|
Yang Chen, J. Alsakran, S. Barlowe, Jing Yang, Ye Zhao
|
2011
|
View Paper |
Visualization Rhetoric: Framing Effects in Narrative Visualization
|
J. Hullman, N. Diakopoulos
|
2011
|
View Paper |
Collaborative visualization: Definition, challenges, and research agenda
|
Petra Isenberg, N. Elmqvist, J. Scholtz, D. Cernea, K. Ma, H. Hagen
|
2011
|
View Paper |
KronoMiner: using multi-foci navigation for the visual exploration of time-series data
|
Jian Zhao, Fanny Chevalier, Ravin Balakrishnan
|
2011
|
View Paper |
CommentSpace: structured support for collaborative visual analysis
|
Wesley Willett, Jeffrey Heer, J. Hellerstein, Maneesh Agrawala
|
2011
|
View Paper |
Click2Annotate: Automated Insight Externalization with rich semantics
|
Yang Chen, S. Barlowe, Jing Yang
|
2010
|
View Paper |
Narrative Visualization: Telling Stories with Data
|
E. Segel, Jeffrey Heer
|
2010
|
View Paper |
Matching Visual Saliency to Confidence in Plots of Uncertain Data
|
David Feng, L. Kwock, Yueh Lee, Russell M. Taylor
|
2010
|
View Paper |
Useful junk?: the effects of visual embellishment on comprehension and memorability of charts
|
Scott Bateman, R. Mandryk, C. Gutwin, Aaron Genest, D. McDine, Christopher A. Brooks
|
2010
|
View Paper |
Touch2Annotate: generating better annotations with less human effort on multi-touch interfaces
|
Yang Chen, Jing Yang, S. Barlowe, D. Jeong
|
2010
|
View Paper |
Connecting the dots in visual analysis
|
Y. Shrinivasan, D. Gotz, Jie Lu
|
2009
|
View Paper |
Capturing and supporting the analysis process
|
Nazanin Kadivar, Victor Y. Chen, D. Dunsmuir, Eric Lee, Cheryl Z. Qian, J. Dill, C. Shaw, R. Woodbury
|
2009
|
View Paper |
Matplotlib for Python Developers
|
S. Tosi
|
2009
|
View Paper |
Protovis: A Graphical Toolkit for Visualization
|
M. Bostock, Jeffrey Heer
|
2009
|
View Paper |
The Benefits of Synchronous Collaborative Information Visualization: Evidence from an Experimental Evaluation
|
Sabrina Bresciani, Martin J. Eppler
|
2009
|
View Paper |
Perceptual interpretation of ink annotations on line charts
|
Nicholas Kong, Maneesh Agrawala
|
2009
|
View Paper |
ImageNet: A large-scale hierarchical image database
|
Jia Deng, Wei Dong, R. Socher, Li-Jia Li, K. Li, Li Fei-Fei
|
2009
|
View Paper |
Collaborative synthesis of visual analytic results
|
A. Robinson
|
2008
|
View Paper |
Characterizing Users' Visual Analytic Activity for Insight Provenance
|
D. Gotz, Michelle X. Zhou
|
2008
|
View Paper |
Graphical Histories for Visualization: Supporting Analysis, Communication, and Evaluation
|
Jeffrey Heer, J. Mackinlay, Chris Stolte, Maneesh Agrawala
|
2008
|
View Paper |
Supporting the analytical reasoning process in information visualization
|
Y. Shrinivasan, J. V. Wijk
|
2008
|
View Paper |
Generalized selection via interactive query relaxation
|
Jeffrey Heer, Maneesh Agrawala, Wesley Willett
|
2008
|
View Paper |
Automation and the Map Label Placement Problem: A Comparison of Two GIS Implementations of Label Placement
|
Jill Phelps Kern, Cynthia A. Brewer
|
2008
|
View Paper |
ManyEyes: a Site for Visualization at Internet Scale
|
F. Viégas, M. Wattenberg, F. V. Ham, Jesse Kriss, Matt McKeon
|
2007
|
View Paper |
DataMeadow: A Visual Canvas for Analysis of Large-Scale Multivariate Data
|
N. Elmqvist, J. Stasko, P. Tsigas
|
2007
|
View Paper |
Jigsaw: Supporting Investigative Analysis through Interactive Visualization
|
J. Stasko, C. Görg, Zhicheng Liu
|
2007
|
View Paper |
Stories in GeoTime
|
R. Eccles, T. Kapler, R. Harper, W. Wright
|
2007
|
View Paper |
Design Considerations for Collaborative Visual Analytics
|
Jeffrey Heer, Maneesh Agrawala
|
2007
|
View Paper |
Story Telling for Presentation in Volume Visualization
|
M. Wohlfart, H. Hauser
|
2007
|
View Paper |
FASTDash: a visual dashboard for fostering awareness in software teams
|
Jacob T. Biehl, M. Czerwinski, Greg Smith, G. Robertson
|
2007
|
View Paper |
Voyagers and voyeurs: supporting asynchronous collaborative information visualization
|
Jeffrey Heer, F. Viégas, M. Wattenberg
|
2007
|
View Paper |
Provenance and Annotation for Visual Exploration Systems
|
D. Groth, Kristy Streefkerk
|
2006
|
View Paper |
Technical forum: Communication-minded visualization: A call to action
|
F. Viégas, M. Wattenberg
|
2006
|
View Paper |
MatrixExplorer: a Dual-Representation System to Explore Social Networks
|
N. Riche, Jean-Daniel Fekete
|
2006
|
View Paper |
ASK-GraphView: A Large Scale Graph Visualization System
|
J. Abello, F. V. Ham, Neeraj Krishnan
|
2006
|
View Paper |
The Sandbox for analysis: concepts and methods
|
W. Wright, David Schroh, Pascale Proulx, Alexander W. Skaburskis, B. Cort
|
2006
|
View Paper |
VisTrails: enabling interactive multiple-view visualizations
|
Louis Bavoil, Steven P. Callahan, C. Scheidegger, H. Vo, Patricia J. Crossno, Cláudio T. Silva, J. Freire
|
2005
|
View Paper |
Low-level components of analytic activity in information visualization
|
R. Amar, James R. Eagan, J. Stasko
|
2005
|
View Paper |
Software support for annotation of visualized data using hand-drawn marks
|
I. Denisovich
|
2005
|
View Paper |
The Proposition Bank: An Annotated Corpus of Semantic Roles
|
Martha Palmer, Paul R. Kingsbury, D. Gildea
|
2005
|
View Paper |
A collaborative annotation system for data visualization
|
Sean E. Ellis, D. Groth
|
2004
|
View Paper |
Procedural annotation of uncertain information
|
Andrej Cedilnik, P. Rheingans
|
2000
|
View Paper |
The Organization of Information
|
Arlene G. Taylor
|
1999
|
View Paper |
An empirical study of algorithms for point-feature label placement
|
J. Christensen, J. Marks, Stuart M. Shieber
|
1995
|
View Paper |
An annotation system for 3D fluid flow visualization
|
M. Loughlin, J. Hughes
|
1994
|
View Paper |
Characterizing the sequential structure of interactive behaviors through statistical and grammatical techniques
|
Gary M. Olson, J. Herbsleb, H. Rueter
|
1994
|
View Paper |
Building a Large Annotated Corpus of English: The Penn Treebank
|
Mitchell P. Marcus, Beatrice Santorini, Mary Ann Marcinkiewicz
|
1993
|
View Paper |
Cartographic name placement with Prolog
|
Christopher B. Jones
|
1989
|
View Paper |
From Memory to Written Record: England 1066 - 1307
|
M. Clanchy
|
1981
|
View Paper |
Power BI
|
Ralph Mercurio, Brian Merrill
|
2021
|
View Paper |
“Rising inflation looks less severe using pre-pandemic comparisons,”
|
2021
|
||
Tableau Software
|
A. Veglis
|
2020
|
View Paper |
The Curious Case of Combining Text and Visualization
|
Alvitta Ottley, Aleksandra Kaszowska, R. Crouser, Evan M. Peck
|
2019
|
View Paper |
Supporting Handoff in Asynchronous Collaborative Sensemaking Using Knowledge-Transfer Graphs
|
Jian Zhao, Michael Glueck, Petra Isenberg, Fanny Chevalier, Azam Khan
|
2018
|
View Paper |
Exploring Interactive Linking Between Text and Visualization
|
Shahid Latif, Diao Liu, Fabian Beck
|
2018
|
View Paper |
Temporal Summary Images: An Approach to Narrative Visualization via Interactive Annotation Generation and Placement
|
Chris Bryan, K. Ma, J. Woodring
|
2017
|
View Paper |
Annotation Graphs: A Graph-Based Visualization for Meta-Analysis of Data Based on User-Authored Annotations
|
Jian Zhao, Michael Glueck, Simon Breslav, Fanny Chevalier, Azam Khan
|
2017
|
View Paper |
Effective java
|
2017
|
||
Data Comics: Sequential Art for Data-Driven Storytelling
|
Zhenpeng Zhao, R. Marr, N. Elmqvist
|
2015
|
View Paper |
“labella.js: Placing labels on a time-line without overlap,”
|
2015
|
||
“Seven features you’ll want in your next charting tool,”
|
2015
|
||
VisJockey : Enriching Data Stories through Orchestrated Interactive Visualization
|
Bum Chul Kwon, Florian Stoffel, Dominik Jäckle, Bongshin Lee, D. Keim
|
2014
|
View Paper |
“Driving shifts into reverse,”
|
2010
|
||
Annotation in outdoor augmented reality
|
Jason Wither, S. DiVerdi, Tobias Höllerer
|
2009
|
View Paper |
“Oil prices reach a symbolic mark,”
|
2008
|
||
Interactive Annotations on Large , High-Resolution Information Displays
|
Tobias Isenberg, Petra Neumann, Sheelagh Carpendale, Simon Nix, S. Greenberg
|
2006
|
View Paper |
The Intellectual Foundation of Information Organization
|
Elaine Svenonius
|
2000
|
View Paper |
A Systems View of Annotations
|
S. Cousins
|
2000
|
View Paper |
: A Social History of Truth: Civility and Science in Seventeenth-Century England
|
S. Cole
|
1996
|
View Paper |
“Exploring annotation strategies in professional visualizations: Insights from prominent us news portals,”
|
|||
: Studies
|
View Paper | ||
“Guidance in the human–machine
|
|||
“A qualitative evaluation and taxonomy of student annotations on bar charts,”
|
|||
University of South Florida, Bhavana completed her Master from the same institution
|
|||
the Department of Computer Science and Engineering at the University of South Florida. Prior to joining as a PhD student at the
|
|||
“d3-annotation,
|
|||
Prior to joining the University of Utah, he completed an MS in Computer Science from the University of South Florida
|
|||
“India set to overtake china as world’s most populous country,”
|
|||
“Artisanal label placement for d3 graphics,”
|
|||
“Vispubs. com: A visualization publications repository.”
|
|||
“Iron viz gallery,”
|
|||
Ghulam
|
Showing first page preview. Click "Open Full PDF" to view the complete paper.
Your comment contains inappropriate language and has been rejected.
Are you sure you want to remove this tag? This action cannot be undone.
Someone just favorited a paper!
Comments (0)