A Qualitative Analysis of Common Practices in Annotations: A Taxonomy and Design Space
Publication
Metrics
AI Quick Summary
This paper presents a qualitative analysis of common annotation practices, generating a taxonomy and design space for effective visualization annotations. The study identifies five primary annotation types and expands them through thematic coding, providing a comprehensive guide for annotating charts to enhance data communication.
Paper Preview
Abstract
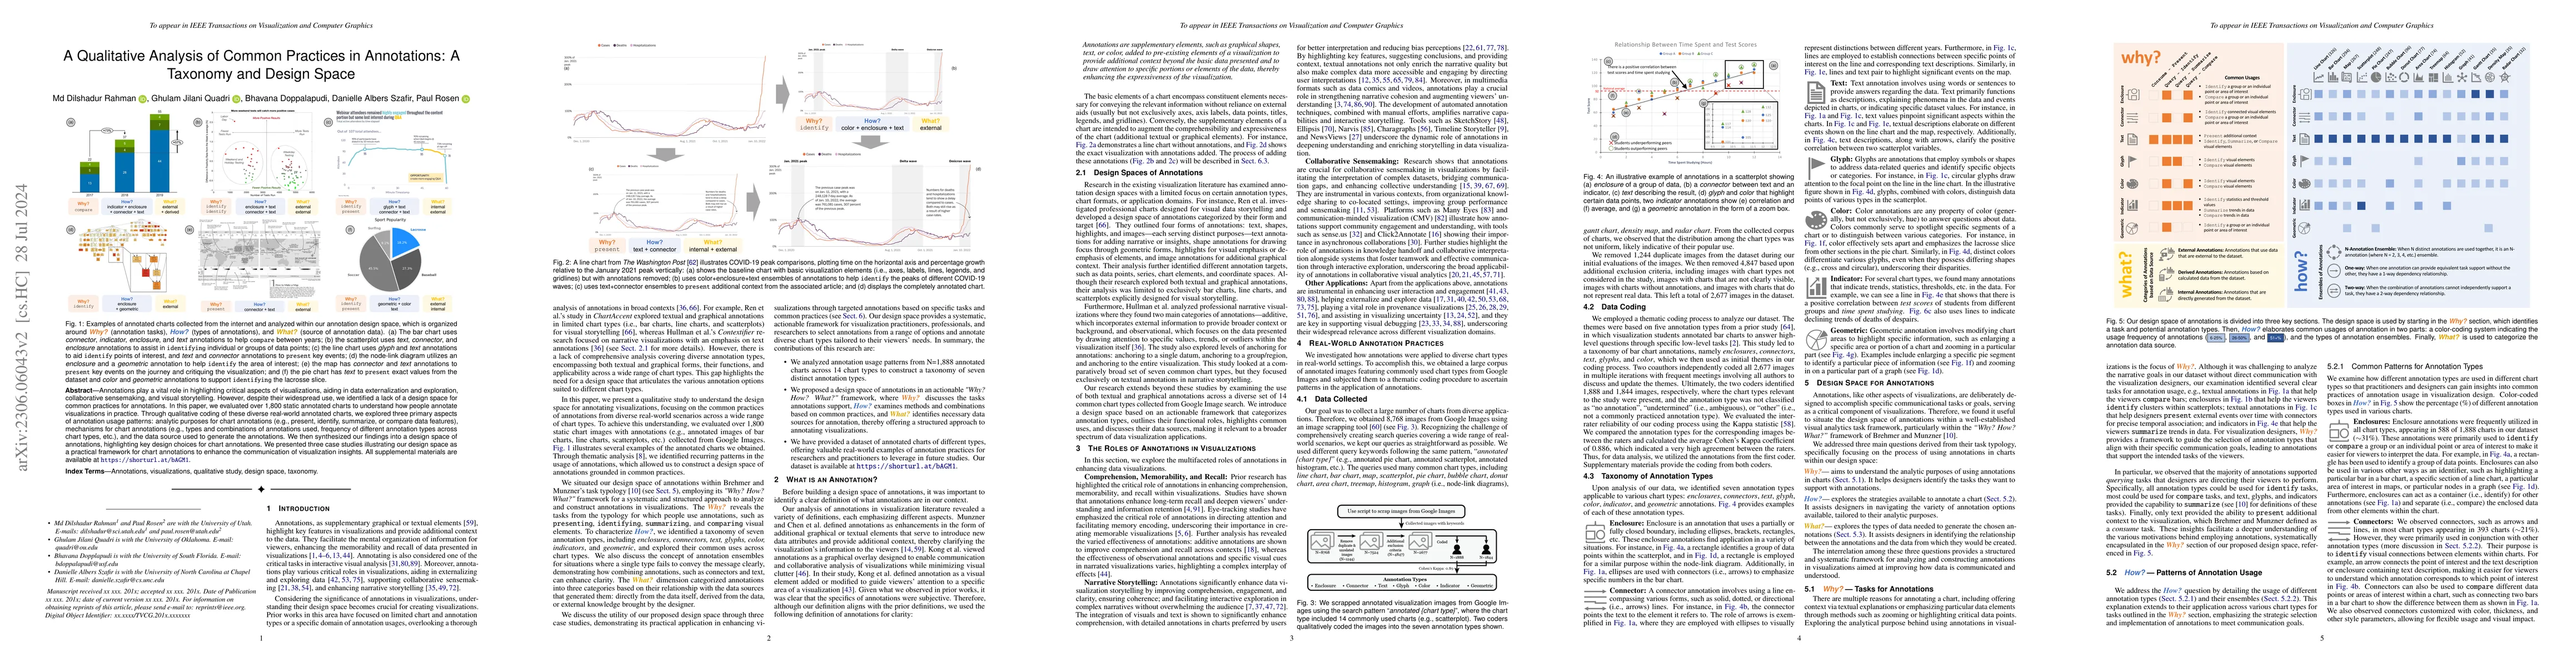
Annotations are a vital component of data externalization and collaborative analysis, directing readers' attention to important visual elements. Therefore, it is crucial to understand their design space for effectively annotating visualizations. However, despite their widespread use in visualization, we have identified a lack of a design space for common practices for annotations. In this paper, we present two studies that explore how people annotate visualizations to support effective communication. In the first study, we evaluate how visualization students annotate bar charts when answering high-level questions about the data. Qualitative coding of the resulting annotations generates a taxonomy comprising enclosure, connector, text, mark, and color, revealing how people leverage different visual elements to communicate critical information. We then extend our taxonomy by performing thematic coding on a diverse range of real-world annotated charts, adding trend and geometric annotations to the taxonomy. We then combine the results of these studies into a design space of annotations that focuses on the key elements driving the design choices available when annotating a chart, providing a reference guide for using annotations to communicate insights from visualizations.
AI Key Findings
Get AI-generated insights about this paper's methodology, results, significance, and more — seven facets brought into focus.
Impact
Paper Details
Authors
PDF Preview
Key Terms
Citation Network
Current paper (gray), citations (green), references (blue)
Display is limited for performance on very large graphs.
Discussion 0