Revisiting Categorical Color Perception in Scatterplots: Sequential, Diverging, and Categorical Palettes
Publication
Metrics
AI Quick Summary
This study investigates categorical color perception in scatterplots, comparing various color palettes' effectiveness based on hue and lightness differences. Results show that while hue-based palettes are most effective, lightness also plays a crucial role in optimal categorical encoding.
Paper Preview
Abstract
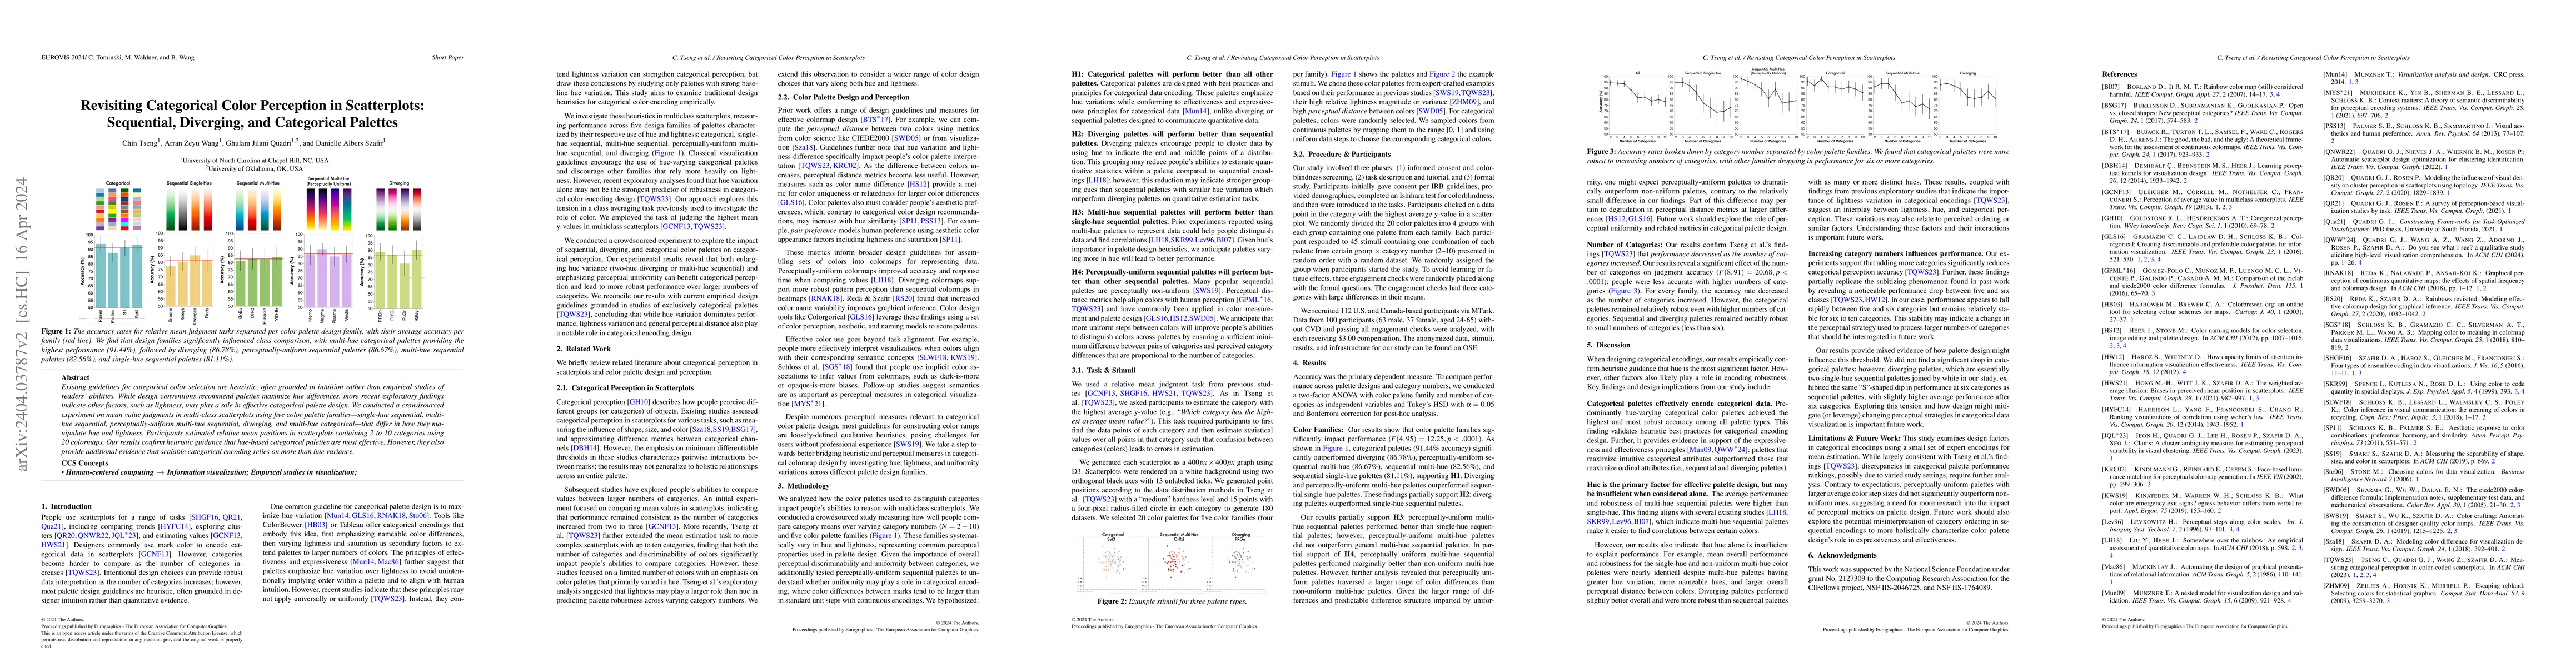
Existing guidelines for categorical color selection are heuristic, often grounded in intuition rather than empirical studies of readers' abilities. While design conventions recommend palettes maximize hue differences, more recent exploratory findings indicate other factors, such as lightness, may play a role in effective categorical palette design. We conducted a crowdsourced experiment on mean value judgments in multi-class scatterplots using five color palette families--single-hue sequential, multi-hue sequential, perceptually-uniform multi-hue sequential, diverging, and multi-hue categorical--that differ in how they manipulate hue and lightness. Participants estimated relative mean positions in scatterplots containing 2 to 10 categories using 20 colormaps. Our results confirm heuristic guidance that hue-based categorical palettes are most effective. However, they also provide additional evidence that scalable categorical encoding relies on more than hue variance.
AI Key Findings
Get AI-generated insights about this paper's methodology, results, significance, and more — seven facets brought into focus.
Impact
Paper Details
Authors
PDF Preview
Key Terms
Citation Network
Current paper (gray), citations (green), references (blue)
Display is limited for performance on very large graphs.
Discussion 0