This paper explores how well people can visually match sample data distributions with normal curves, finding that while they can estimate the mean accurately, they often overestimate the standard deviation, leading to the "umbrella effect." Strip plots were found to yield the best accuracy in fitting normal curves to data.
Idealized probability distributions, such as normal or other curves, lie at the root of confirmatory statistical tests. But how well do people understand these idealized curves? In practical terms, does the human visual system allow us to match sample data distributions with hypothesized population distributions from which those samples might have been drawn? And how do different visualization techniques impact this capability? This paper shares the results of a crowdsourced experiment that tested the ability of respondents to fit normal curves to four different data distribution visualizations: bar histograms, dotplot histograms, strip plots, and boxplots. We find that the crowd can estimate the center (mean) of a distribution with some success and little bias. We also find that people generally overestimate the standard deviation, which we dub the "umbrella effect" because people tend to want to cover the whole distribution using the curve, as if sheltering it from the heavens above, and that strip plots yield the best accuracy.
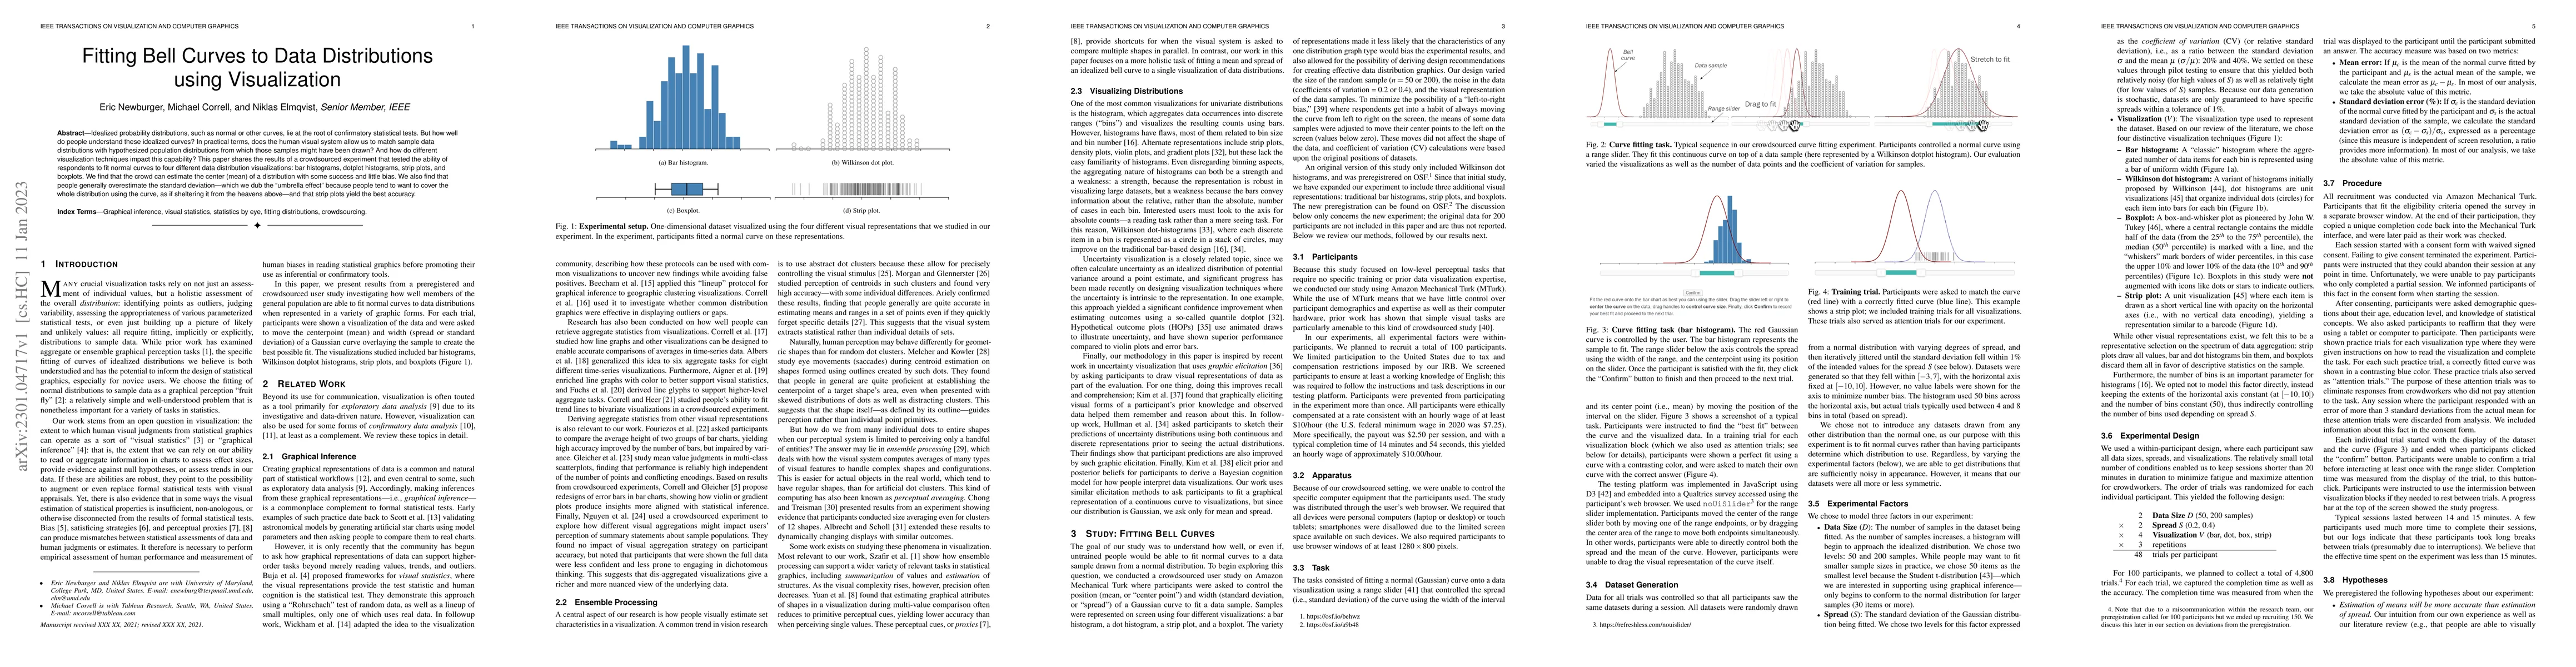
Generated Sep 05, 2025
A mixed-methods approach combining both quantitative and qualitative data was used to investigate the effects of visualization on user performance.
This research highlights the importance of considering user needs and context when designing visualizations, and demonstrates the potential benefits of using visualization to improve performance and decision-making.
The development of a novel algorithm for automatically generating optimal visualization layouts based on user performance data.
This research introduces a new framework for evaluating and improving data visualization tools, which can be applied to a wide range of domains and applications.
Current paper (gray), citations (green), references (blue)
Display is limited for performance on very large graphs.
Title | Authors | Year | Actions |
---|
Comments (0)