Drillboards: Adaptive Visualization Dashboards for Dynamic Personalization of Visualization Experiences
Publication
Metrics
AI Quick Summary
The paper introduces "drillboards," adaptive visualization dashboards that allow users to customize the level of detail in a hierarchy of coordinated charts based on their expertise and interest. An authoring tool facilitates the creation of these personalized dashboards, which were successfully evaluated by domain experts and received favorable feedback from casual users.
Paper Preview
Abstract
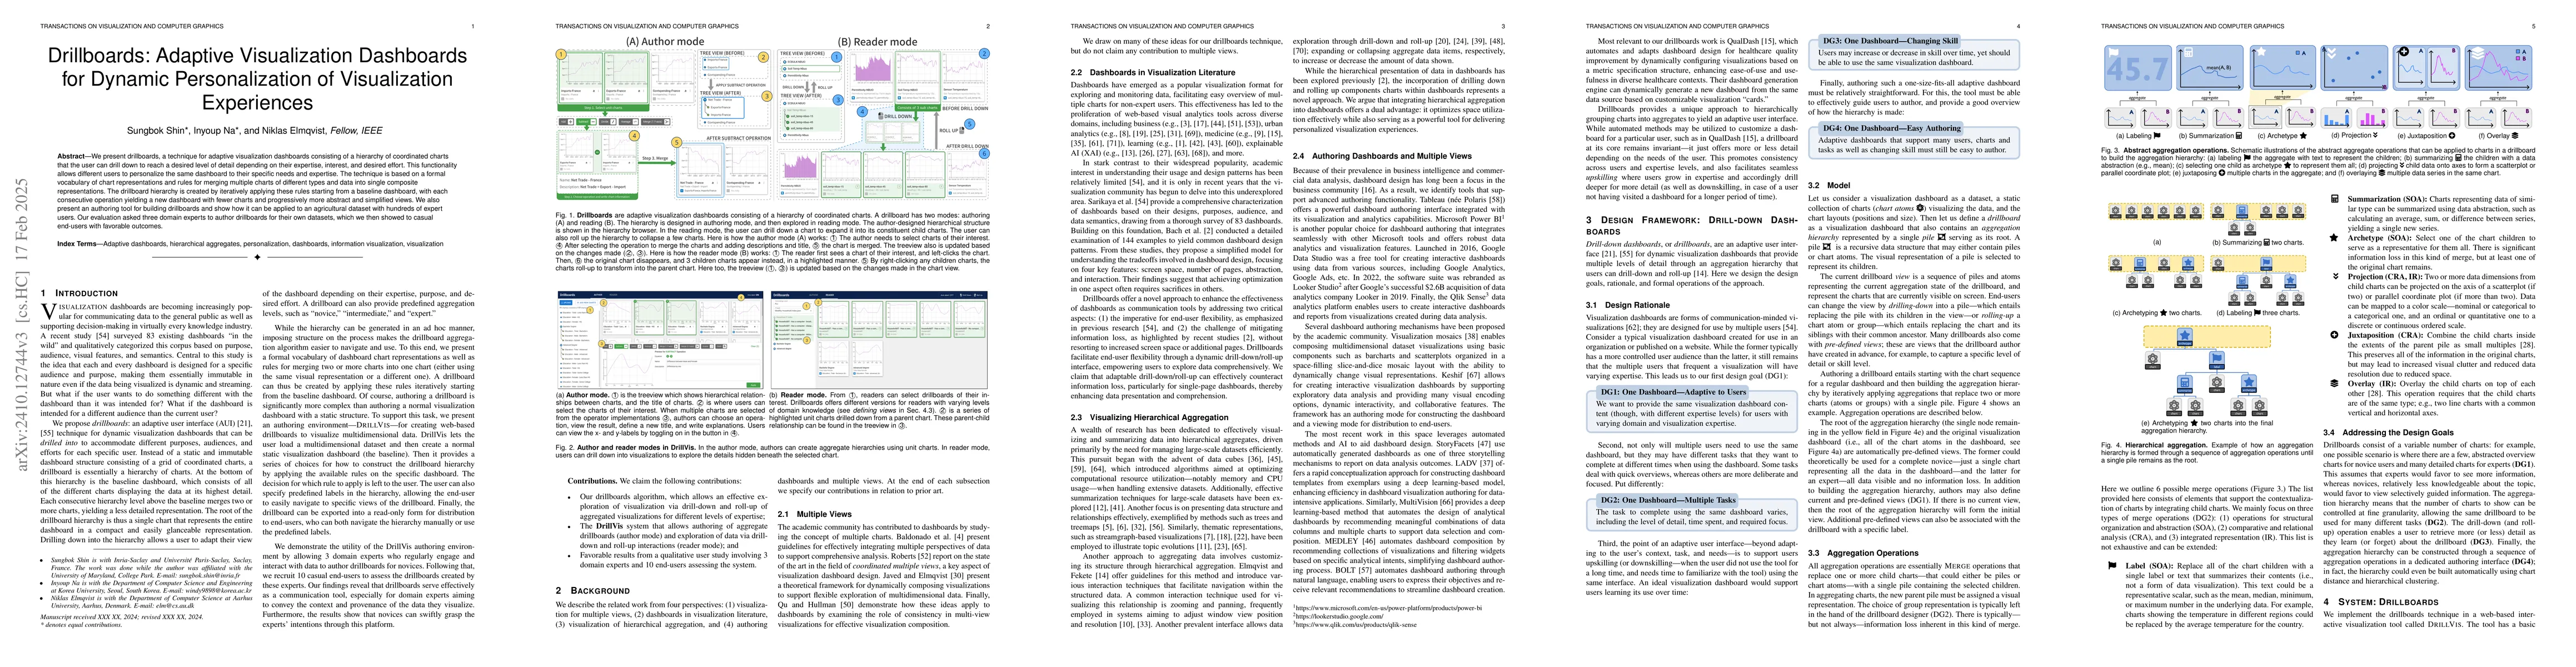
We present drillboards, a technique for adaptive visualization dashboards consisting of a hierarchy of coordinated charts that the user can drill down to reach a desired level of detail depending on their expertise, interest, and desired effort. This functionality allows different users to personalize the same dashboard to their specific needs and expertise. The technique is based on a formal vocabulary of chart representations and rules for merging multiple charts of different types and data into single composite representations. The drillboard hierarchy is created by iteratively applying these rules starting from a baseline dashboard, with each consecutive operation yielding a new dashboard with fewer charts and progressively more abstract and simplified views. We also present an authoring tool for building drillboards and show how experts users can use to build up and deliver personalized experiences to a wide audience. Our evaluation asked three domain experts to author drillboards for their own datasets, which we then showed to casual end-users with favorable outcomes.
AI Key Findings
Get AI-generated insights about this paper's methodology, results, significance, and more — seven facets brought into focus.
Impact
Paper Details
Authors
PDF Preview
Citation Network
Current paper (gray), citations (green), references (blue)
Display is limited for performance on very large graphs.
Discussion 0