Fixation and Creativity in Data Visualization Design: Experiences and Perspectives of Practitioners
Publication
Metrics
AI Quick Summary
This study explores the experiences of data visualization practitioners regarding design fixation and creativity. Interviews with 15 professionals reveal insights into fixation's nature, contributing factors, and strategies to overcome it, highlighting avenues for further research in visualization design.
Paper Preview
Abstract
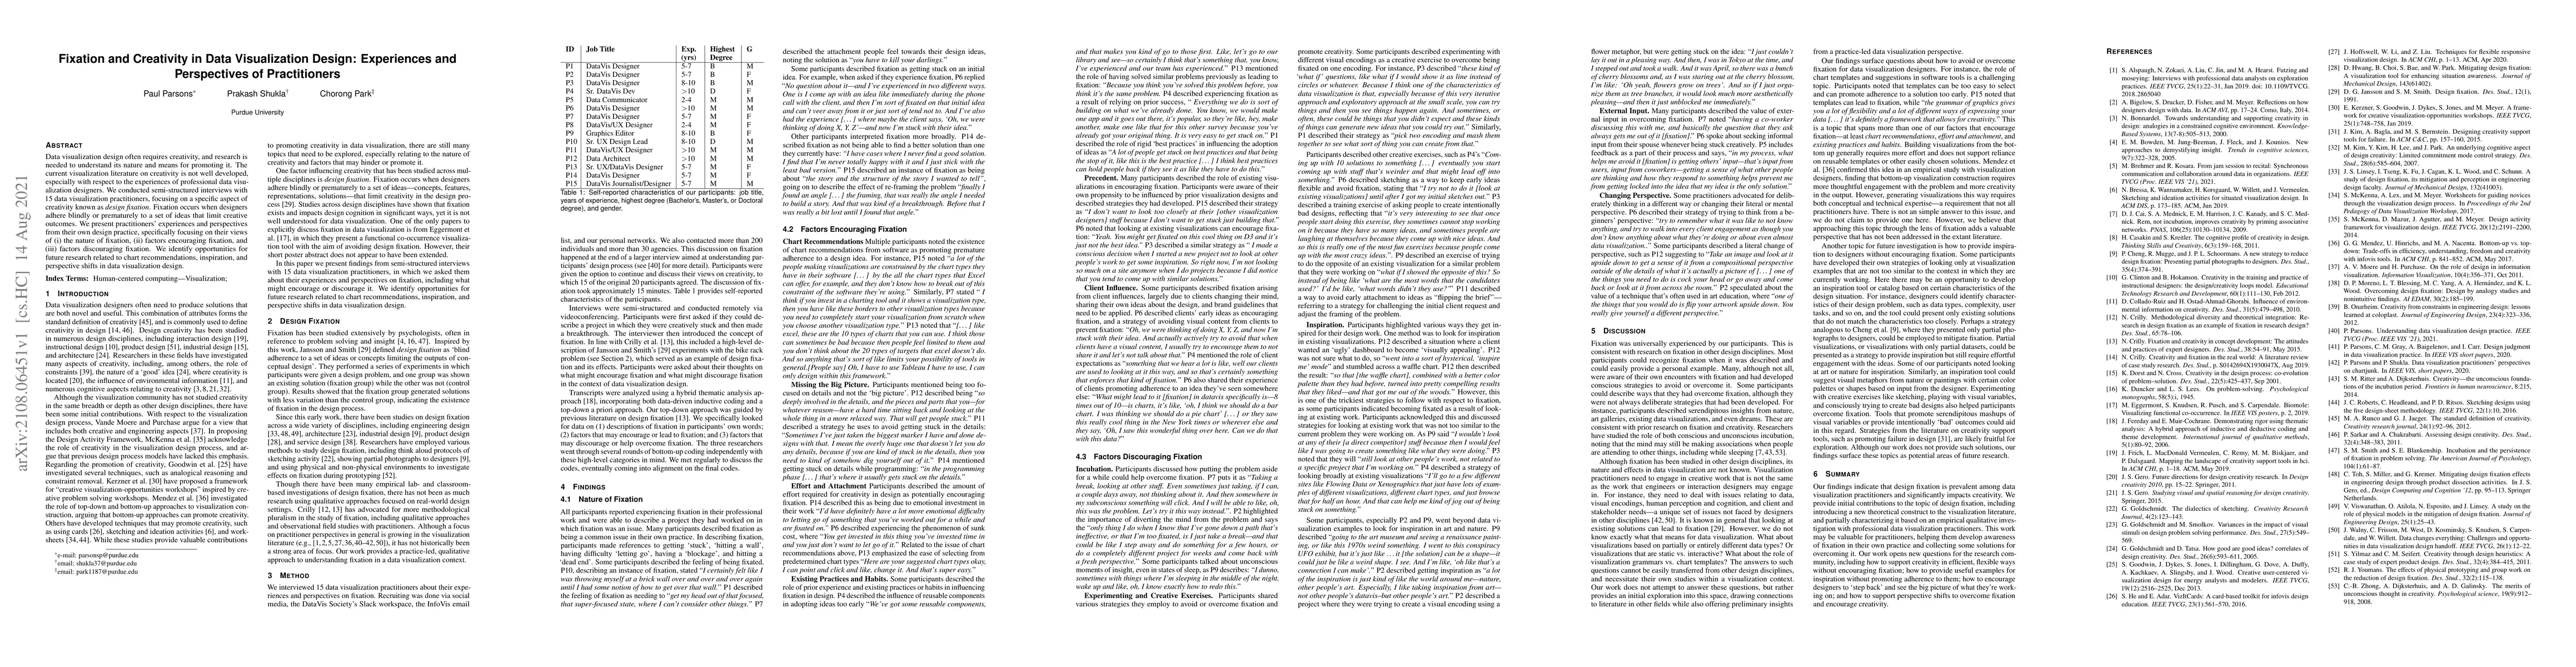
Data visualization design often requires creativity, and research is needed to understand its nature and means for promoting it. The current visualization literature on creativity is not well developed, especially with respect to the experiences of professional data visualization designers. We conducted semi-structured interviews with 15 data visualization practitioners, focusing on a specific aspect of creativity known as design fixation. Fixation occurs when designers adhere blindly or prematurely to a set of ideas that limit creative outcomes. We present practitioners' experiences and perspectives from their own design practice, specifically focusing on their views of (i) the nature of fixation, (ii) factors encouraging fixation, and (iii) factors discouraging fixation. We identify opportunities for future research related to chart recommendations, inspiration, and perspective shifts in data visualization design.
AI Key Findings
Get AI-generated insights about this paper's methodology, results, significance, and more — seven facets brought into focus.
Impact
Paper Details
Authors
PDF Preview
Key Terms
Citation Network
Current paper (gray), citations (green), references (blue)
Display is limited for performance on very large graphs.
Discussion 0