Quick Summary:

This paper explores the perspectives of data visualization practitioners on chartjunk, revealing diverse understandings and influences on their use of visual embellishments. The study emphasizes the personal and contextual factors that shape practitioners' design decisions, advocating for more practice-led research to better grasp how such concepts are interpreted and applied.

Summary

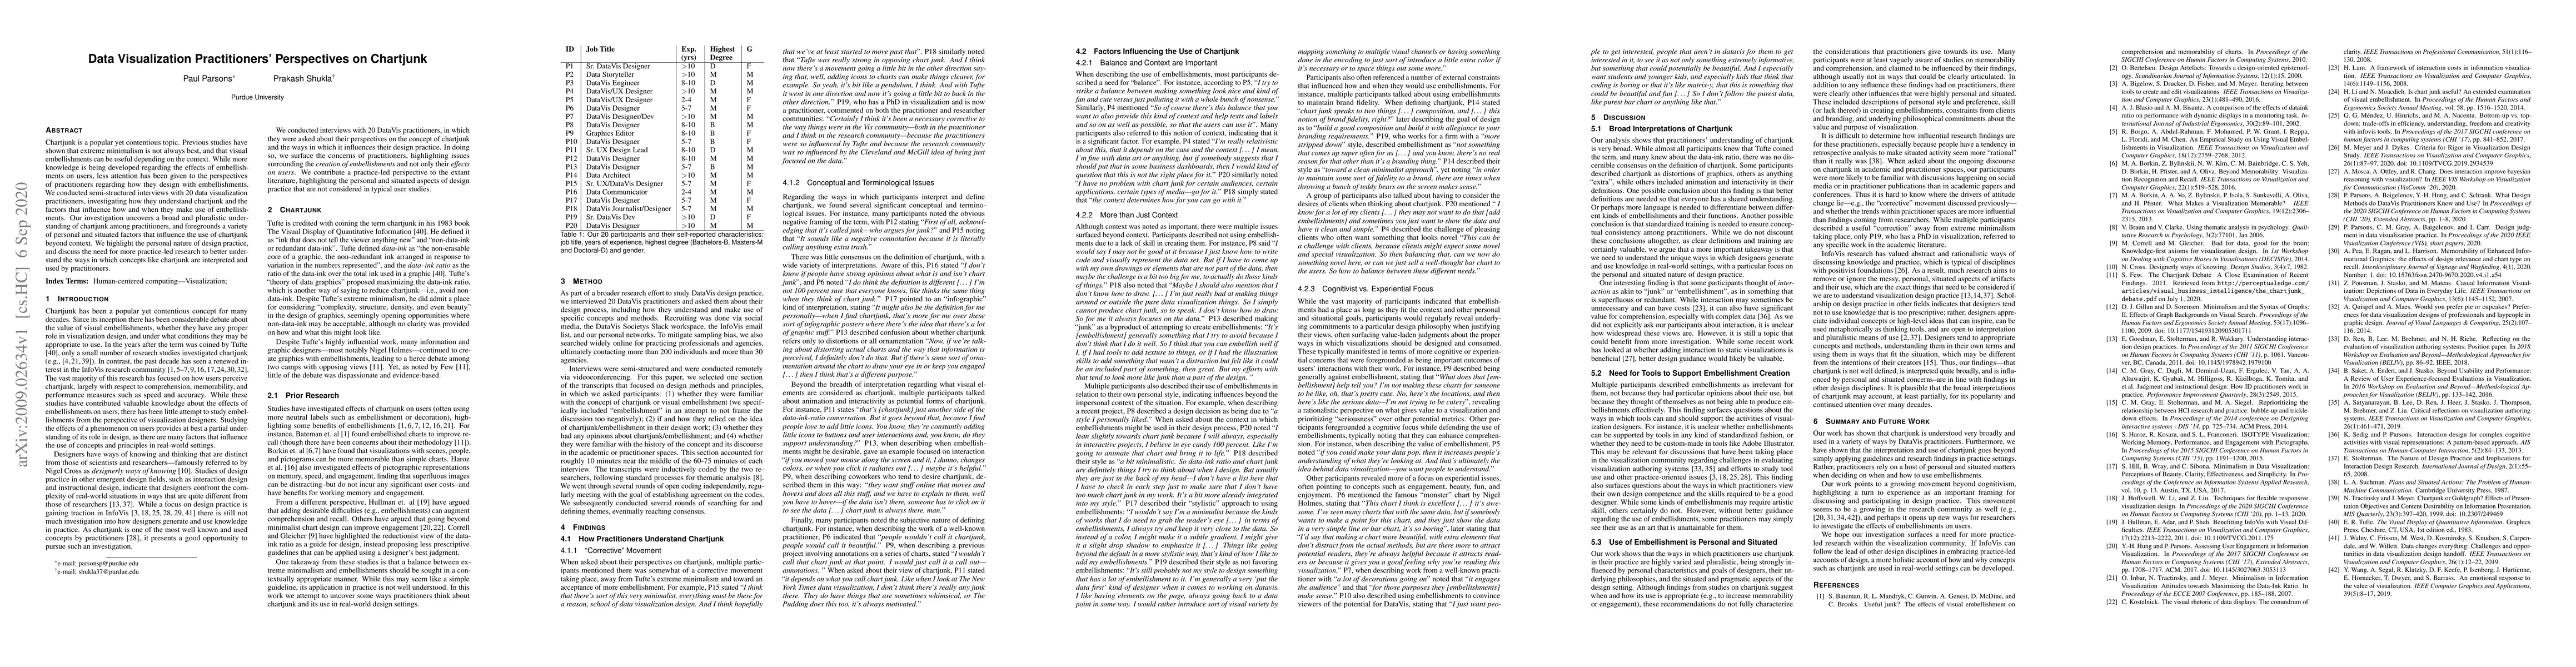
Chartjunk is a popular yet contentious topic. Previous studies have shown that extreme minimalism is not always best, and that visual embellishments can be useful depending on the context. While more knowledge is being developed regarding the effects of embellishments on users, less attention has been given to the perspectives of practitioners regarding how they design with embellishments. We conducted semi-structured interviews with 20 data visualization practitioners, investigating how they understand chartjunk and the factors that influence how and when they make use of embellishments. Our investigation uncovers a broad and pluralistic understanding of chartjunk among practitioners, and foregrounds a variety of personal and situated factors that influence the use of chartjunk beyond context. We highlight the personal nature of design practice, and discuss the need for more practice-led research to better understand the ways in which concepts like chartjunk are interpreted and used by practitioners.

AI Key Findings

Get AI-generated insights about this paper's methodology, results, and significance.

Paper Details

PDF Preview

Download PDF

Key Terms

practitioners (0.378)
regarding (0.242)
practice (0.239)
regarding (0.225)
practice (0.222)
understand (0.218)
influence (0.213)
influence (0.211)
factors (0.204)
understand (0.201)
factors (0.200)
context (0.184)
design (0.174)
visualization (0.169)
context (0.166)
make use (0.166)
perspectives (0.164)
design (0.160)
structured (0.158)
investigating (0.157)

Citation Network

Current paper (gray), citations (green), references (blue)

Current Paper
Citations
References
Click to view
Title Authors Year Actions
A Survey on Annotations in Information Visualization: Empirical Insights, Applications, and Challenges
Md Dilshadur Rahman, Bhavana Doppalapudi, Ghulam Jilani Quadri, Paul Rosen
2024
View Paper
Complexity as Design Material Position Paper
Florian Windhager, Alfie Abdul-Rahman, Mark-Jan Bludau, Nicole Hengesbach, Houda Lamqaddam, Isabel Meirelles, Bettina Speckmann, Michael Correll
2024
View Paper
“I Came Across a Junk”: Understanding Design Flaws of Data Visualization from the Public's Perspective
Xingyu Lan, Yu Liu
2024
View Paper
Discovering Accessible Data Visualizations for People with ADHD
Tien Tran, H. Lee, Ji Hwan Park
2024
View Paper
Embellishments Revisited: Perceptions of Embellished Visualisations Through the Viewer's Lens
Muna Alebri, Enrico Costanza, Georgia Panagiotidou, Duncan P. Brumby
2023
View Paper
How Good is ChatGPT in Giving Advice on Your Visualization Design?
Nam Wook Kim, Grace Myers, Benjamin Bach
2023
View Paper
Who is the Audience? Designing Casual Data Visualizations for the 'General Public'
Regina Schuster, Laura Koesten, T. Möller, Kathleen Gregory
2023
View Paper
Manifesto for Putting 'Chartjunk' in the Trash 2021!
Derya Akbaba, J. Wilburn, Main T. Nance, Miriah D. Meyer
2021
View Paper
Understanding Data Visualization Design Practice
Paul C. Parsons
2021
View Paper
Fixation and Creativity in Data Visualization Design: Experiences and Perspectives of Practitioners
Paul C. Parsons, P. Shukla, Chorong Park
2021
View Paper
Design Judgment in Data Visualization Practice
Paul C. Parsons, Colin M. Gray, Ali Baigelenov, Ian Carr
2020
View Paper

Comments (0)

This website uses cookies to ensure you get the best experience. Learn more