Perceptual Pat: A Virtual Human System for Iterative Visualization Design
Publication
Metrics
AI Quick Summary
Perceptual Pat is a virtual human system that uses AI and computer vision to iteratively refine visualizations by providing automated critiques and evaluations. The system generates reports based on various analyses and offers a web-based lab for tracking design improvements over time.
Paper Preview
Abstract
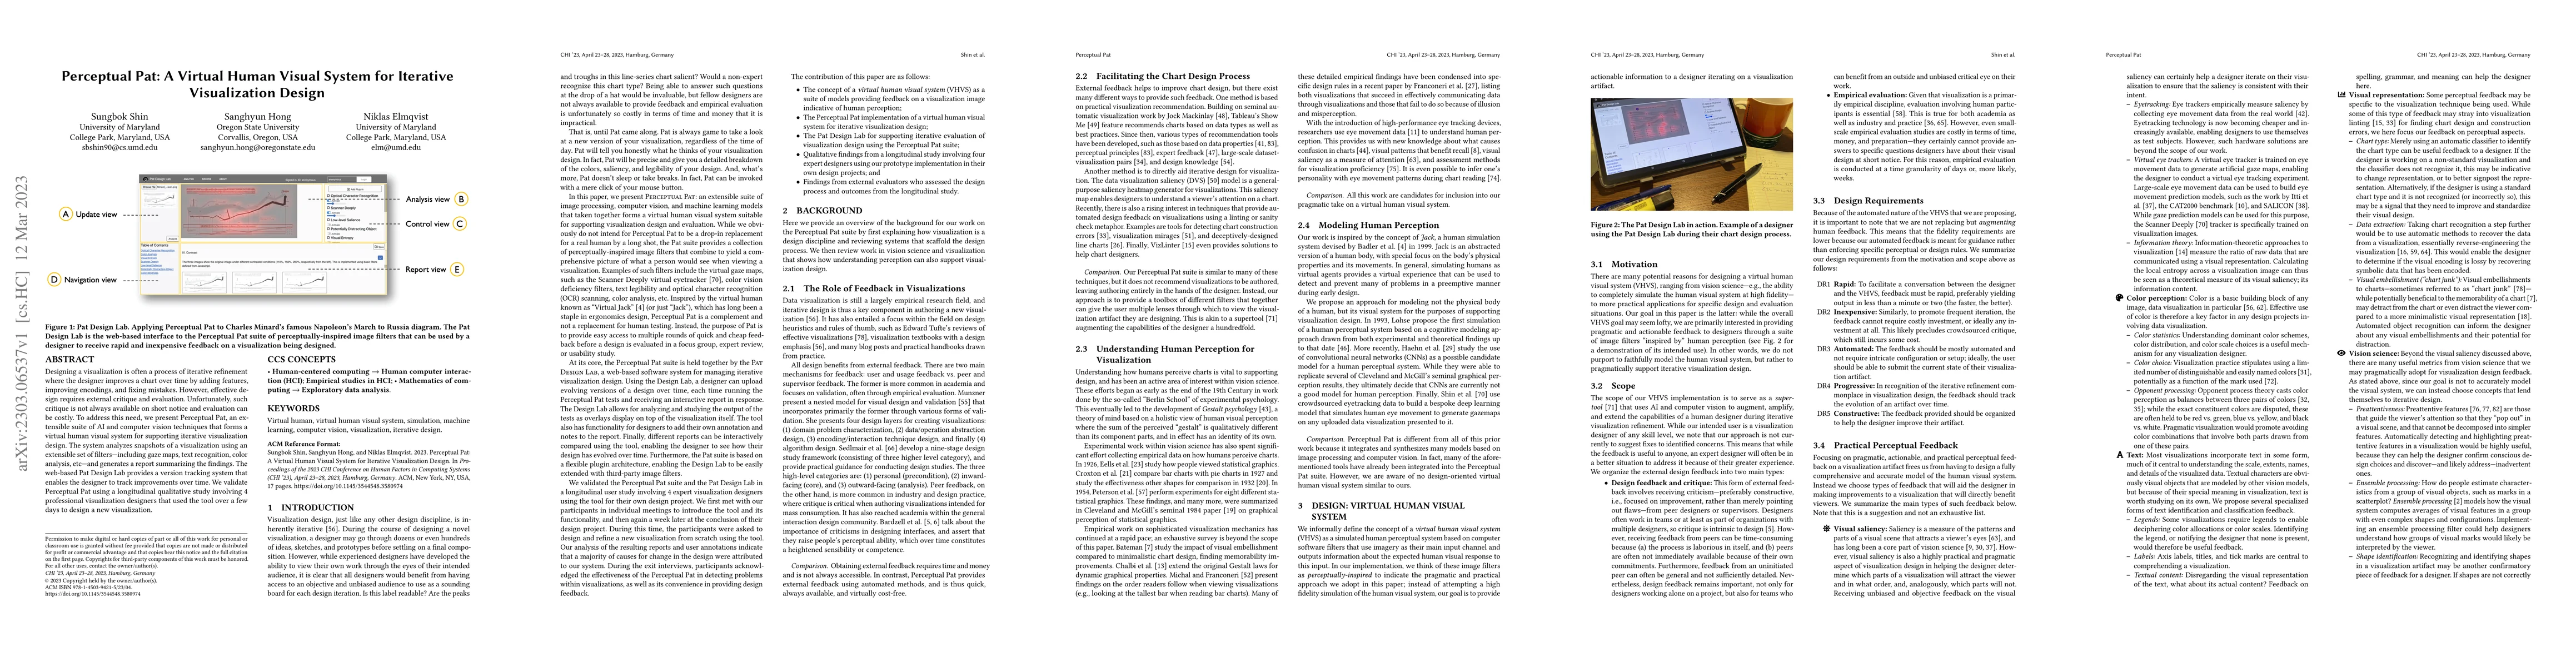
Designing a visualization is often a process of iterative refinement where the designer improves a chart over time by adding features, improving encodings, and fixing mistakes. However, effective design requires external critique and evaluation. Unfortunately, such critique is not always available on short notice and evaluation can be costly. To address this need, we present Perceptual Pat, an extensible suite of AI and computer vision techniques that forms a virtual human visual system for supporting iterative visualization design. The system analyzes snapshots of a visualization using an extensible set of filters - including gaze maps, text recognition, color analysis, etc - and generates a report summarizing the findings. The web-based Pat Design Lab provides a version tracking system that enables the designer to track improvements over time. We validate Perceptual Pat using a longitudinal qualitative study involving 4 professional visualization designers that used the tool over a few days to design a new visualization.
AI Key Findings
Get AI-generated insights about this paper's methodology, results, significance, and more — seven facets brought into focus.
Impact
Paper Details
Authors
PDF Preview
Key Terms
Citation Network
Current paper (gray), citations (green), references (blue)
Display is limited for performance on very large graphs.
Discussion 0