Academic Profile
Statistics
Similar Authors
Papers on arXiv
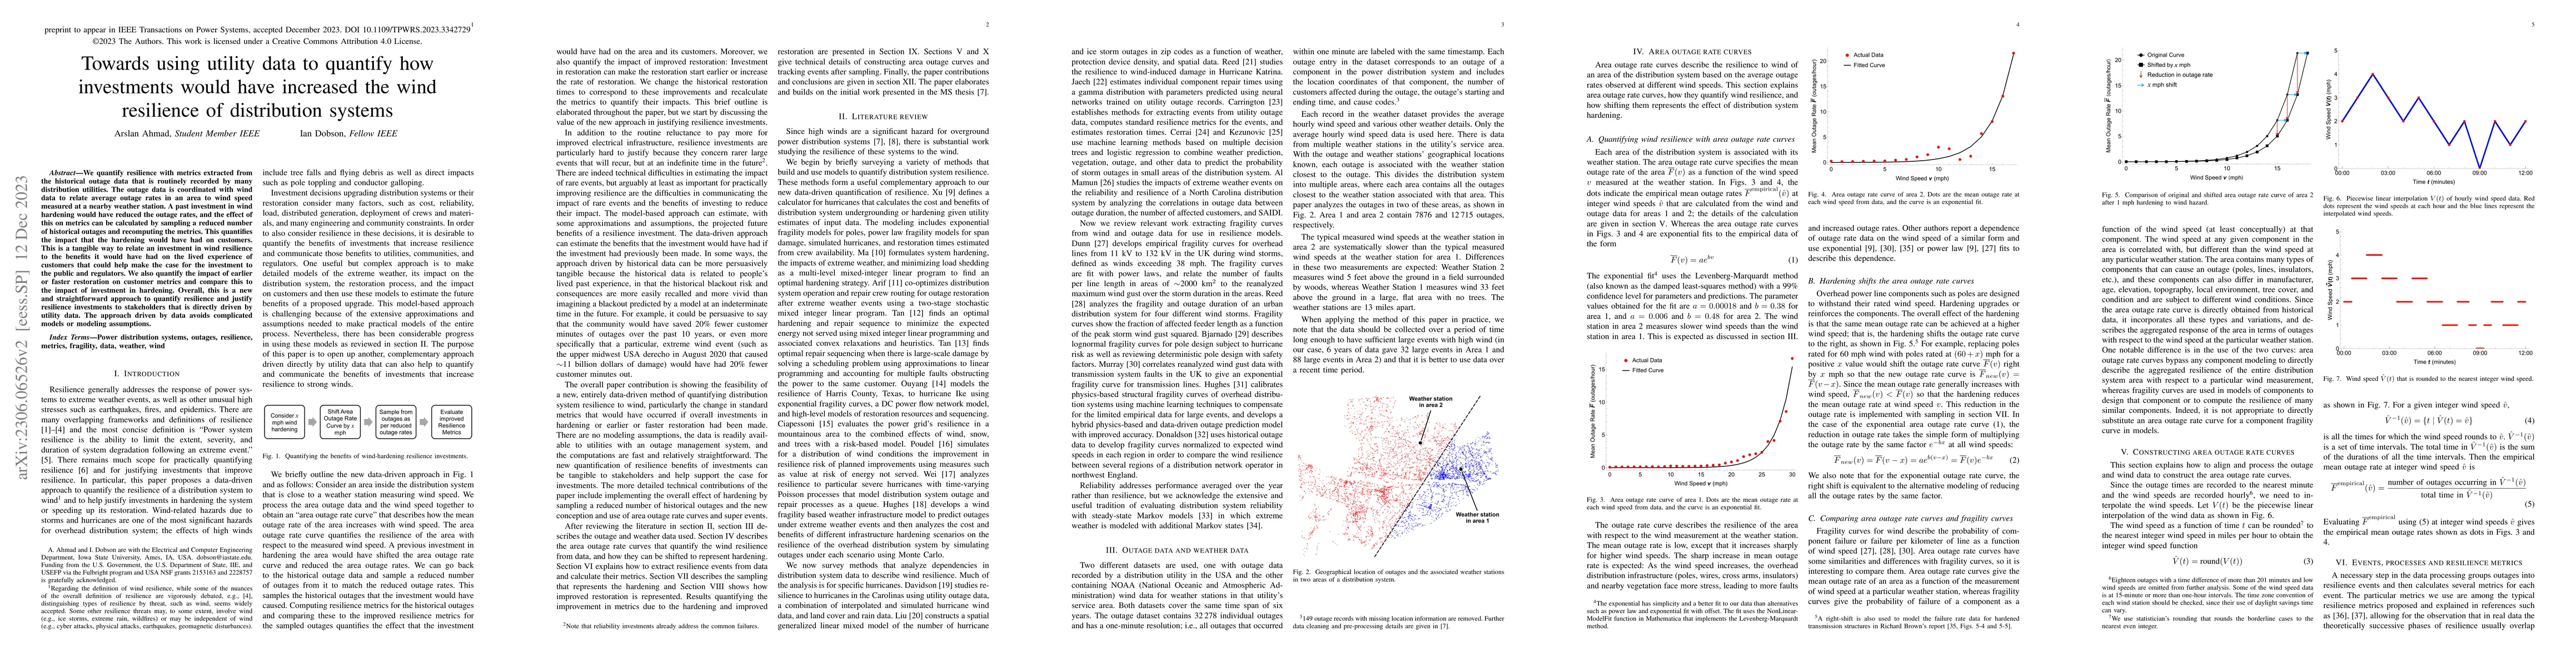
We quantify resilience with metrics extracted from the historical outage data that is routinely recorded by many distribution utilities. The outage data is coordinated with wind data to relate avera...
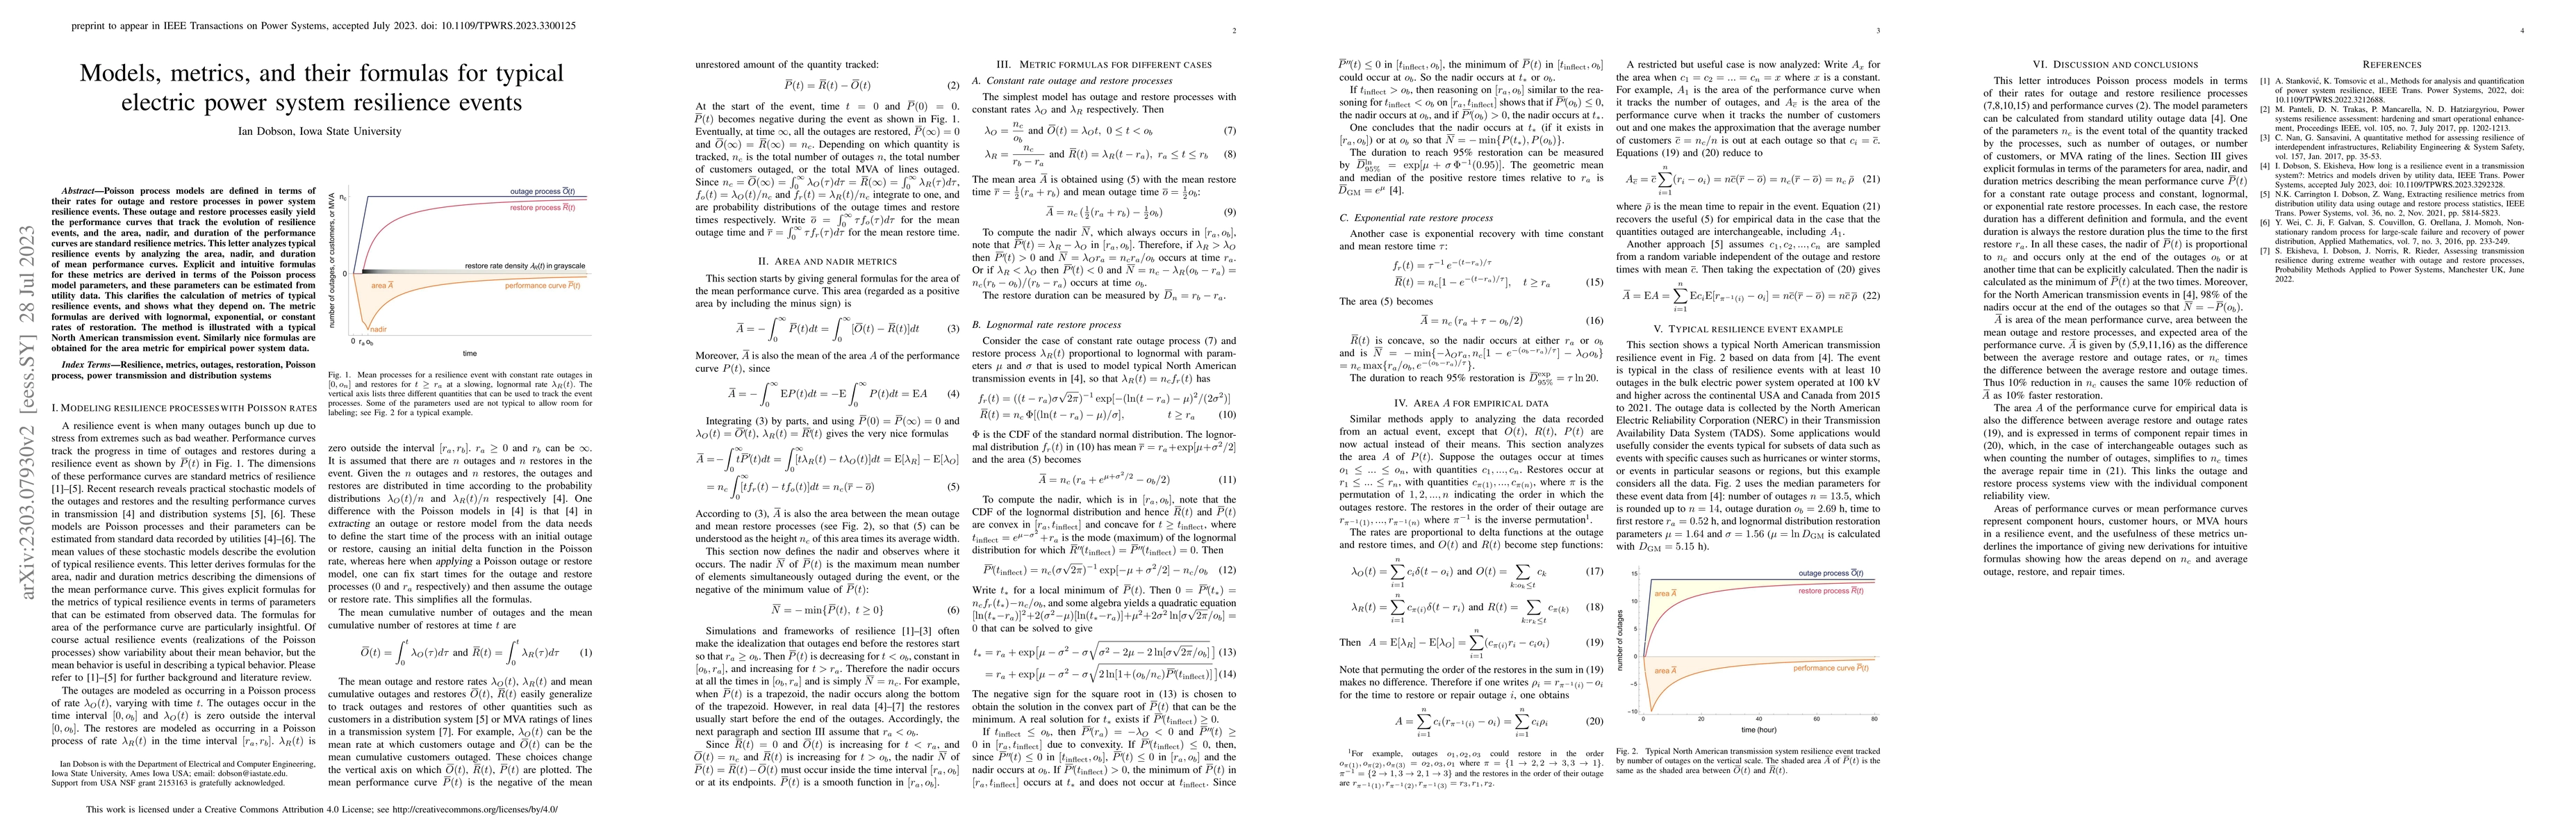
Poisson process models are defined in terms of their rates for outage and restore processes in power system resilience events. These outage and restore processes easily yield the performance curves ...
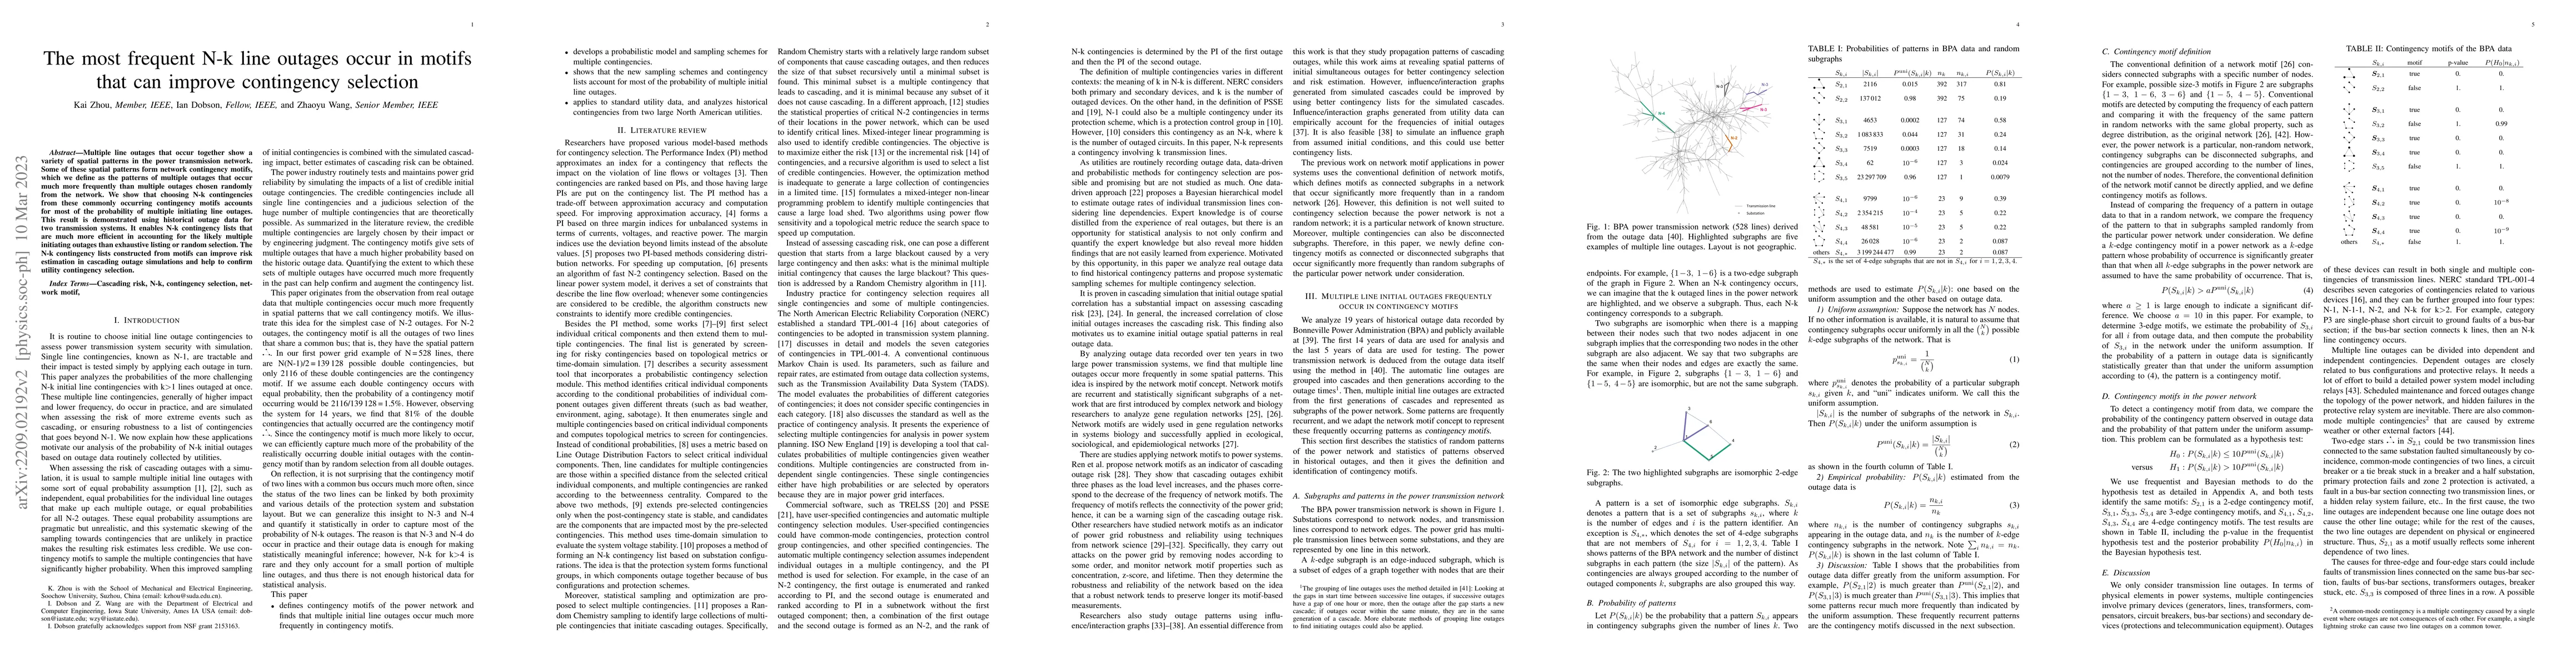
Multiple line outages that occur together show a variety of spatial patterns in the power transmission network. Some of these spatial patterns form network contingency motifs, which we define as the...
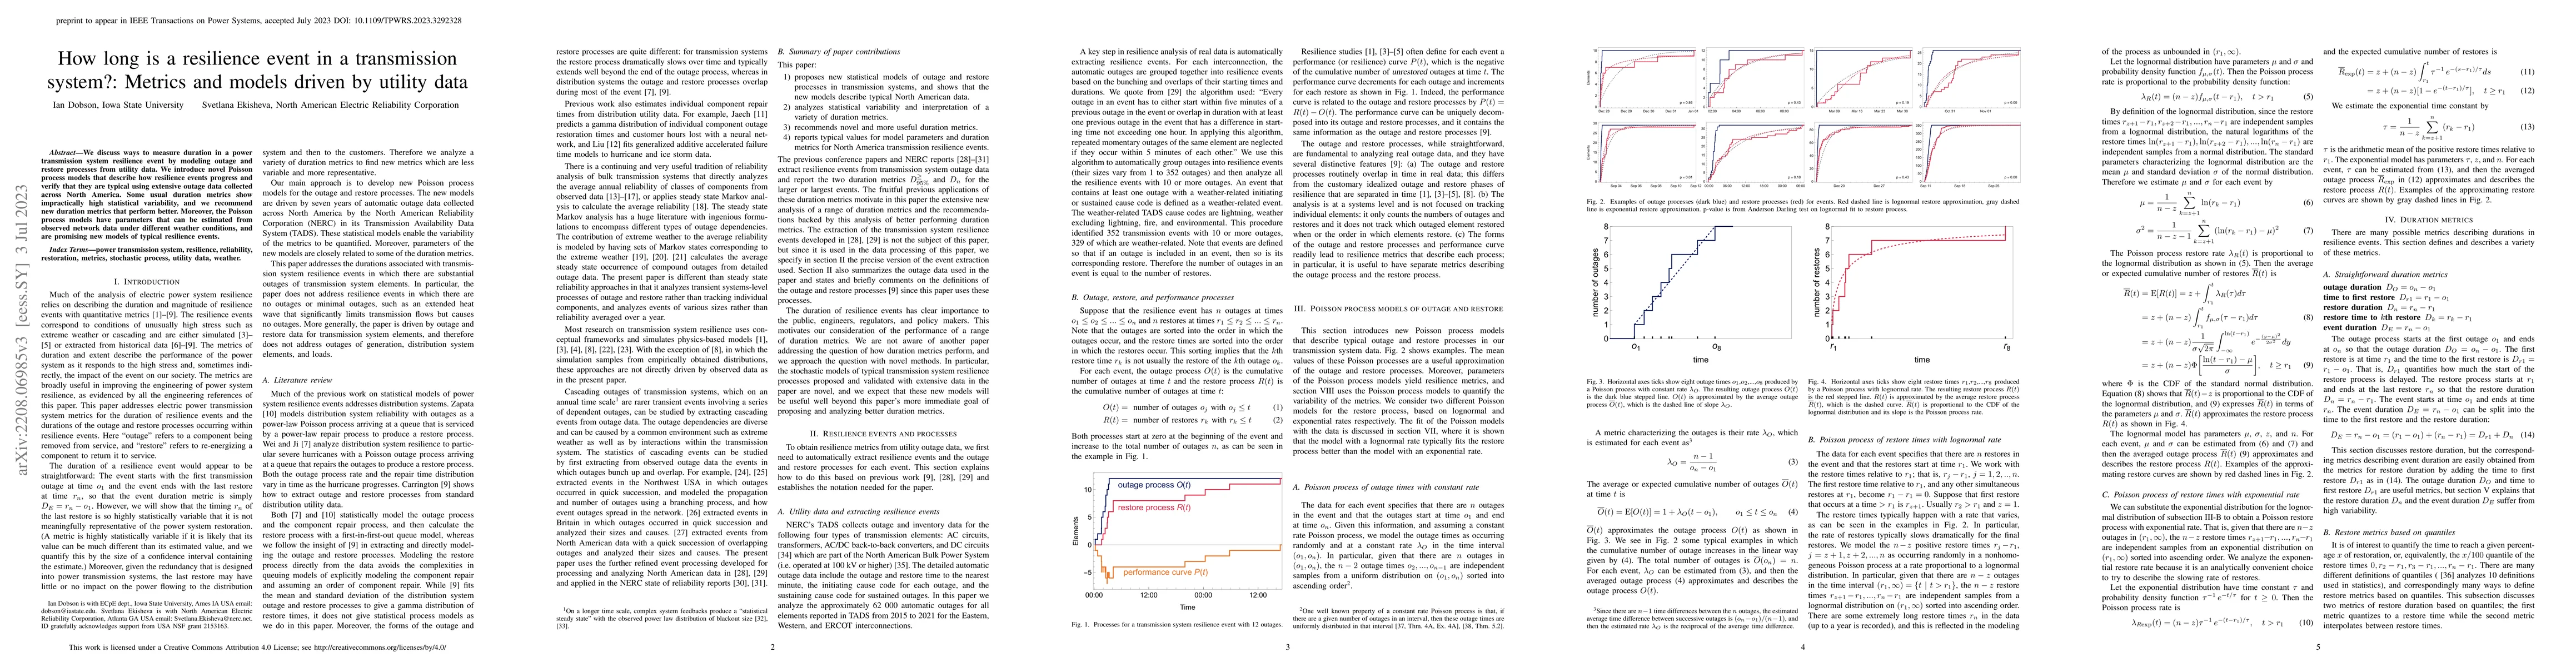
We discuss ways to measure duration in a power transmission system resilience event by modeling outage and restore processes from utility data. We introduce novel Poisson process models that describ...
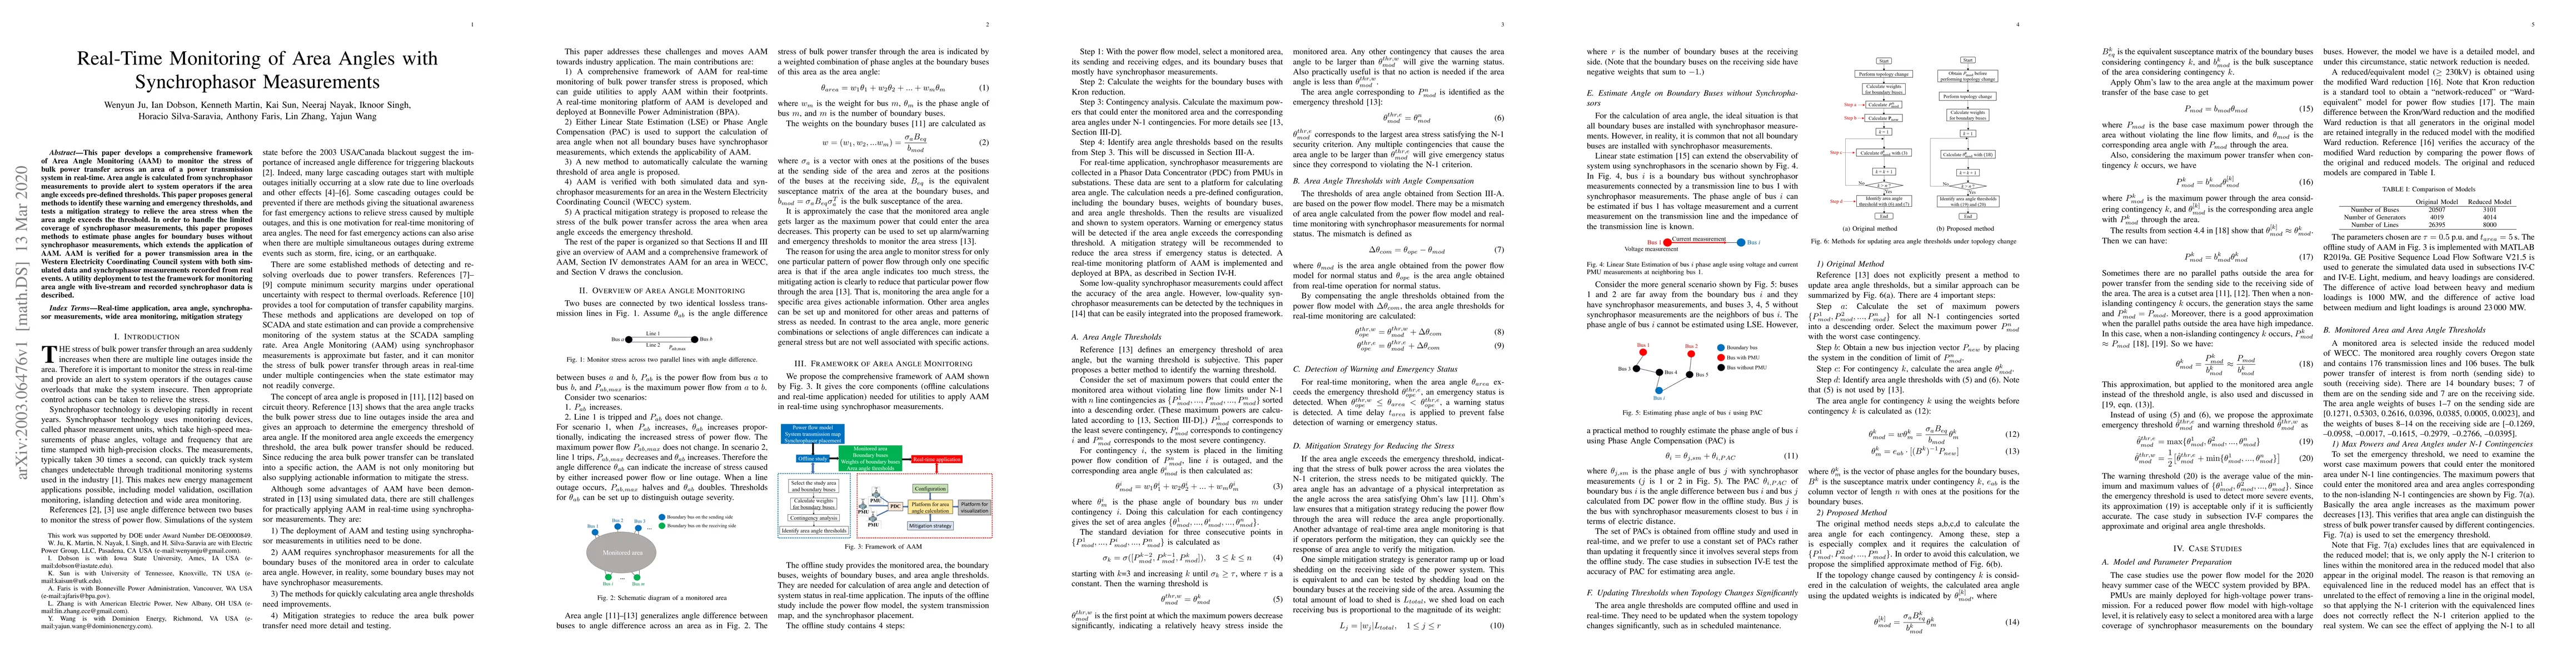
This paper develops a comprehensive framework of Area Angle Monitoring (AAM) to monitor the stress of bulk power transfer across an area of a power transmission system in real-time. Area angle is ca...
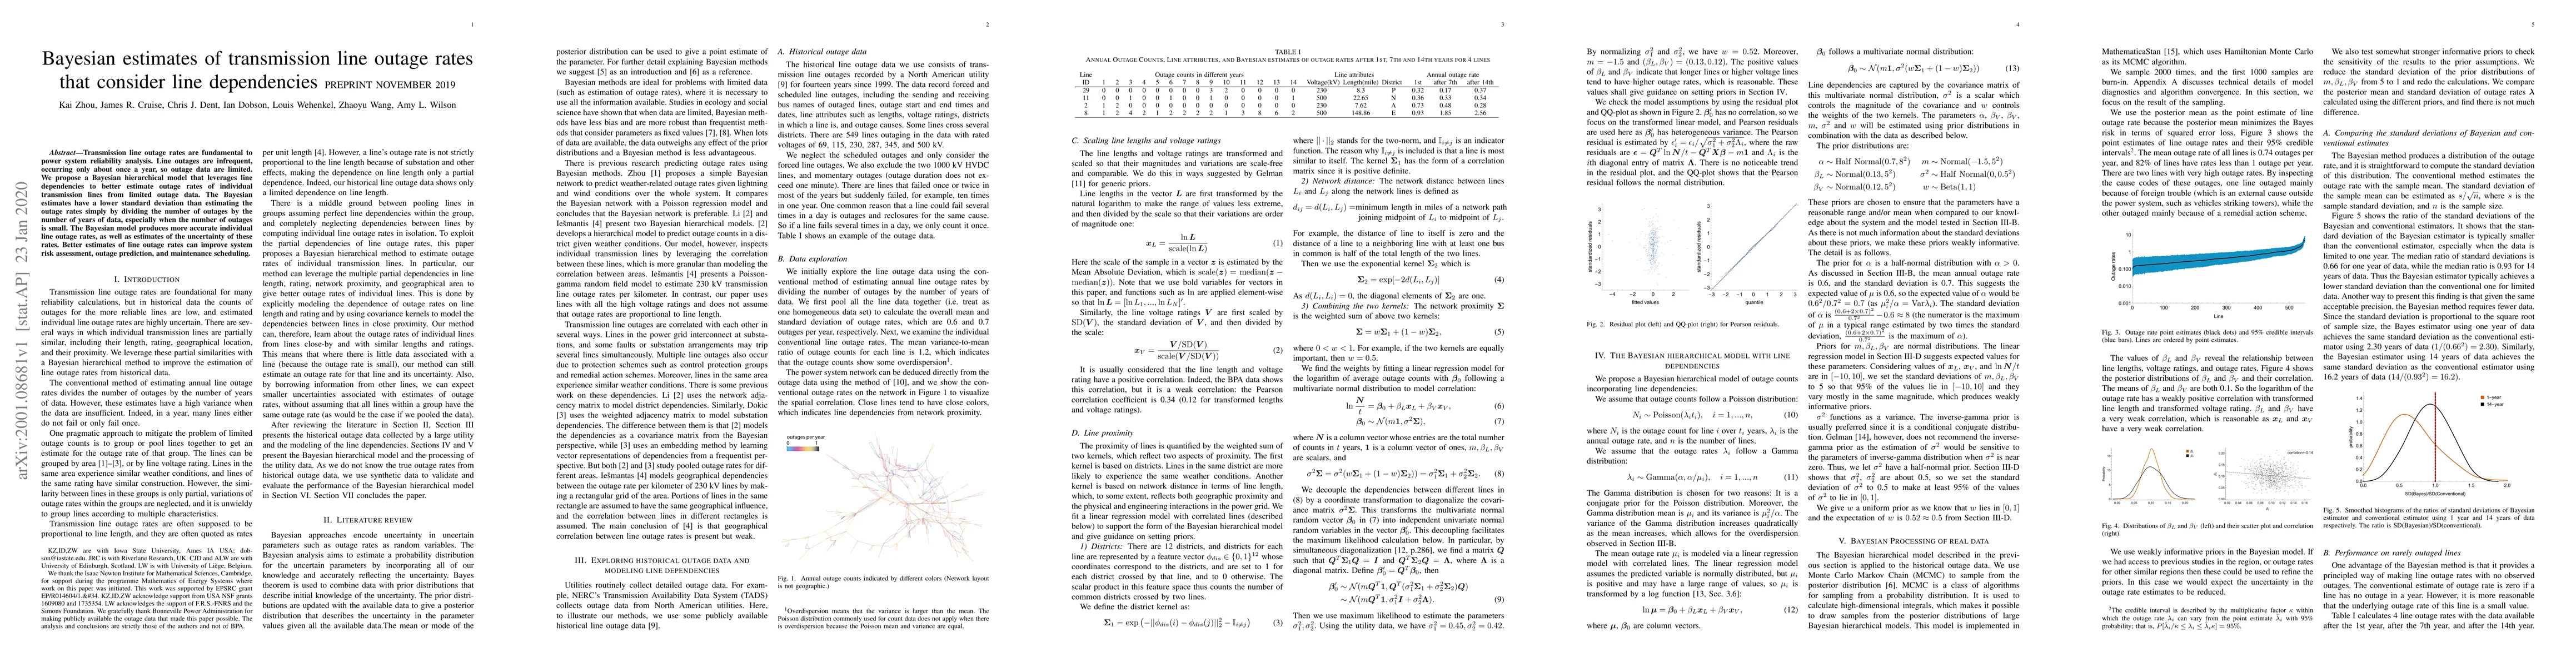
Transmission line outage rates are fundamental to power system reliability analysis. Line outages are infrequent, occurring only about once a year, so outage data are limited. We propose a Bayesian ...
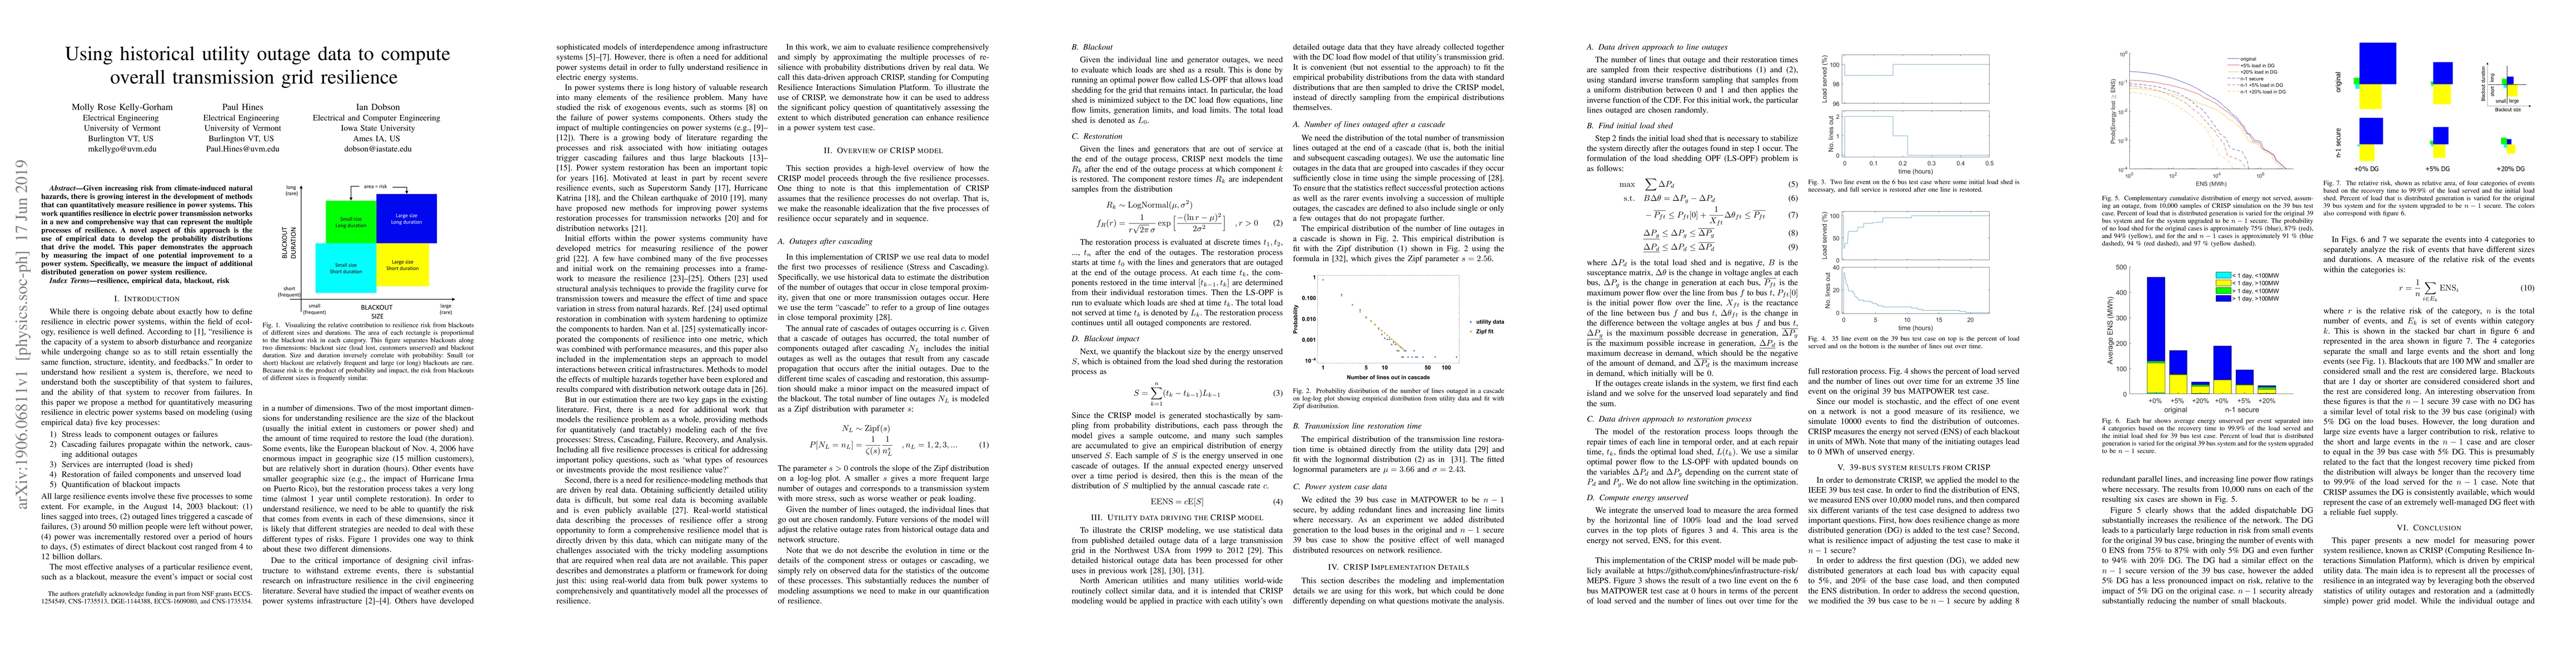
Given increasing risk from climate-induced natural hazards, there is growing interest in the development of methods that can quantitatively measure resilience in power systems. This work quantifies ...
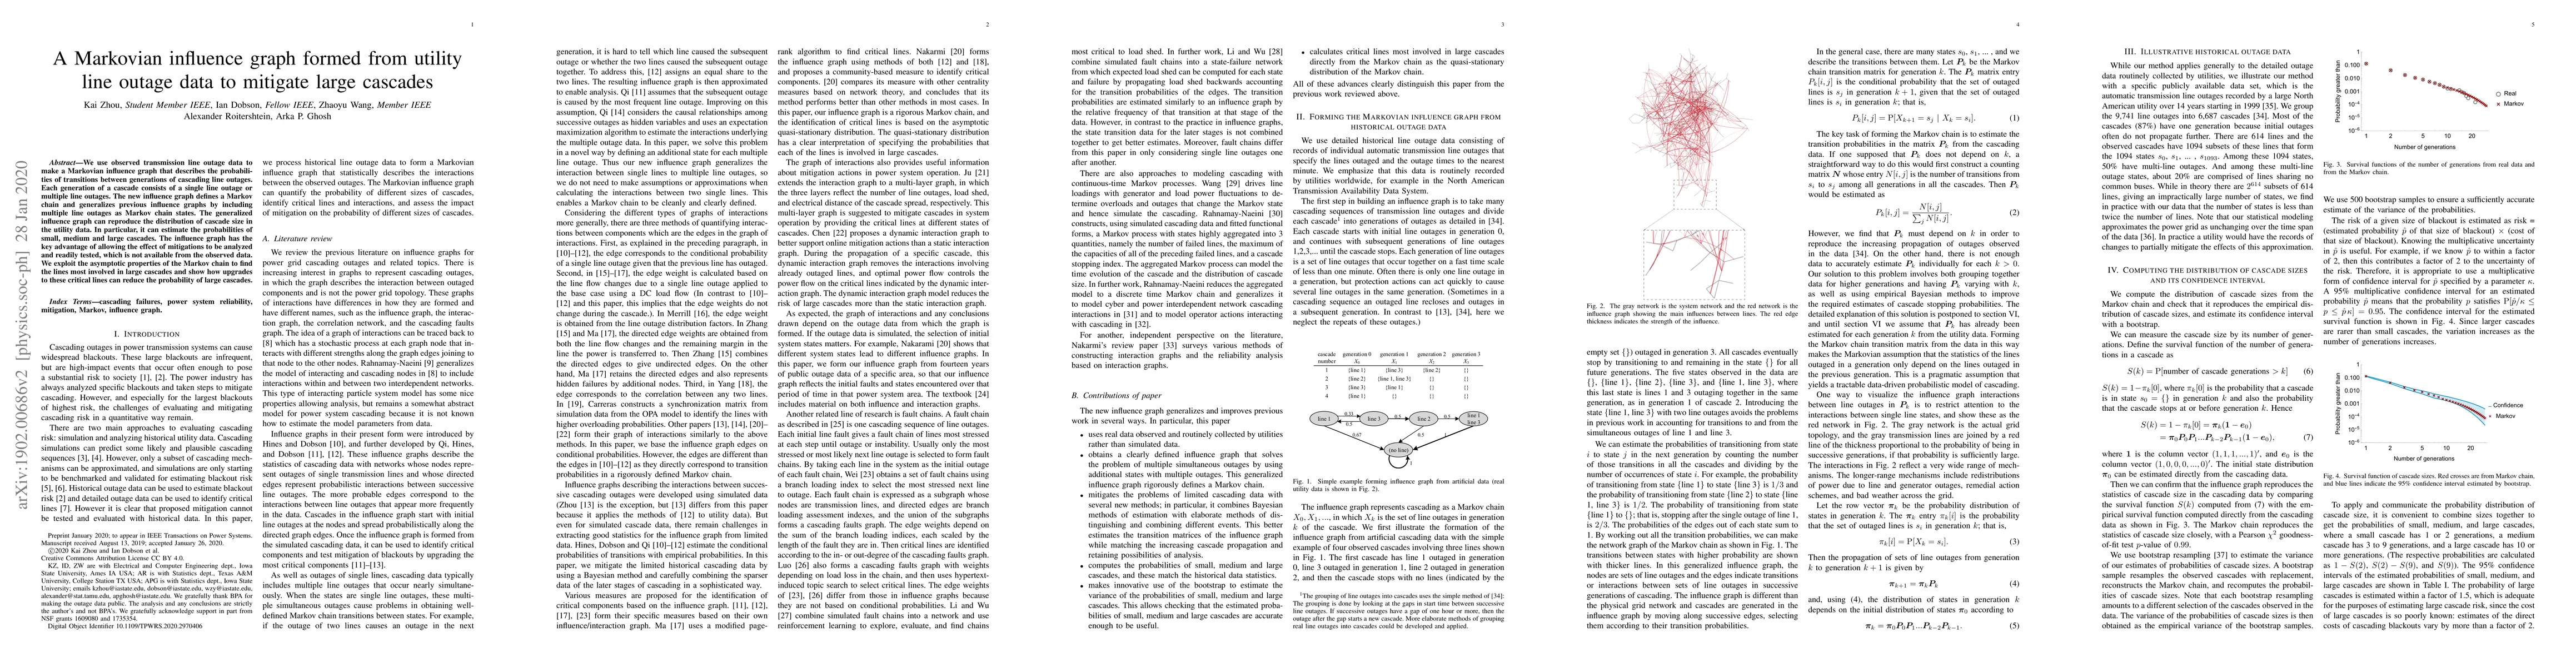
We use observed transmission line outage data to make a Markov influence graph that describes the probabilities of transitions between generations of cascading line outages, where each generation of...
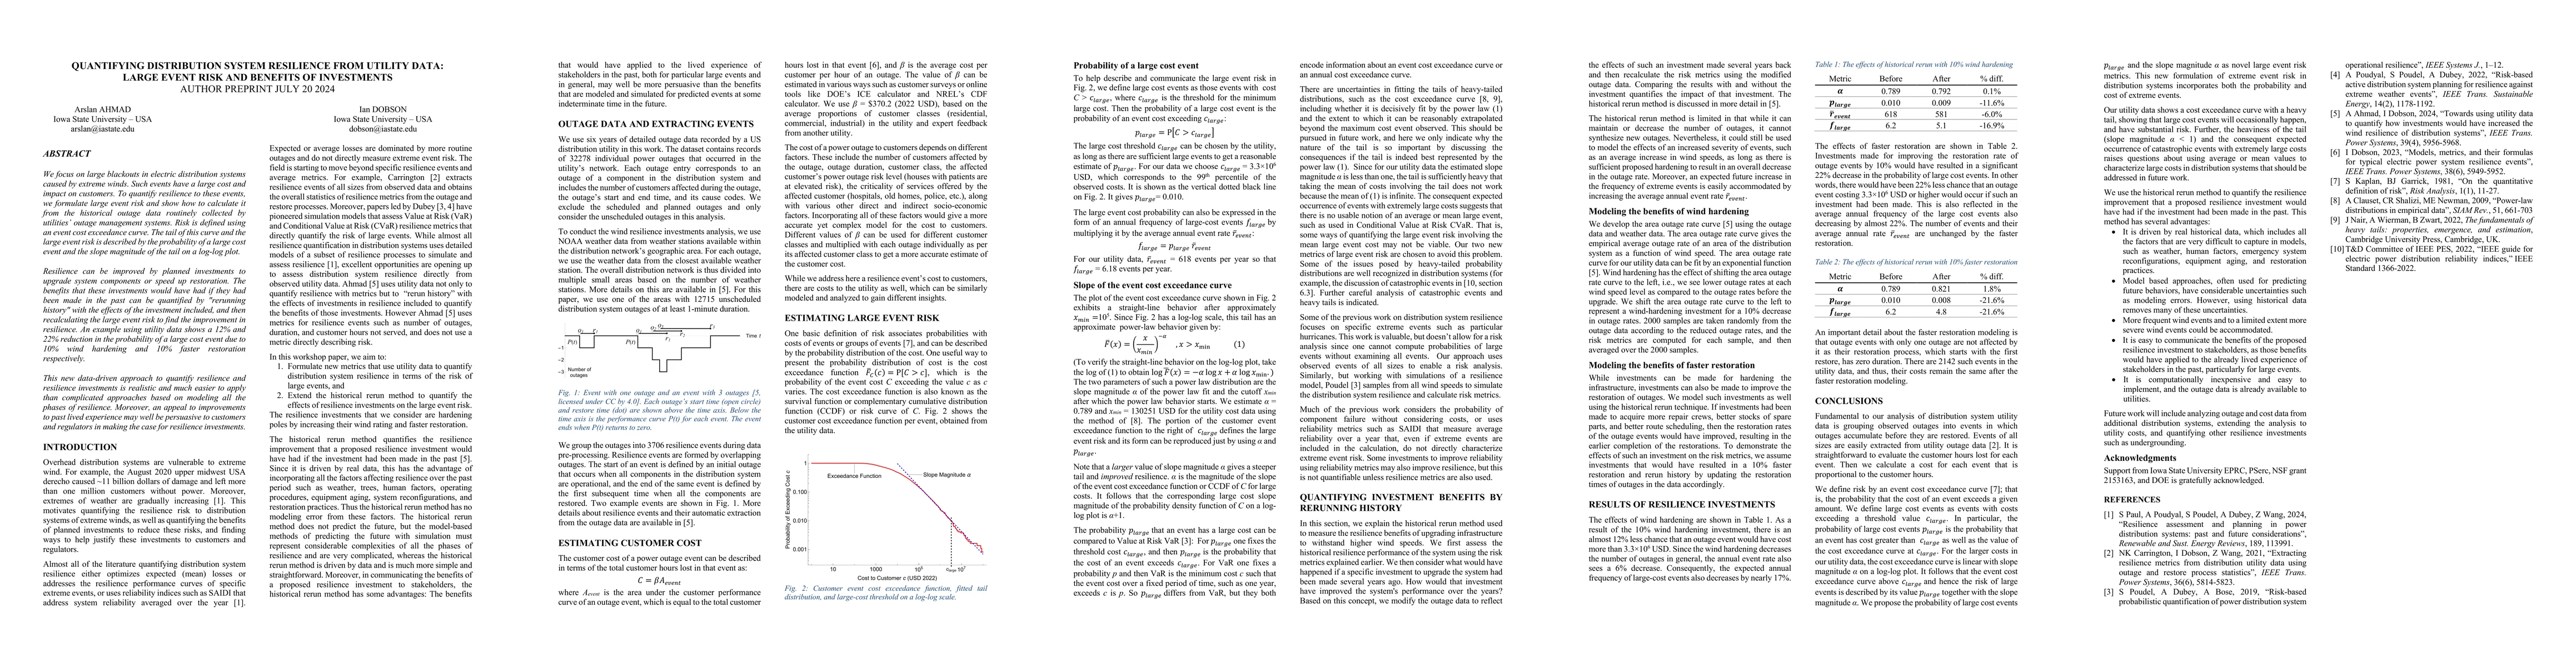
We focus on large blackouts in electric distribution systems caused by extreme winds. Such events have a large cost and impact on customers. To quantify resilience to these events, we formulate large ...
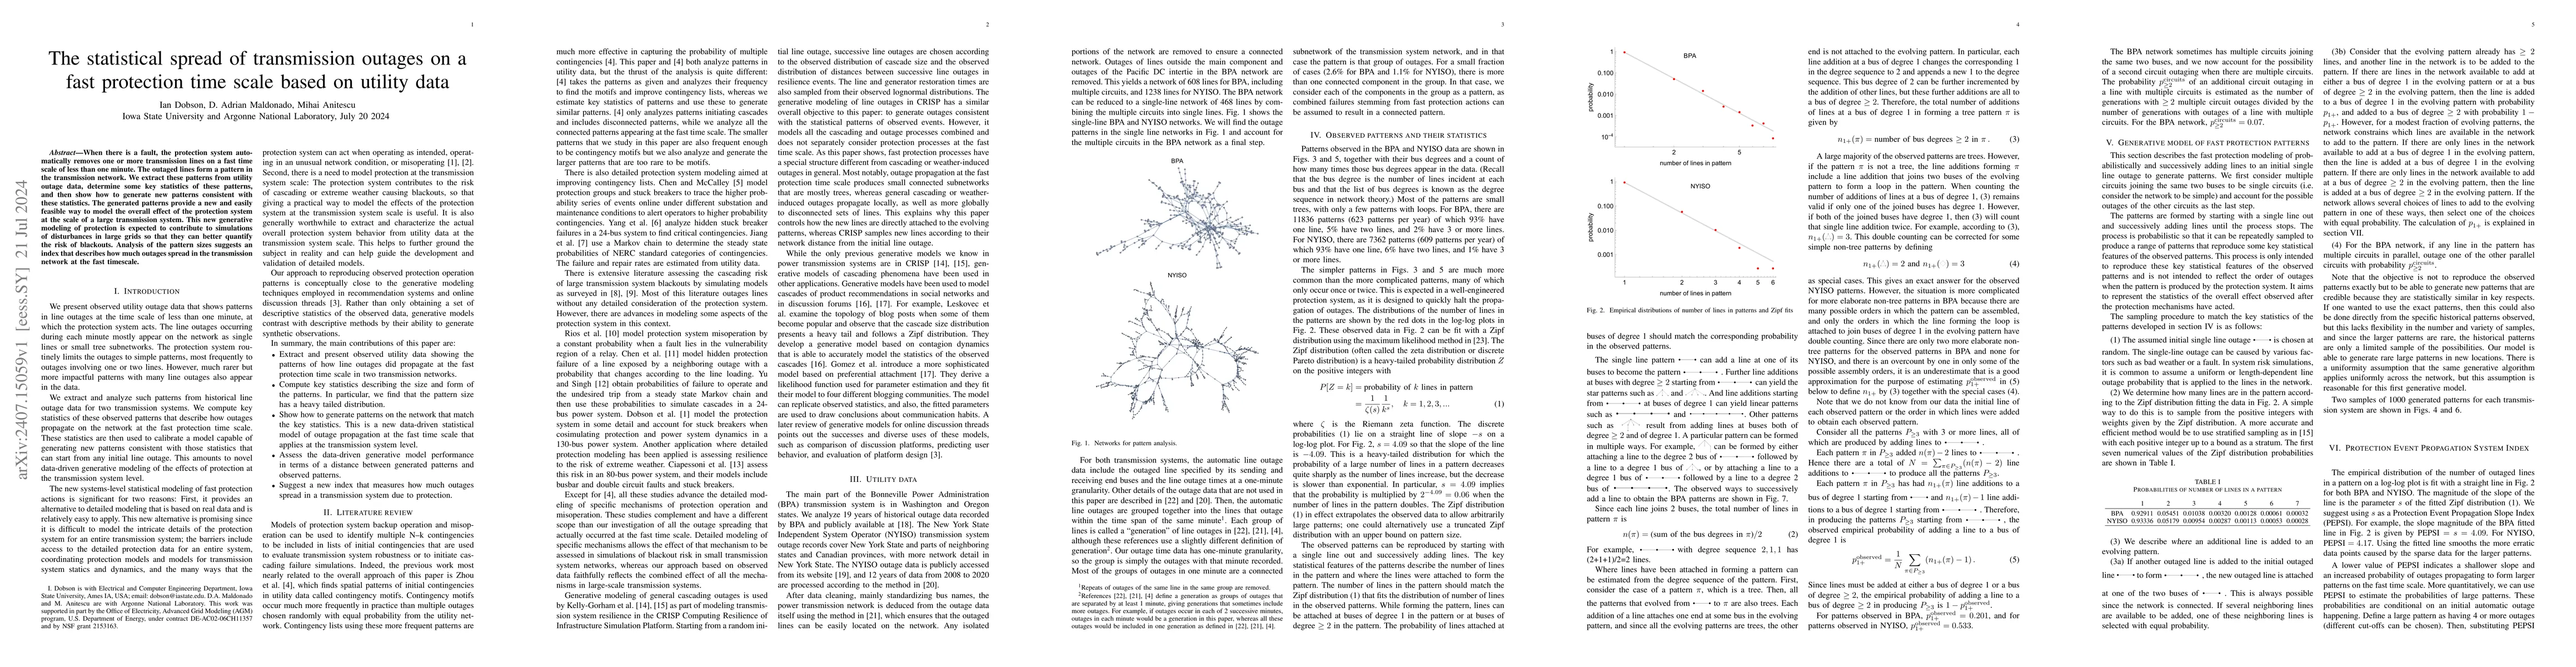
When there is a fault, the protection system automatically removes one or more transmission lines on a fast time scale of less than one minute. The outaged lines form a pattern in the transmission net...
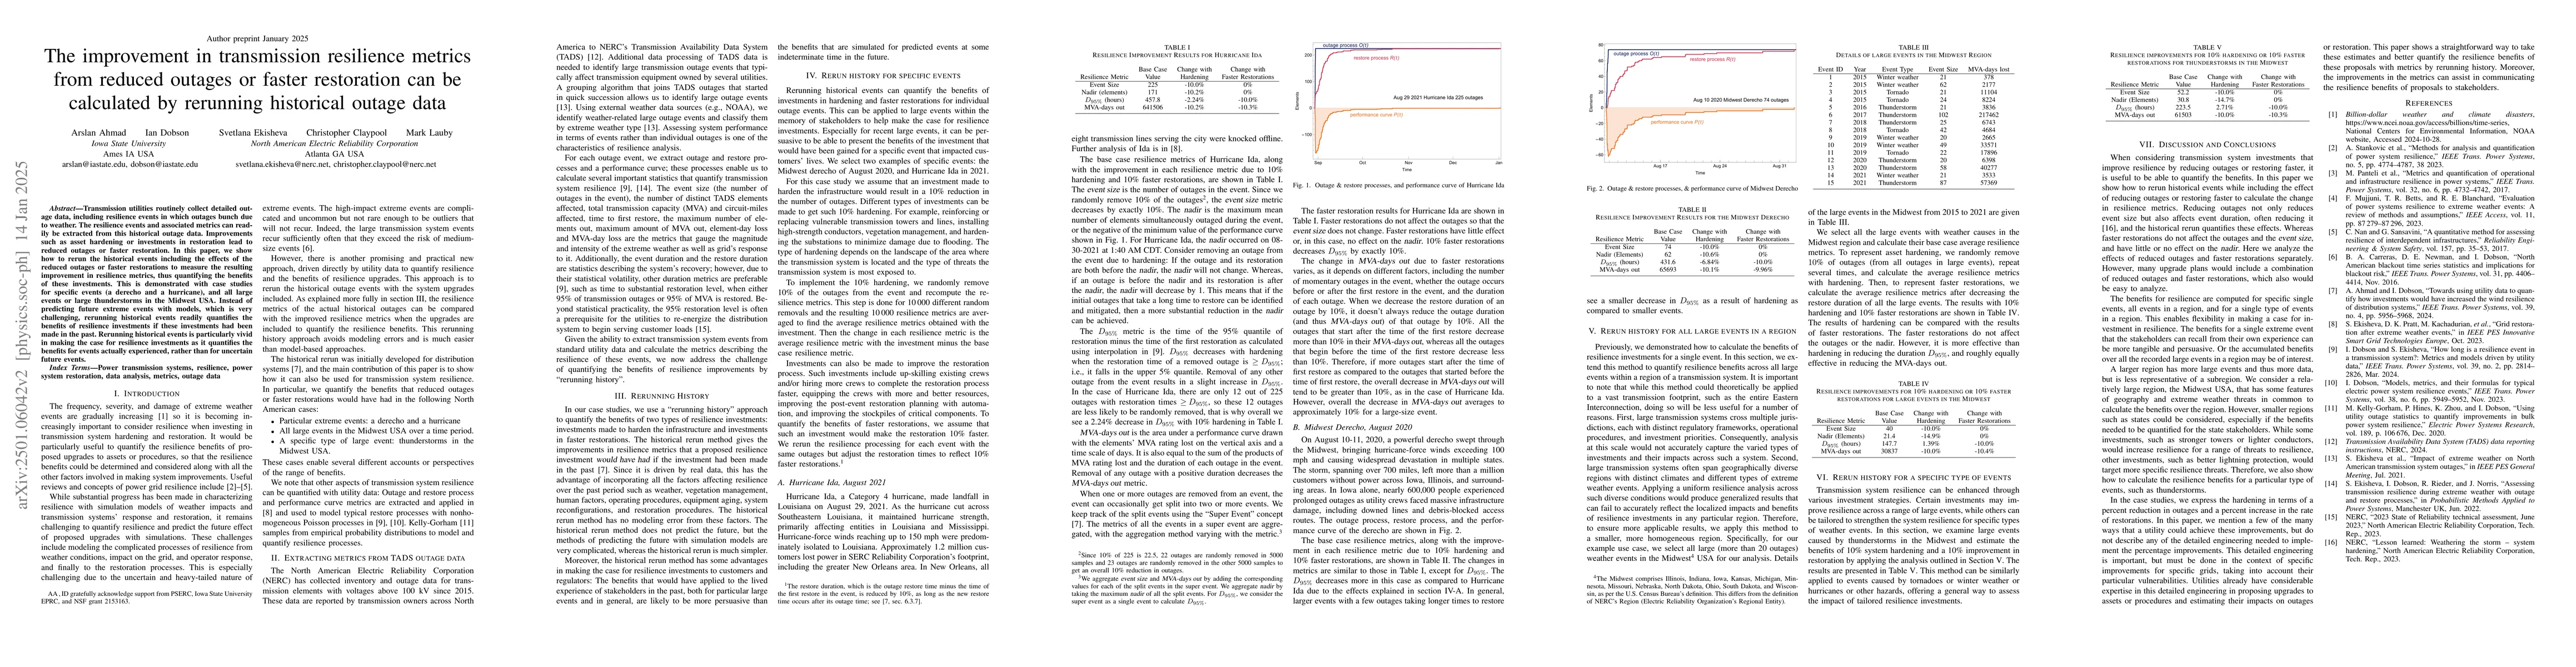
Transmission utilities routinely collect detailed outage data, including resilience events in which outages bunch up due to weather. The resilience events and their resilience metrics can readily be e...
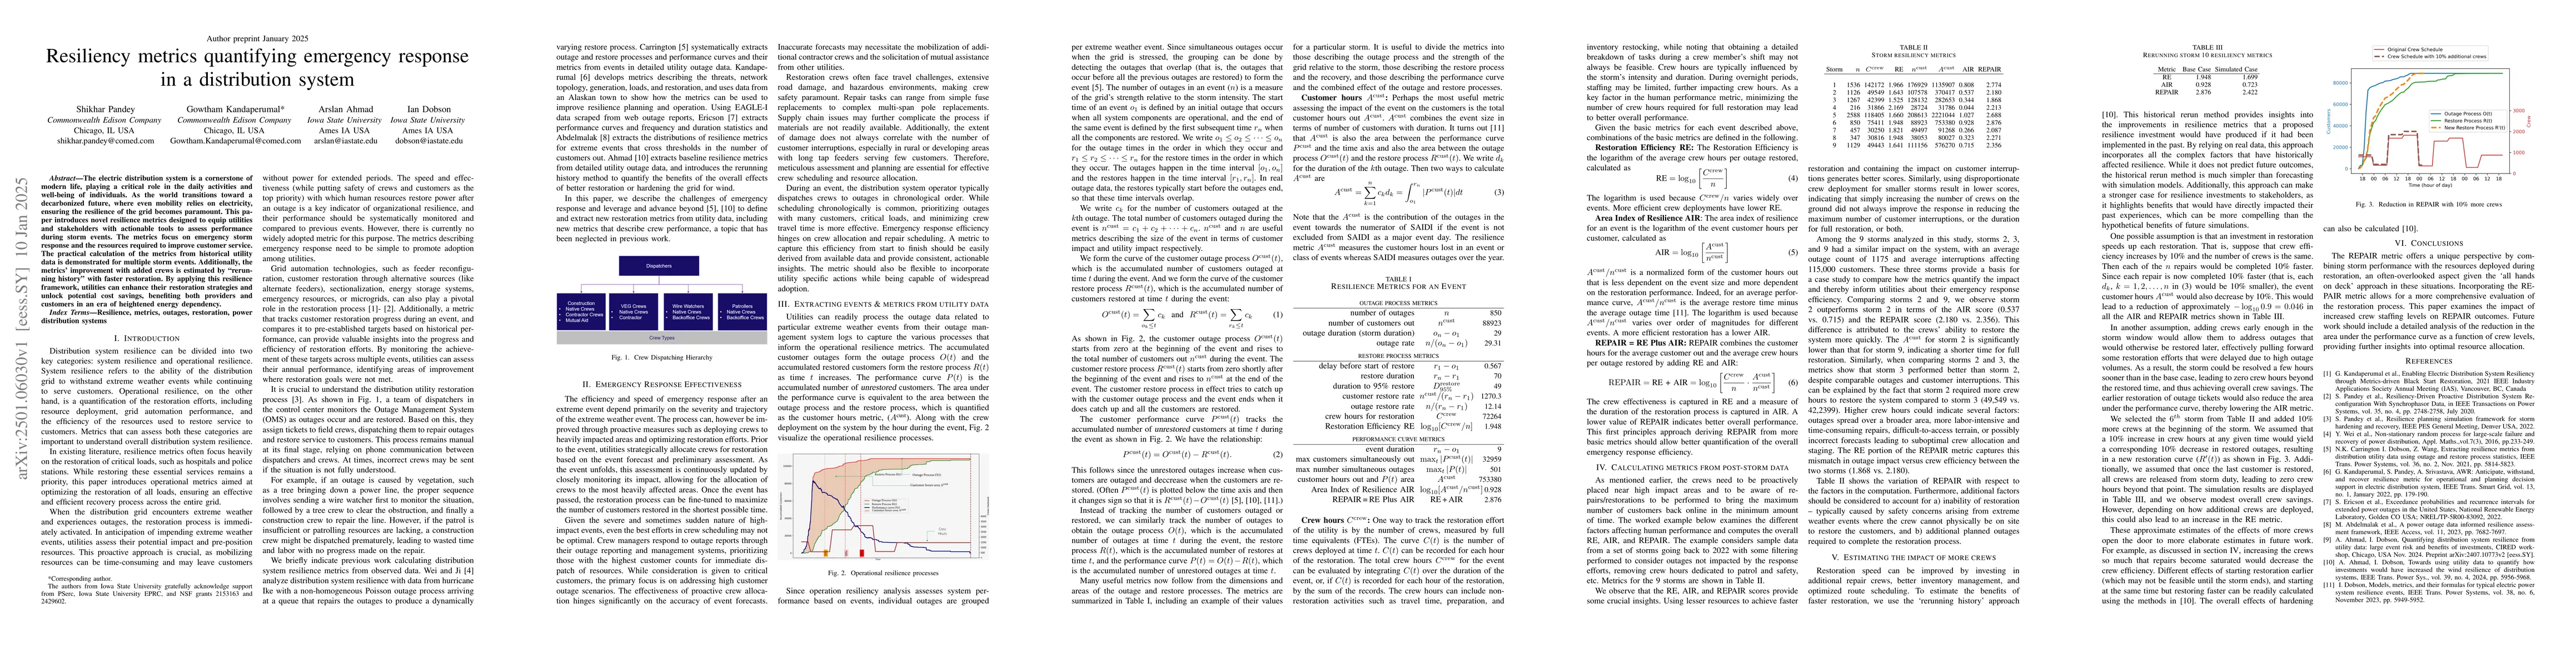
The electric distribution system is a cornerstone of modern life, playing a critical role in the daily activities and well-being of individuals. As the world transitions toward a decarbonized future, ...
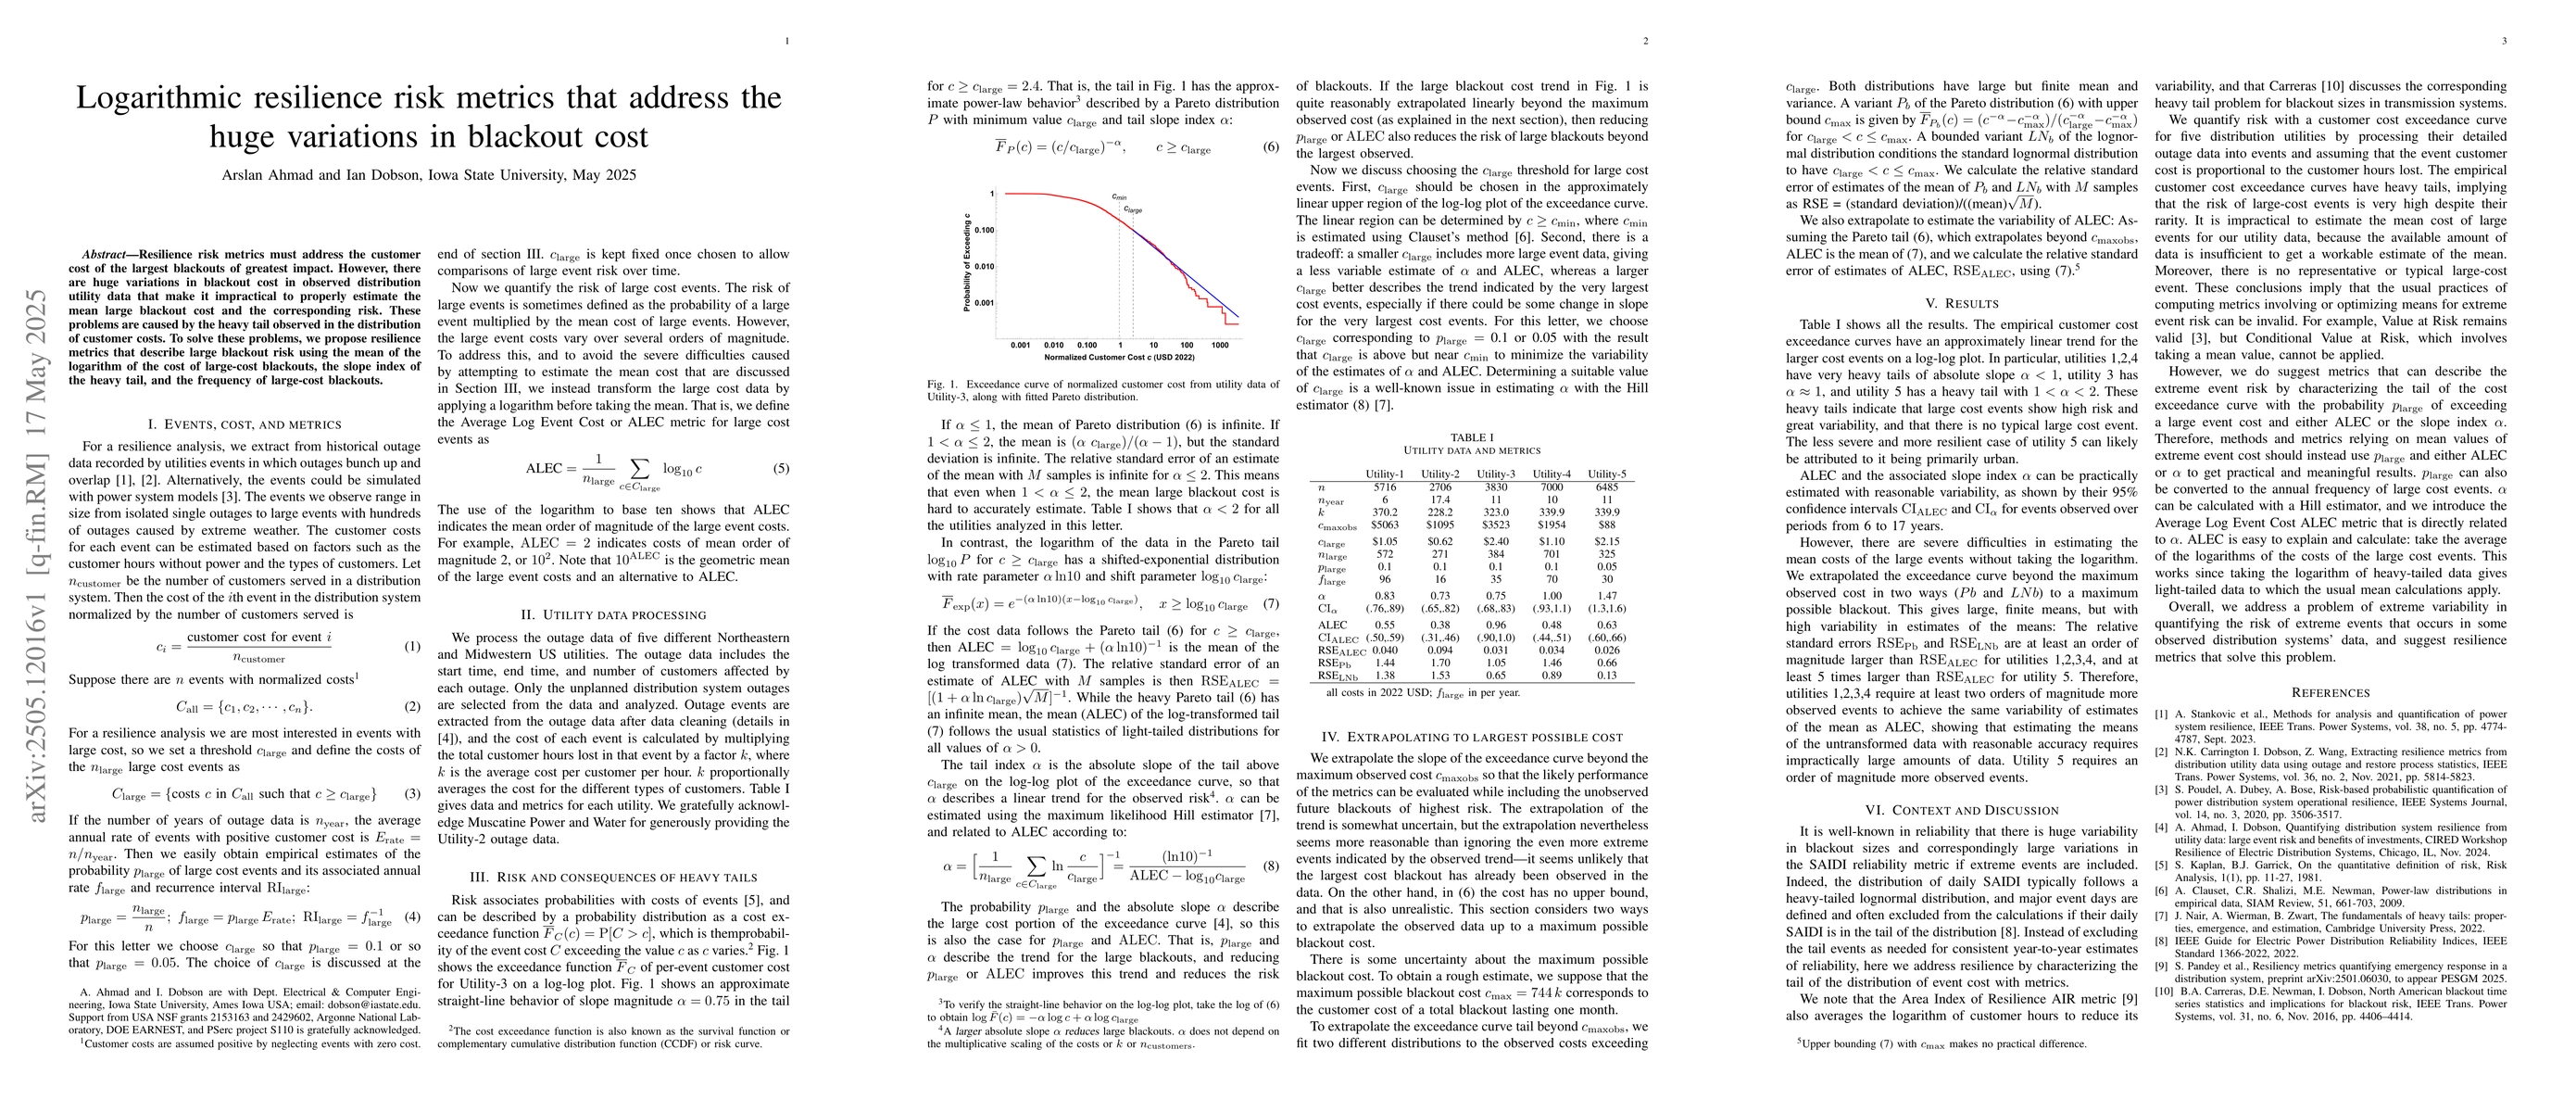
Resilience risk metrics must address the customer cost of the largest blackouts of greatest impact. However, there are huge variations in blackout cost in observed distribution utility data that make ...
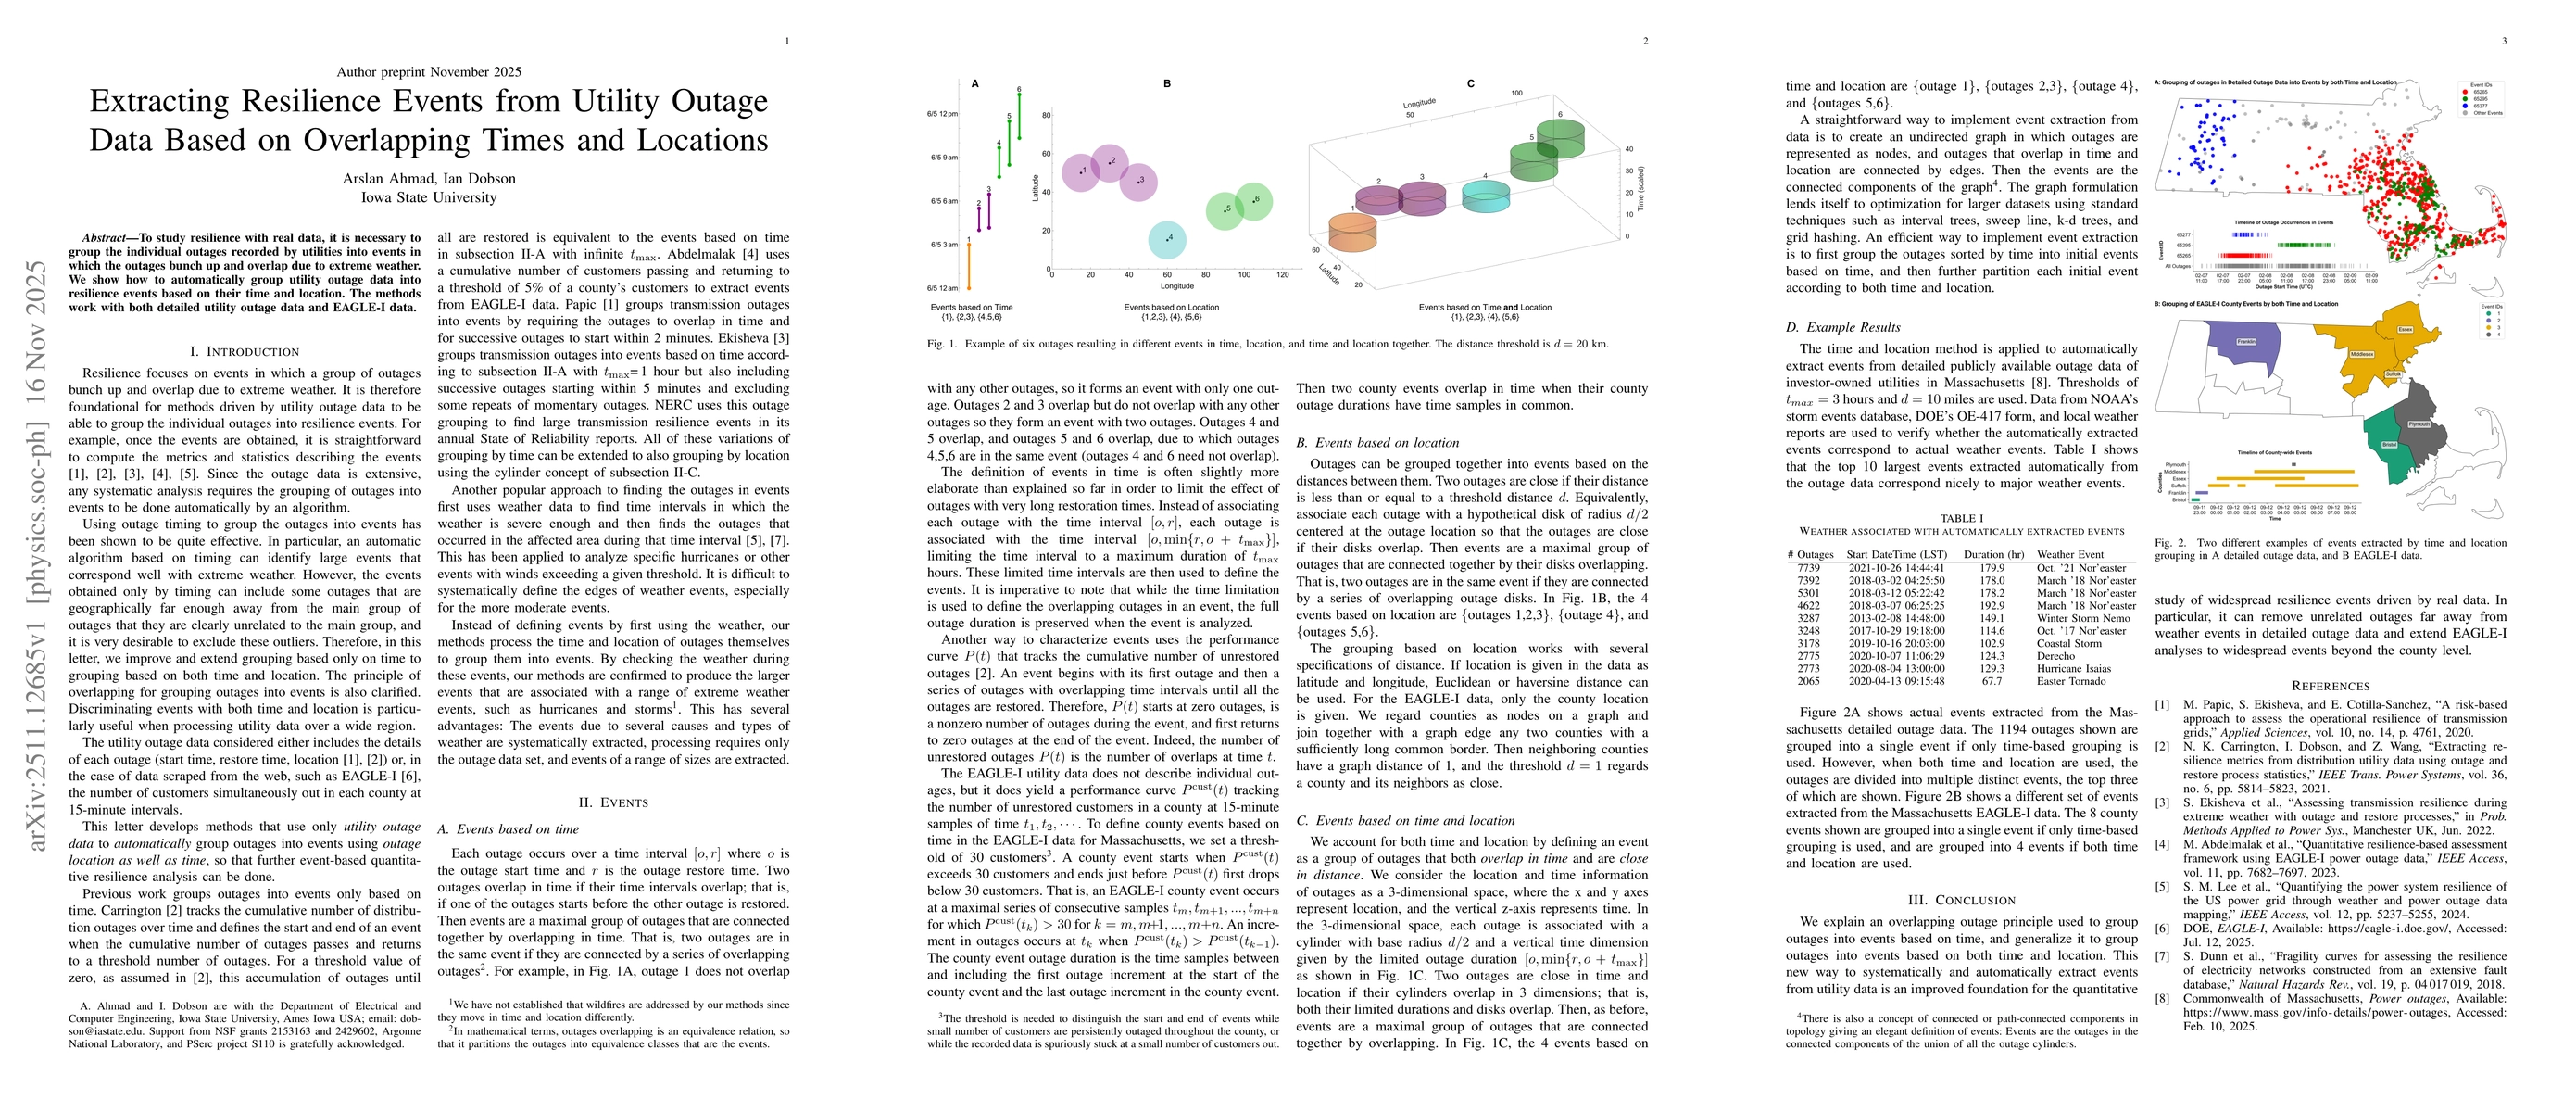
To study resilience with real data, it is necessary to group the individual outages recorded by utilities into events in which the outages bunch up and overlap due to extreme weather. We show how to a...
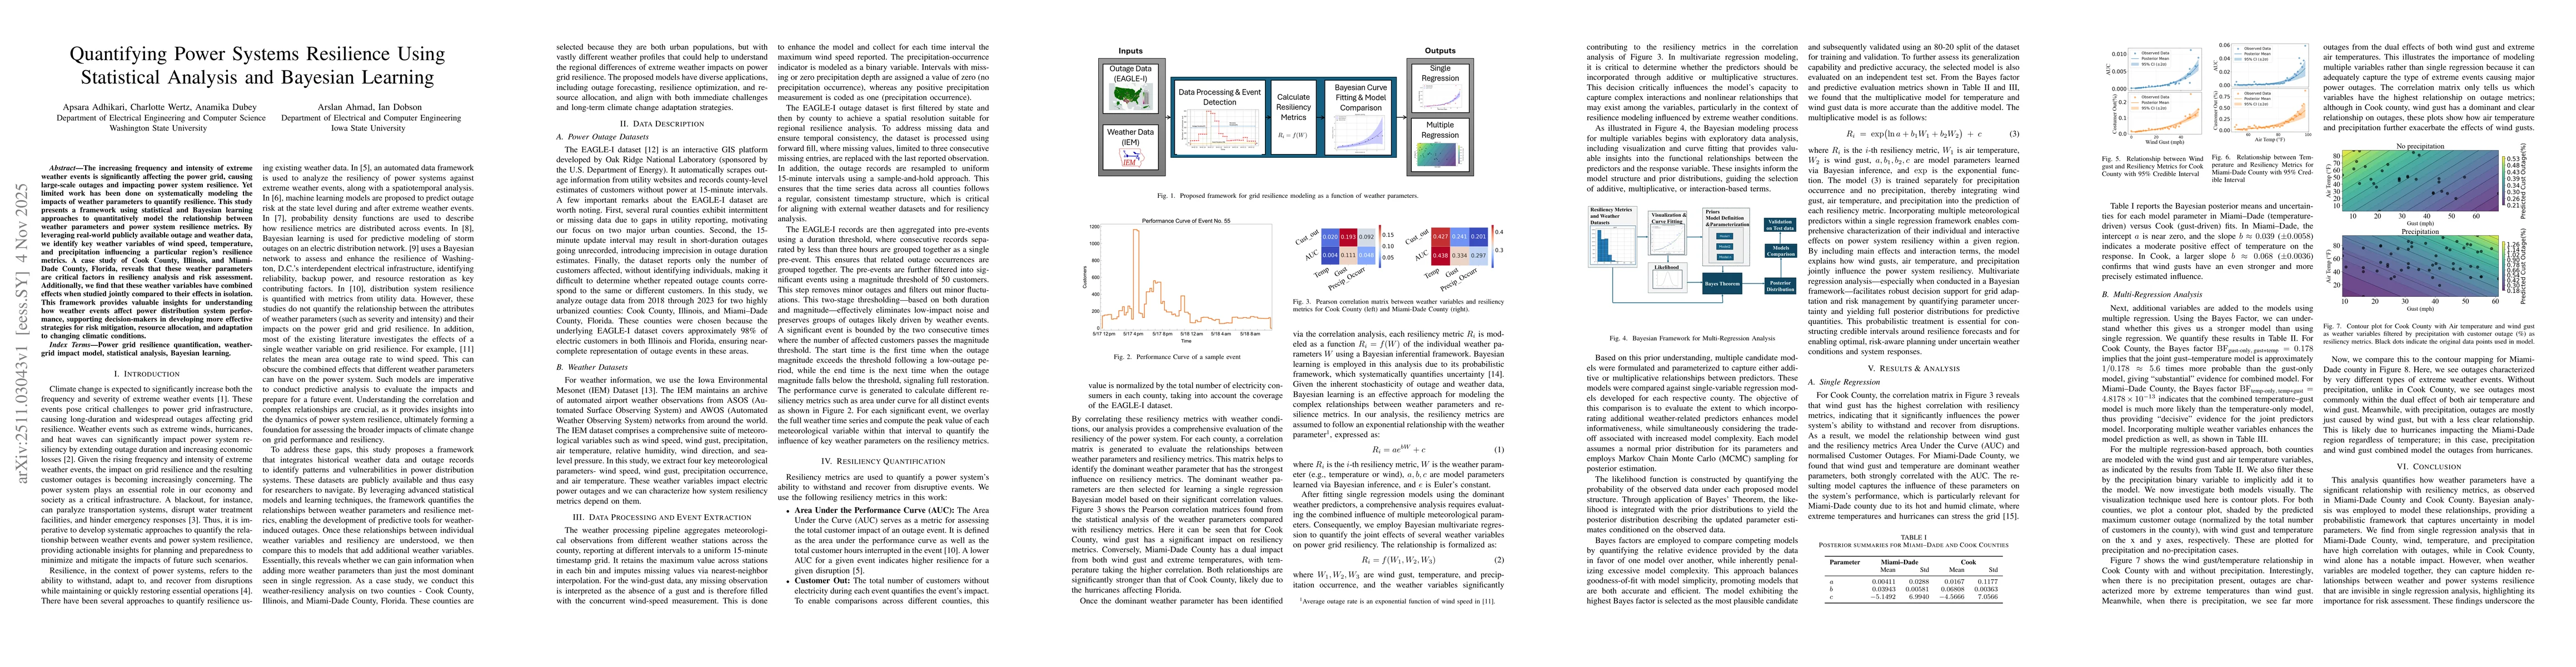
The increasing frequency and intensity of extreme weather events is significantly affecting the power grid, causing large-scale outages and impacting power system resilience. Yet limited work has been...
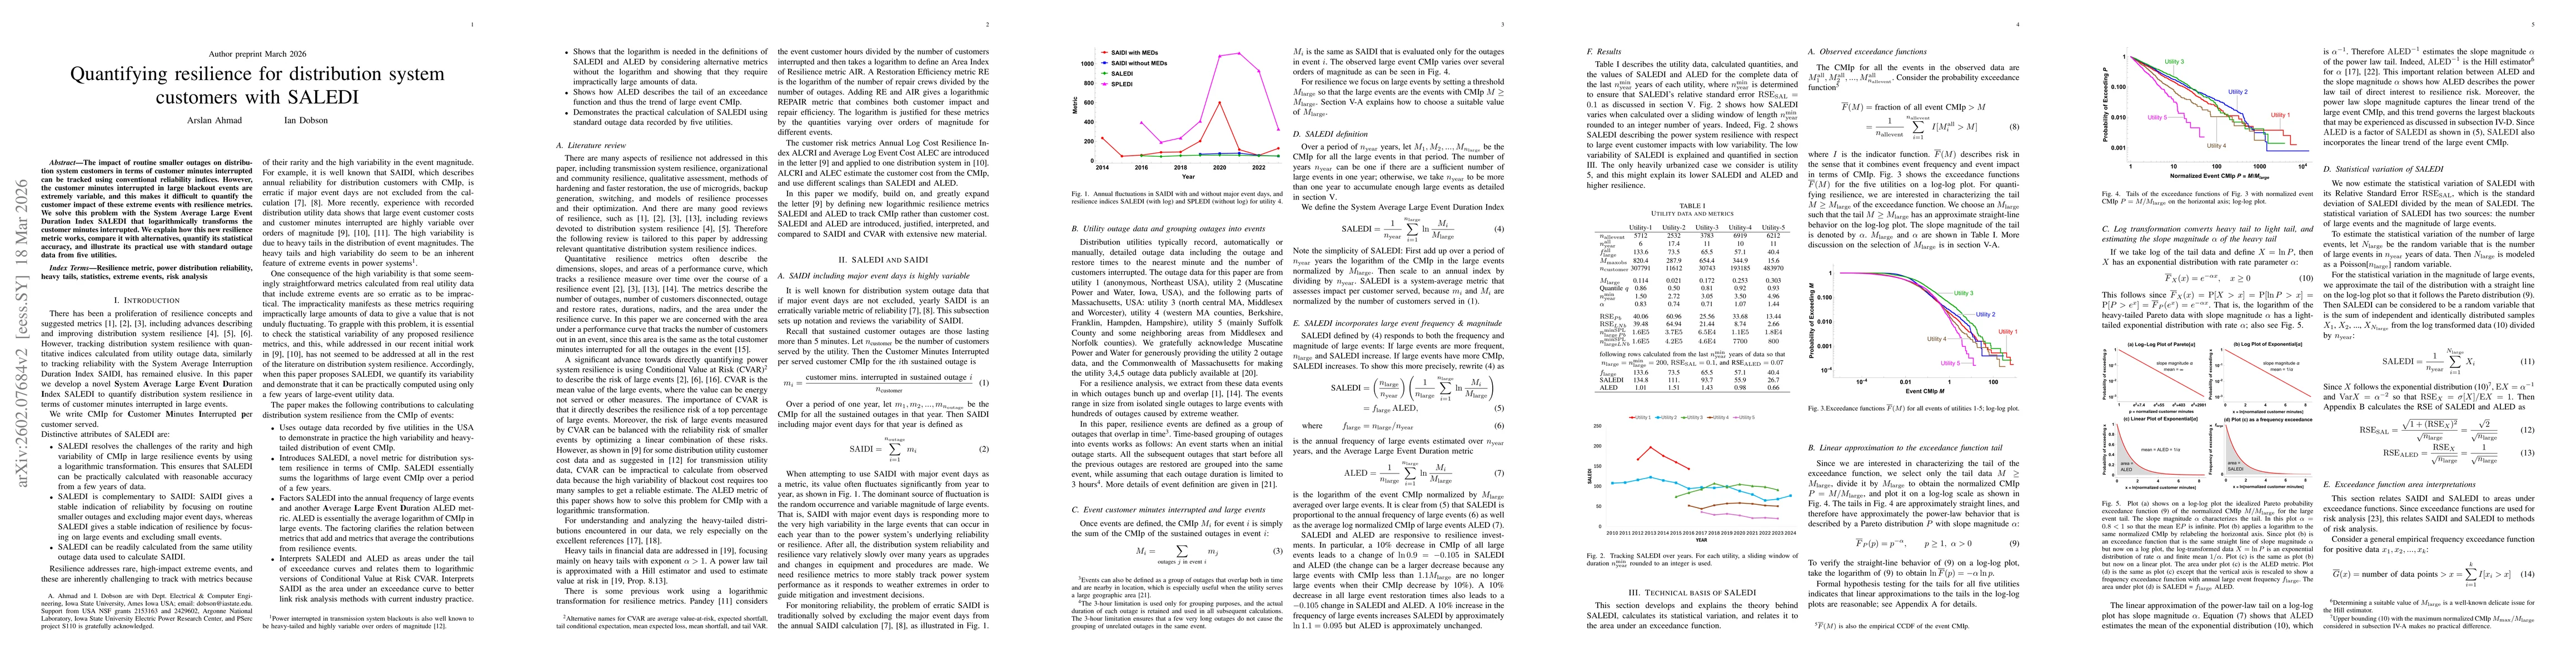
The impact of routine smaller outages on distribution system customers in terms of customer minutes interrupted can be tracked using conventional reliability indices. However, the customer minutes int...
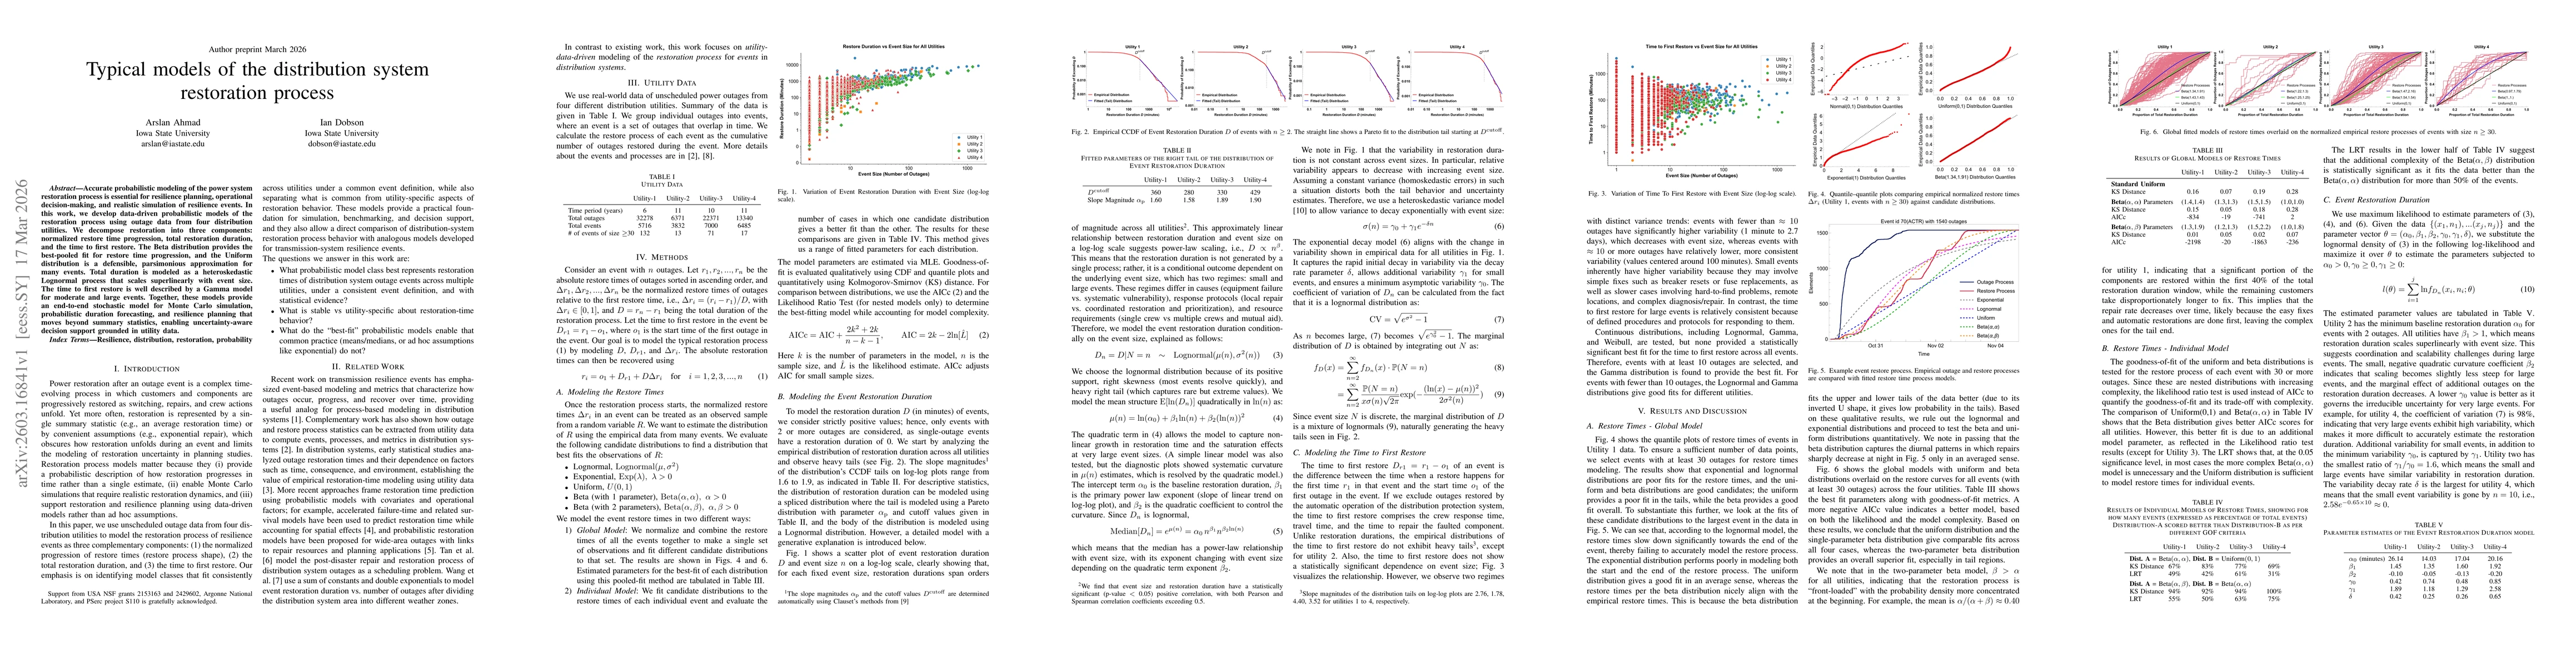
Accurate probabilistic modeling of the power system restoration process is essential for resilience planning, operational decision-making, and realistic simulation of resilience events. In this work, ...
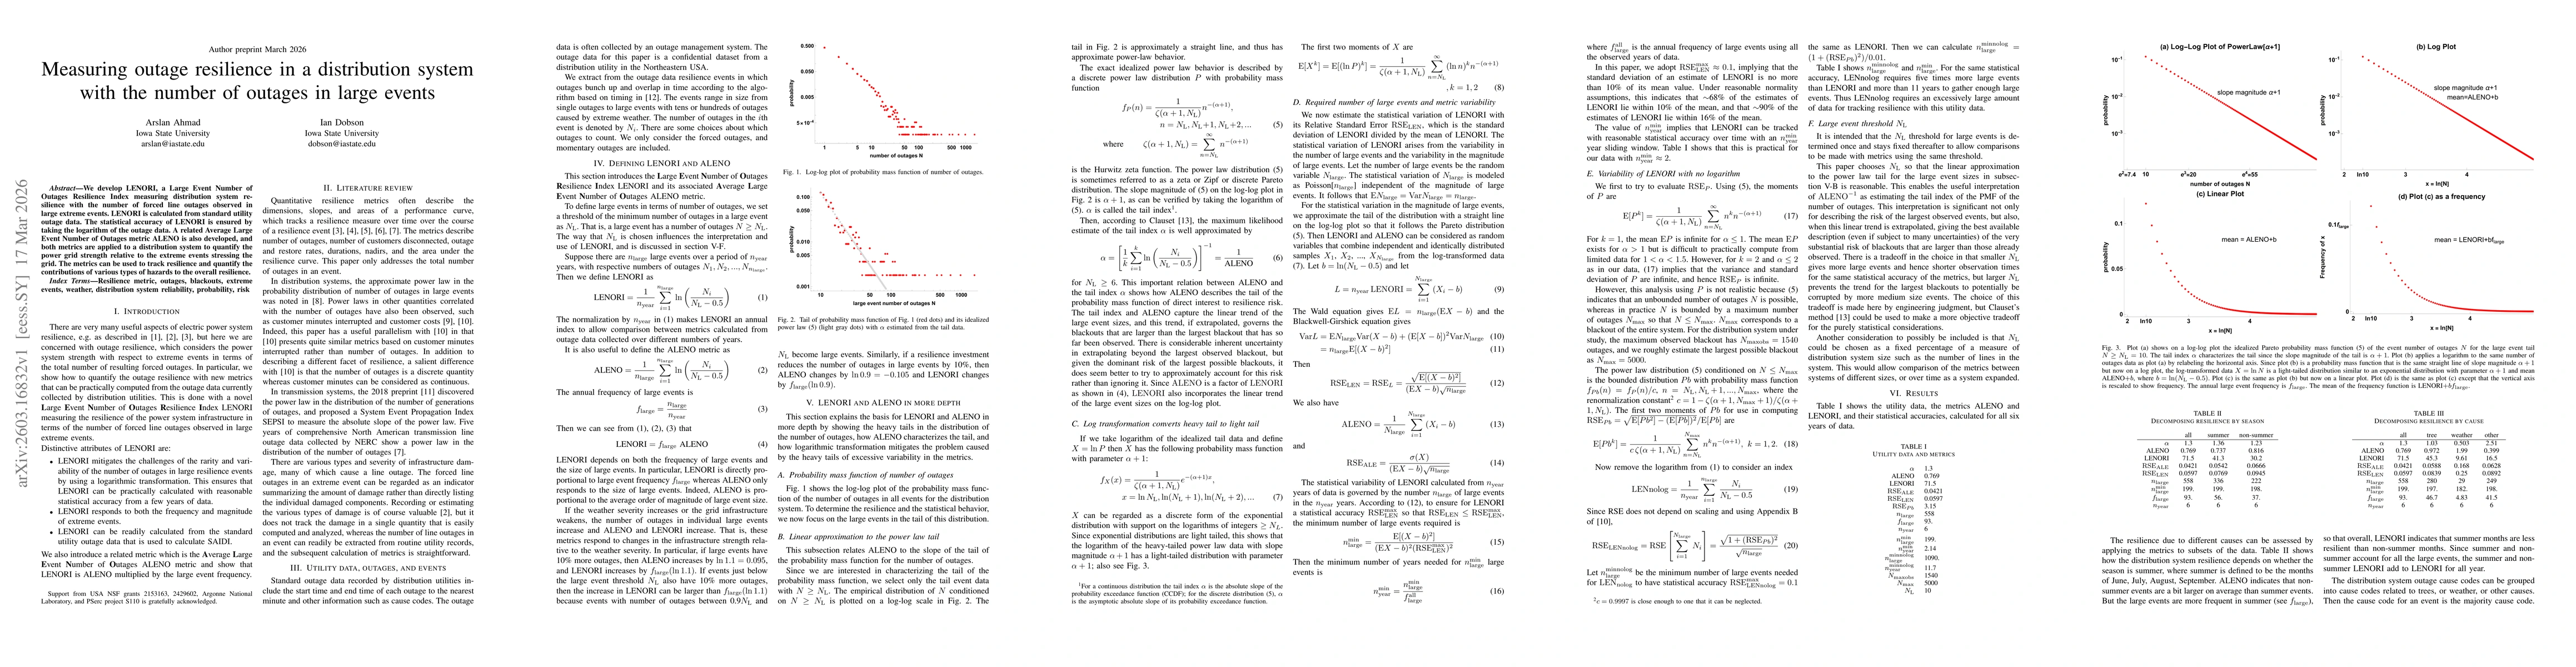
We develop LENORI, a Large Event Number of Outages Resilience Index measuring distribution system resilience with the number of forced line outages observed in large extreme events. LENORI is calculat...
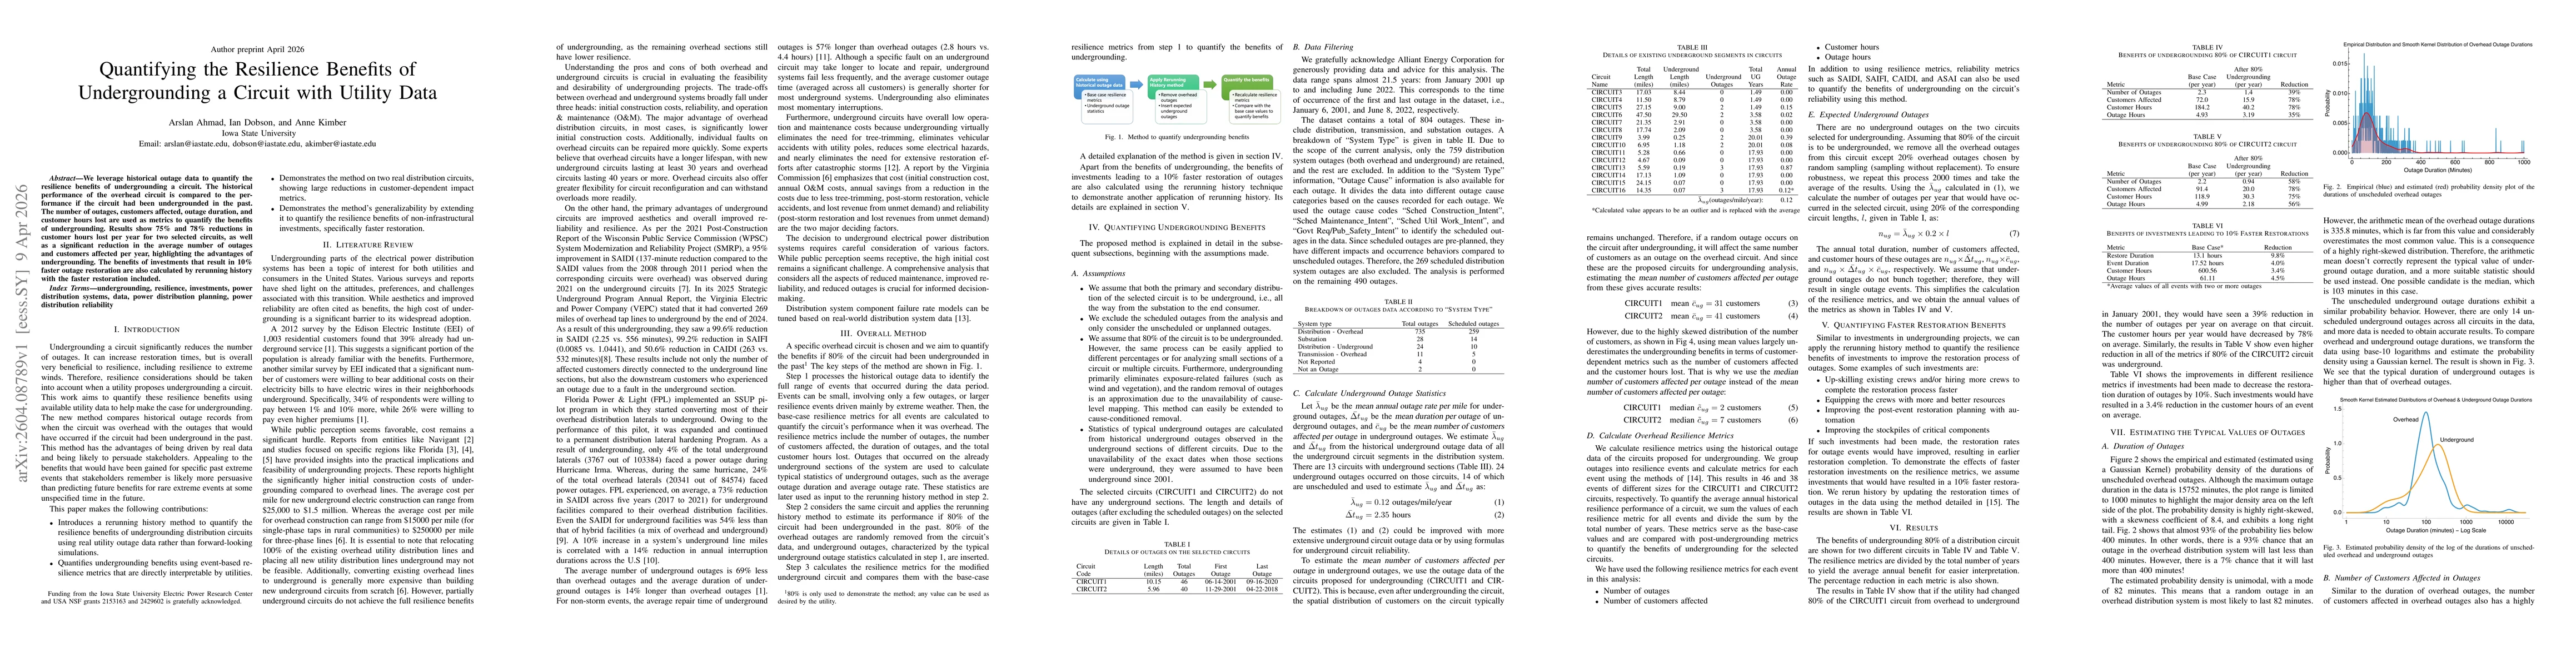
We leverage historical outage data to quantify the resilience benefits of undergrounding a circuit. The historical performance of the overhead circuit is compared to the performance if the circuit had...