A Markovian influence graph formed from utility line outage data to mitigate large cascades
Publication
Metrics
AI Quick Summary
This paper constructs a Markov influence graph from utility line outage data to model cascading outages, generalizing previous models to include multiple line outages. The graph enables analysis of mitigation strategies and identifies critical lines for upgrades to reduce large cascades.
Paper Preview
Abstract
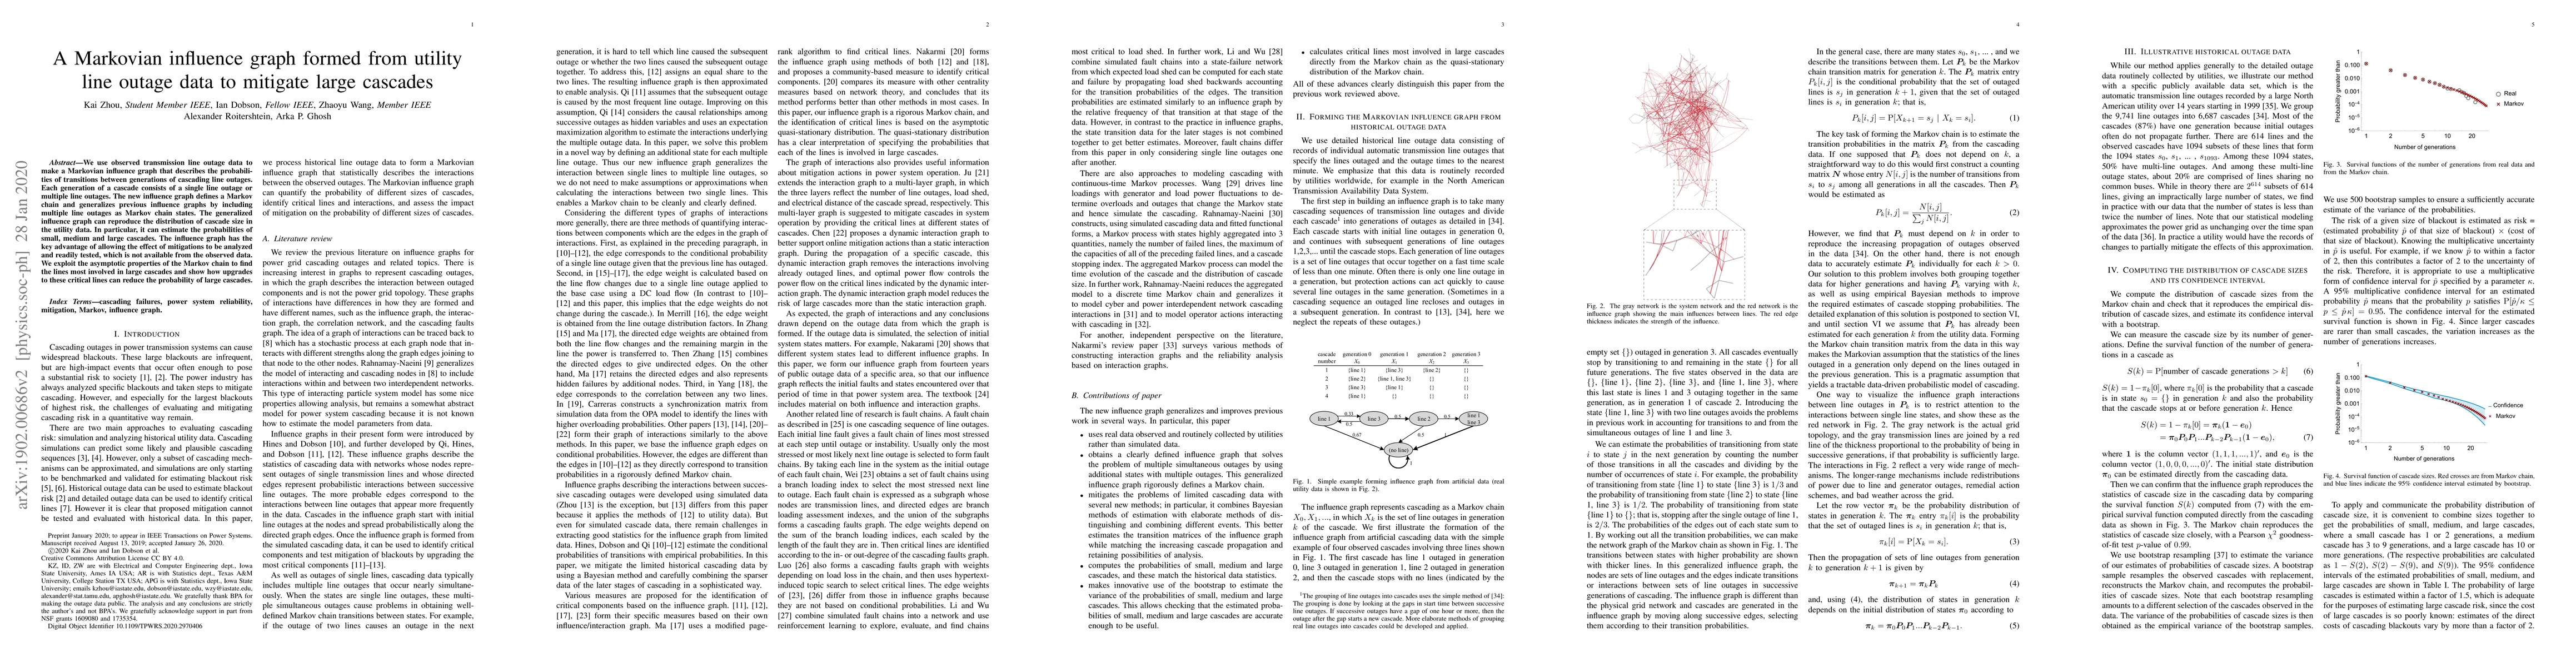
We use observed transmission line outage data to make a Markov influence graph that describes the probabilities of transitions between generations of cascading line outages, where each generation of a cascade consists of a single line outage or multiple line outages. The new influence graph defines a Markov chain and generalizes previous influence graphs by including multiple line outages as Markov chain states. The generalized influence graph can reproduce the distribution of cascade size in the utility data. In particular, it can estimate the probabilities of small, medium and large cascades. The influence graph has the key advantage of allowing the effect of mitigations to be analyzed and readily tested, which is not available from the observed data. We exploit the asymptotic properties of the Markov chain to find the lines most involved in large cascades and show how upgrades to these critical lines can reduce the probability of large cascades.
AI Key Findings
Get AI-generated insights about this paper's methodology, results, significance, and more — seven facets brought into focus.
Impact
Paper Details
Authors
PDF Preview
Key Terms
Citation Network
Current paper (gray), citations (green), references (blue)
Display is limited for performance on very large graphs.
Discussion 0