Academic Profile
Statistics
Similar Authors
Papers on arXiv
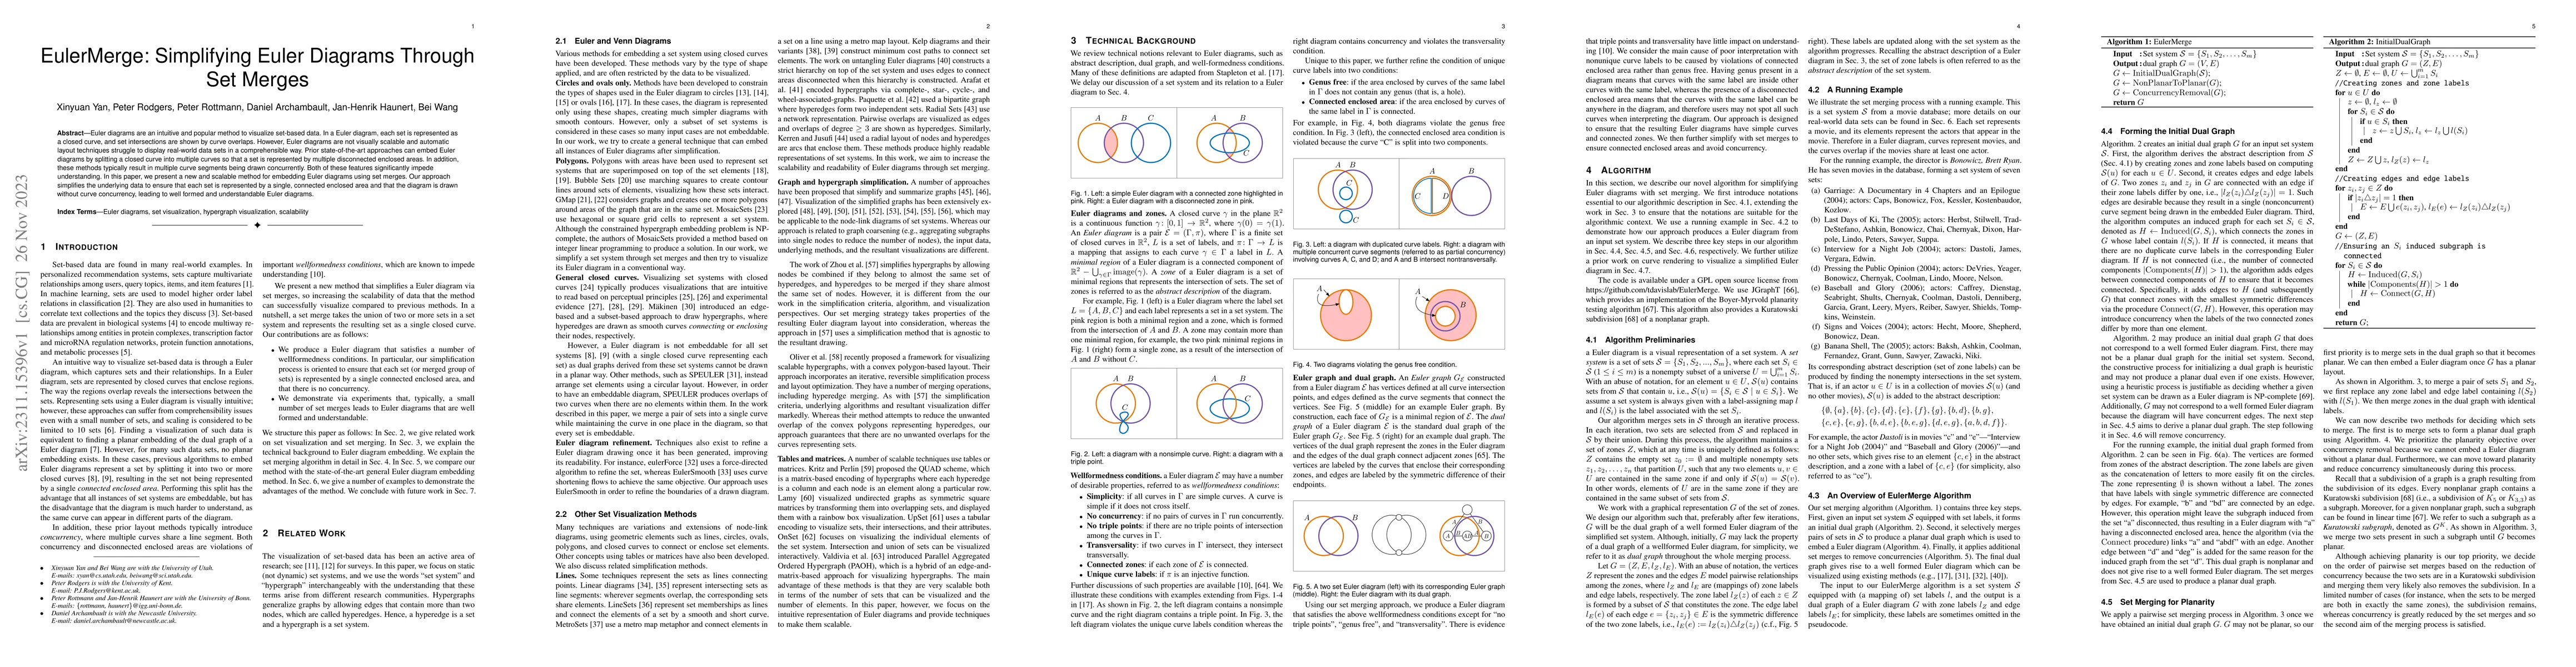
Euler diagrams are an intuitive and popular method to visualize set-based data. In a Euler diagram, each set is represented as a closed curve, and set intersections are shown by curve overlaps. Howe...
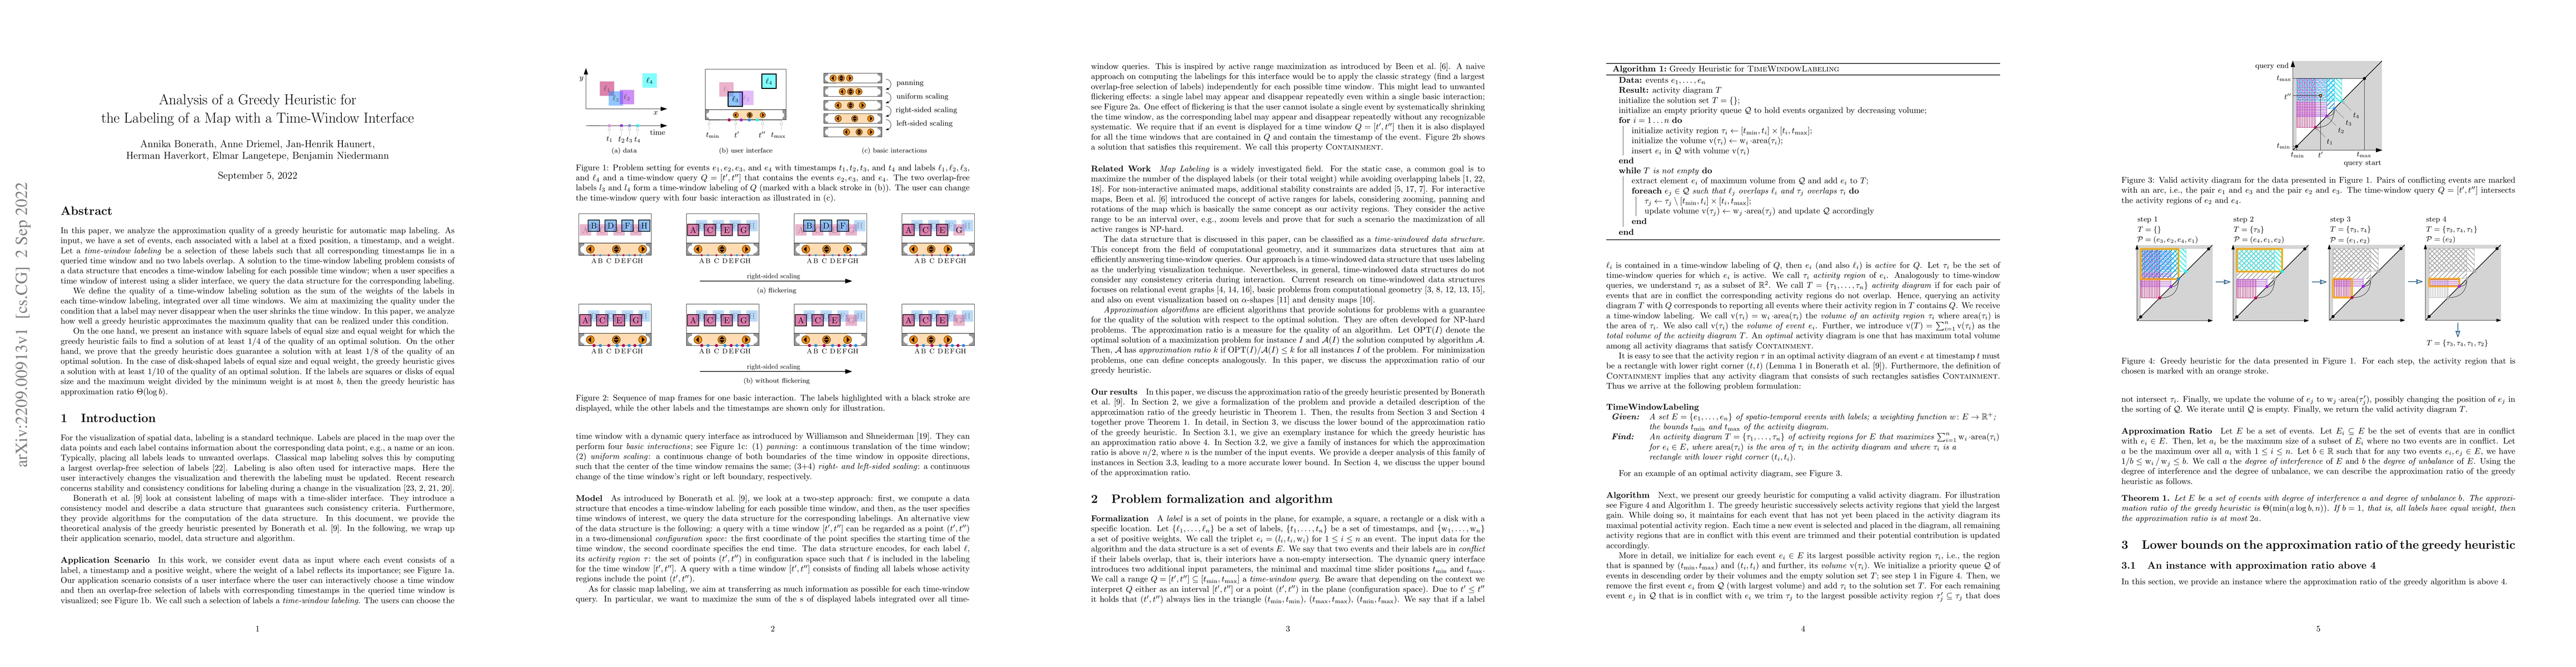
In this paper, we analyze the approximation quality of a greedy heuristic for automatic map labeling. As input, we have a set of events, each associated with a label at a fixed position, a timestamp...
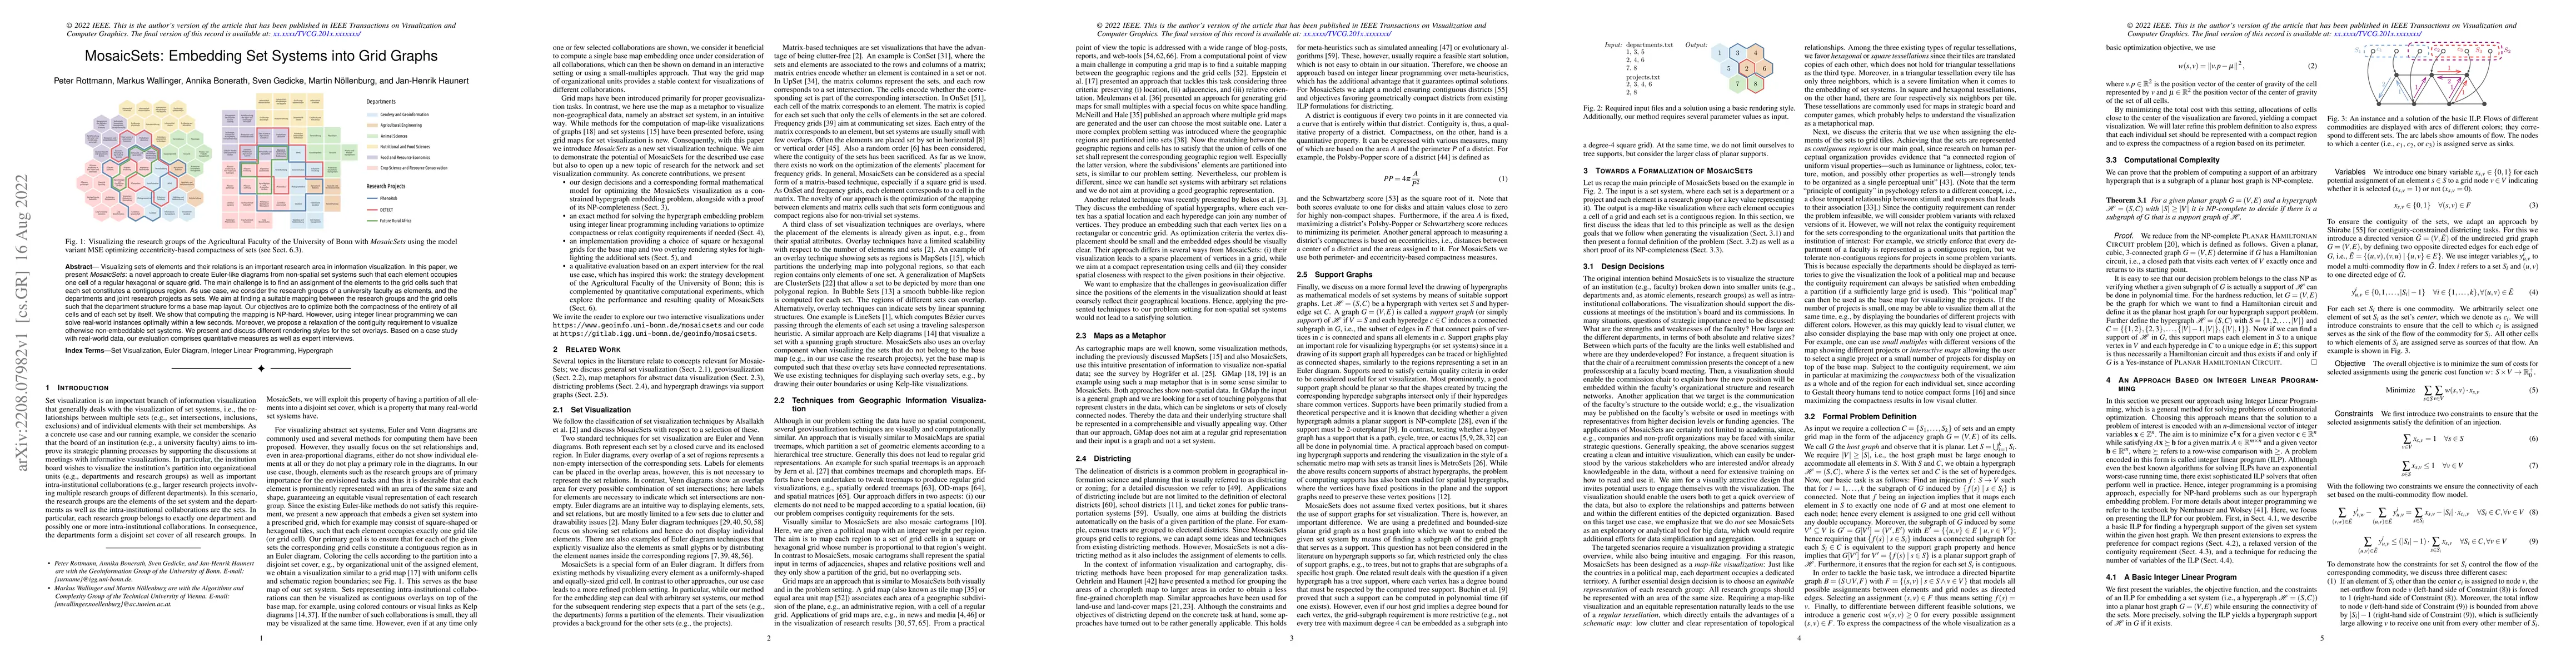
Visualizing sets of elements and their relations is an important research area in information visualization. In this paper, we present MosaicSets: a novel approach to create Euler-like diagrams from...
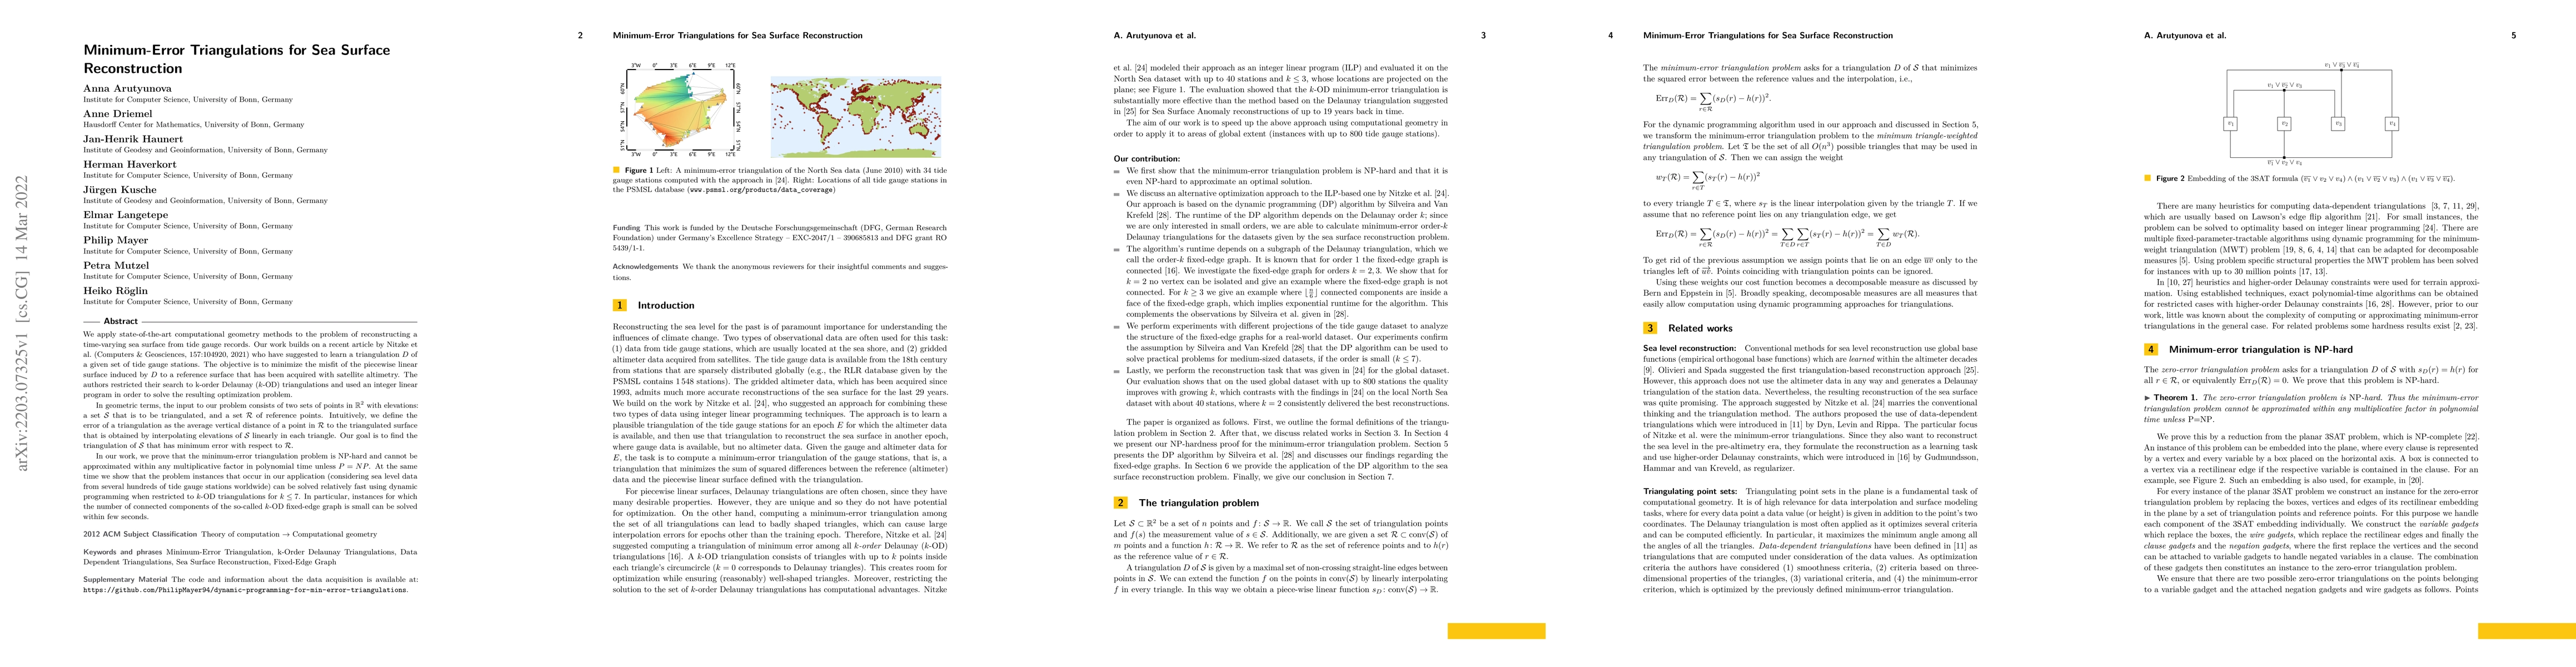
We apply state-of-the-art computational geometry methods to the problem of reconstructing a time-varying sea surface from tide gauge records. Our work builds on a recent article by Nitzke et al.~(Co...
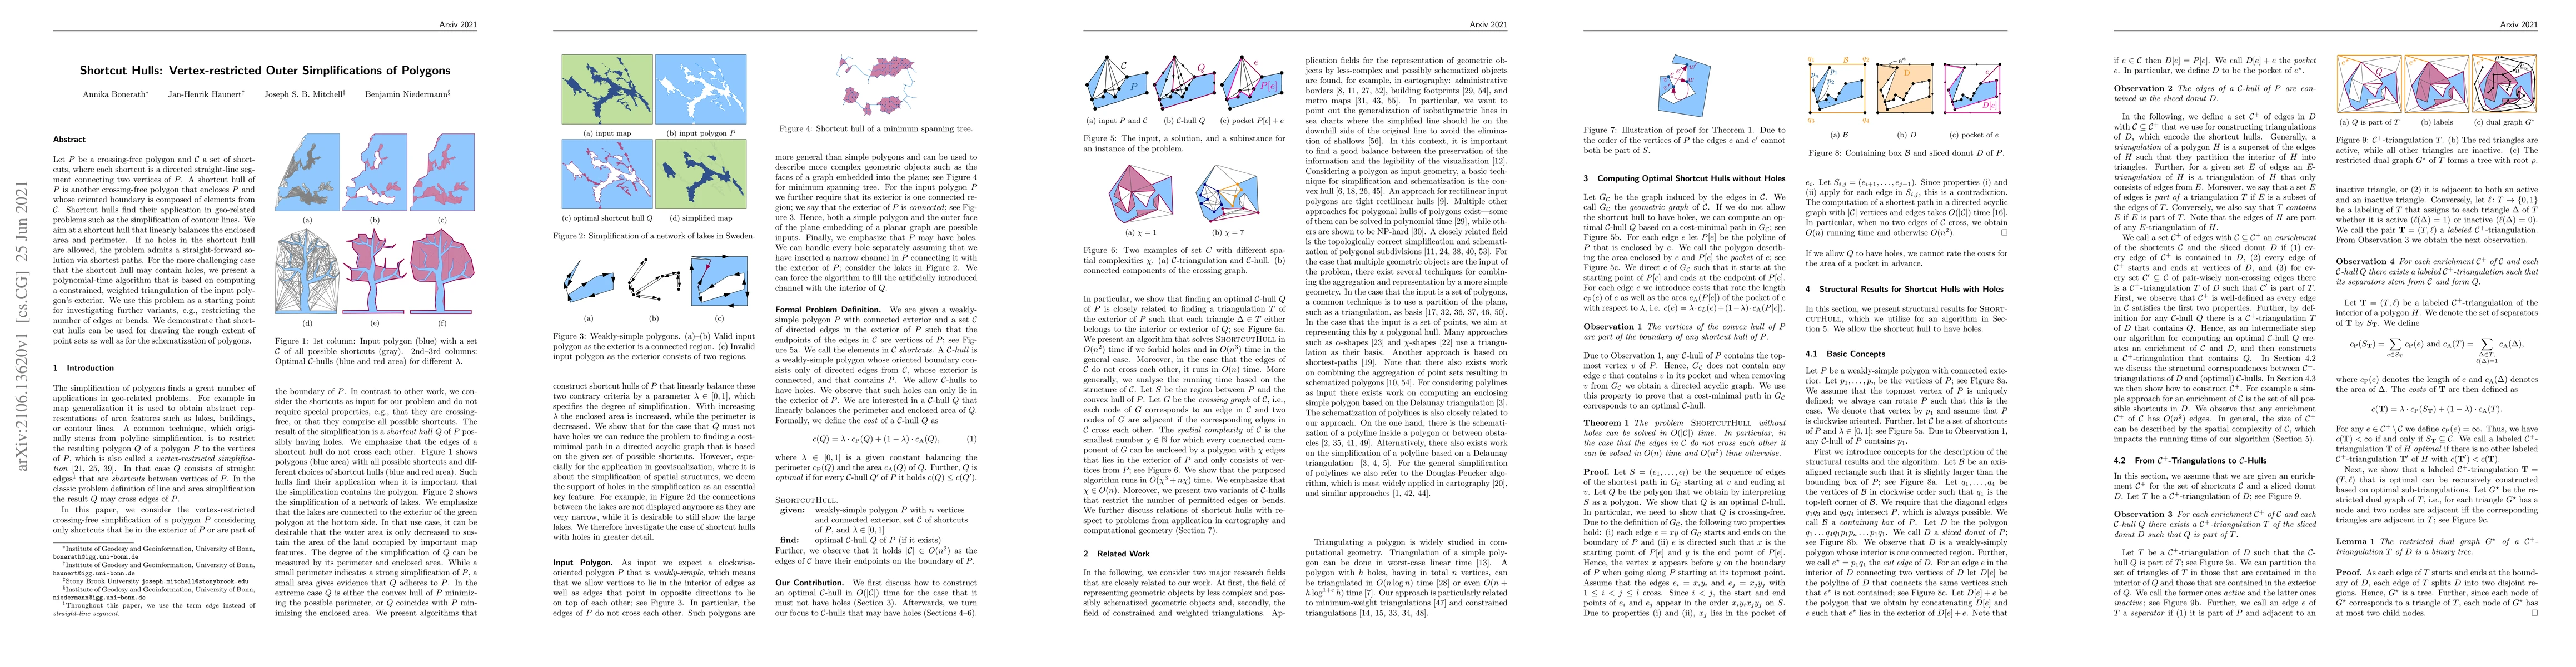
Let $P$ be a crossing-free polygon and $\mathcal C$ a set of shortcuts, where each shortcut is a directed straight-line segment connecting two vertices of $P$. A shortcut hull of $P$ is another cros...
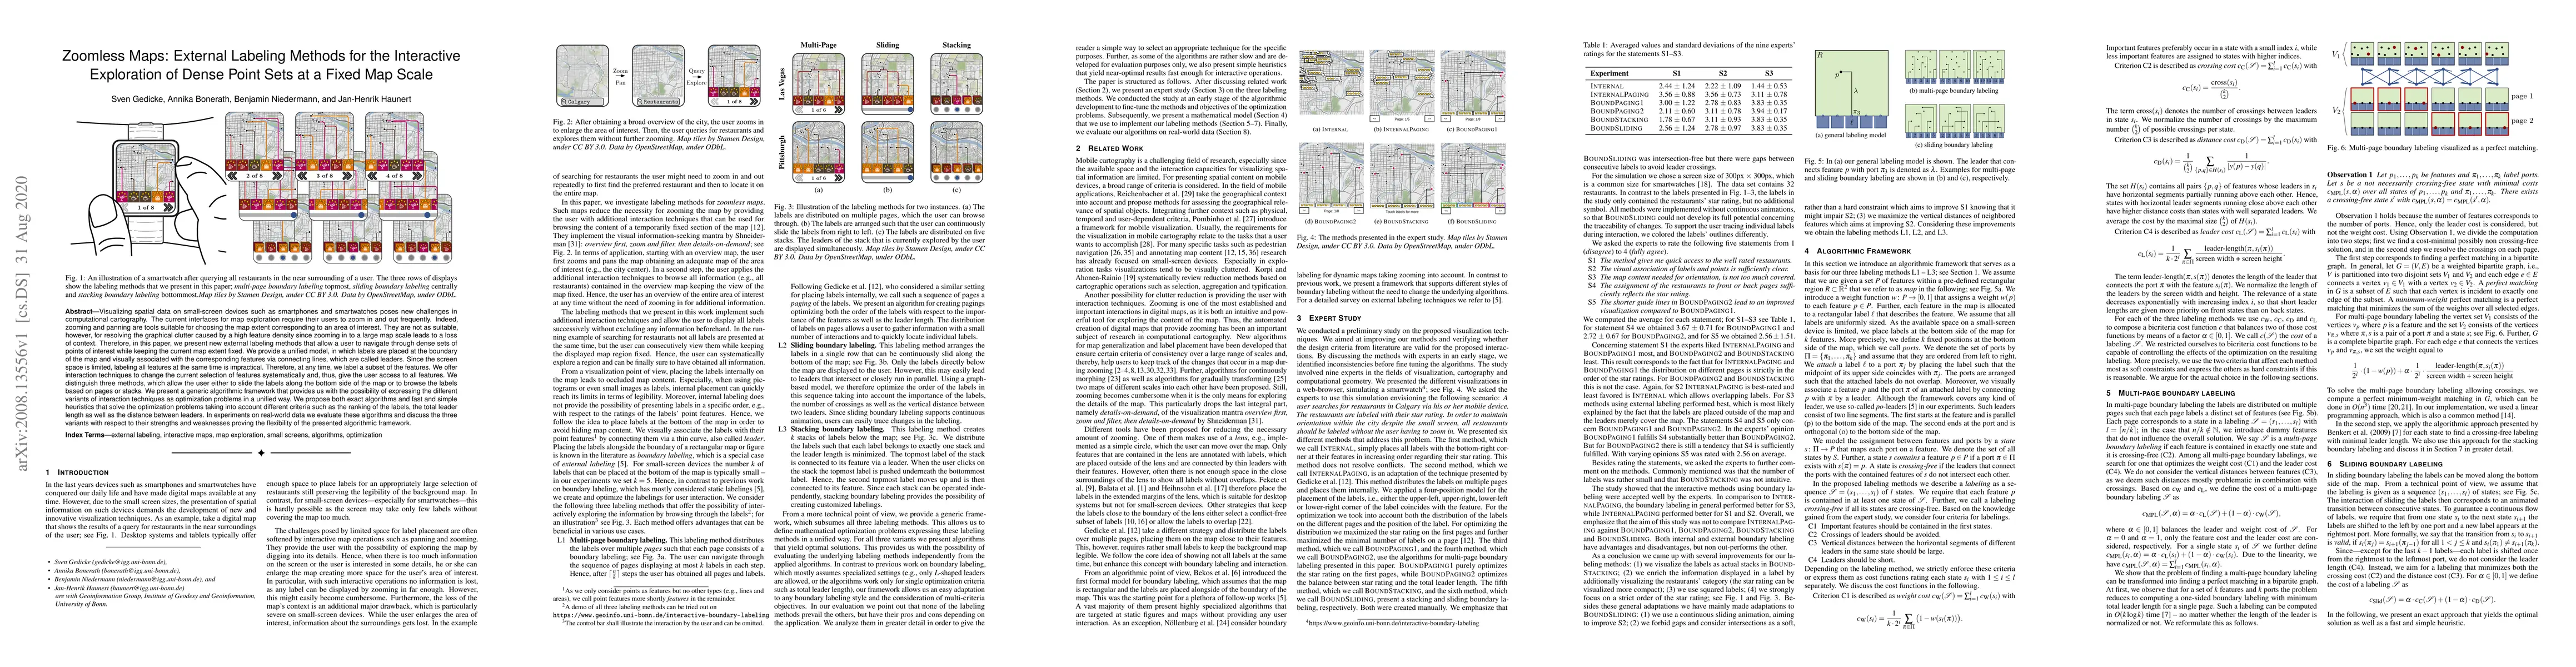
Visualizing spatial data on small-screen devices such as smartphones and smartwatches poses new challenges in computational cartography. The current interfaces for map exploration require their user...
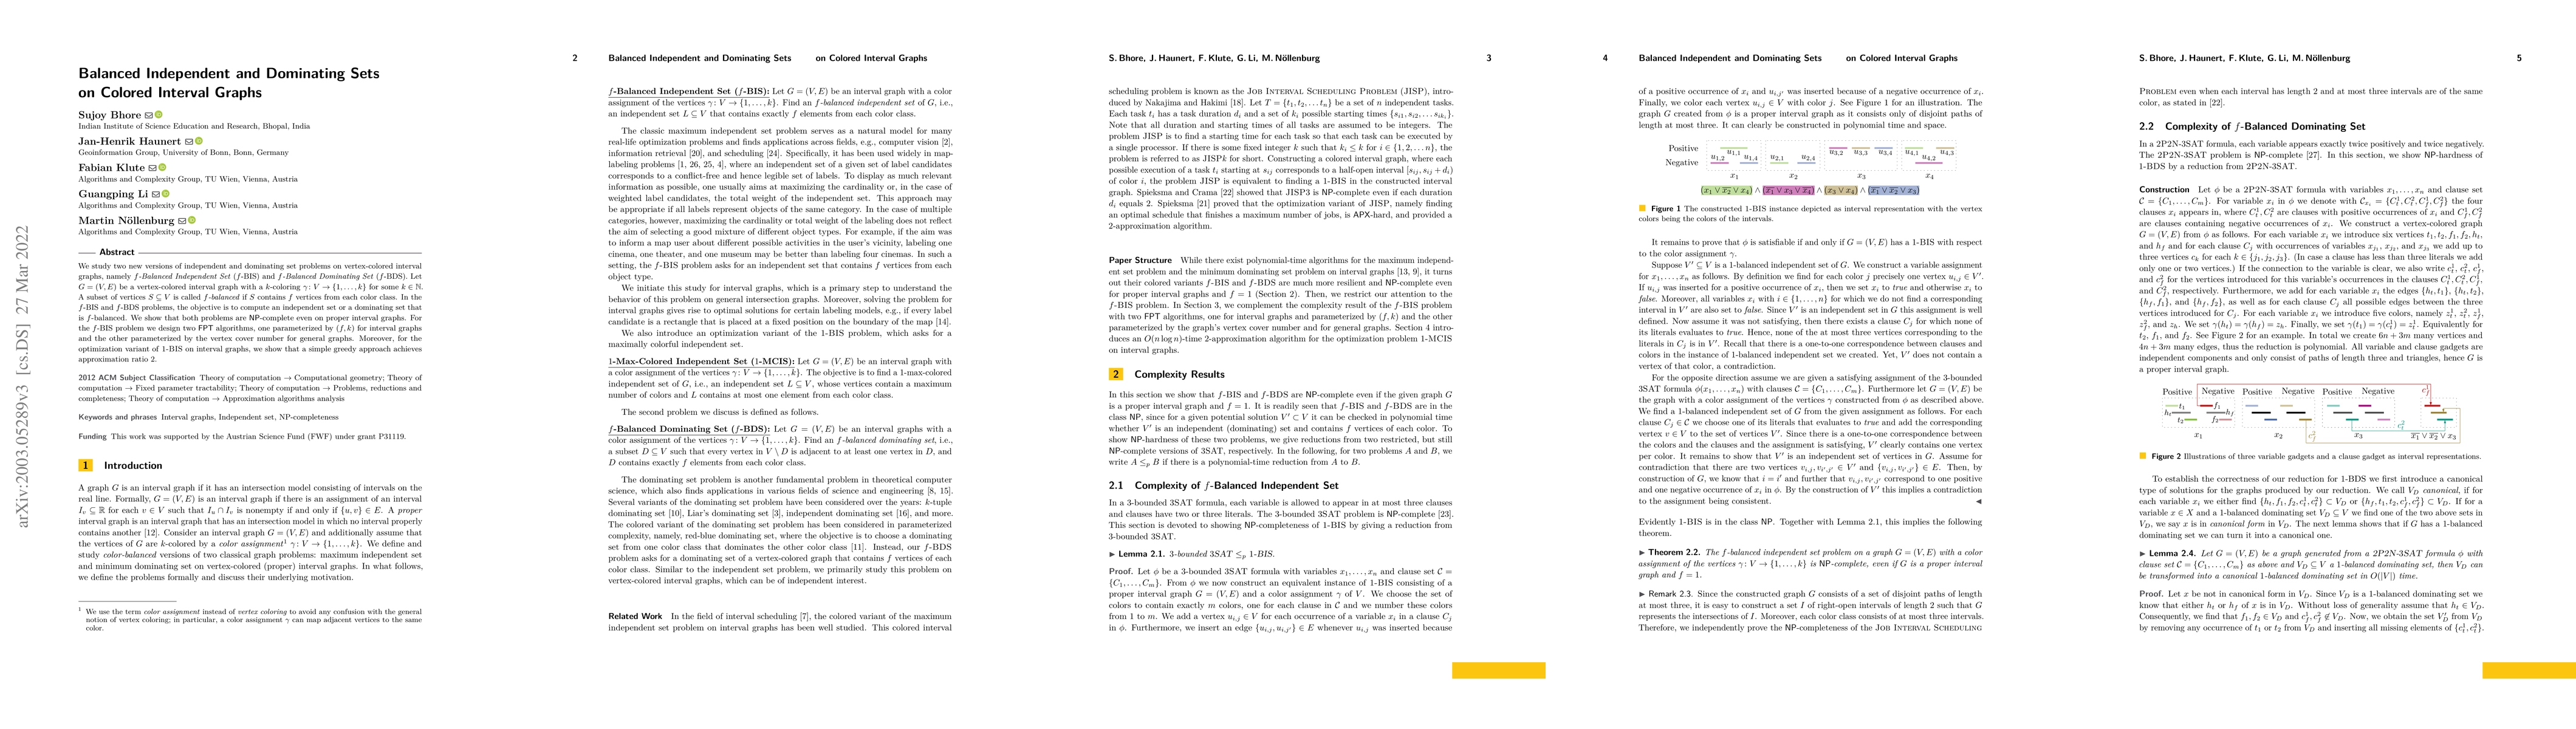
We study two new versions of independent and dominating set problems on vertex-colored interval graphs, namely $f$-Balanced Independent Set ($f$-BIS) and $f$-Balanced Dominating Set ($f$-BDS). Let $...
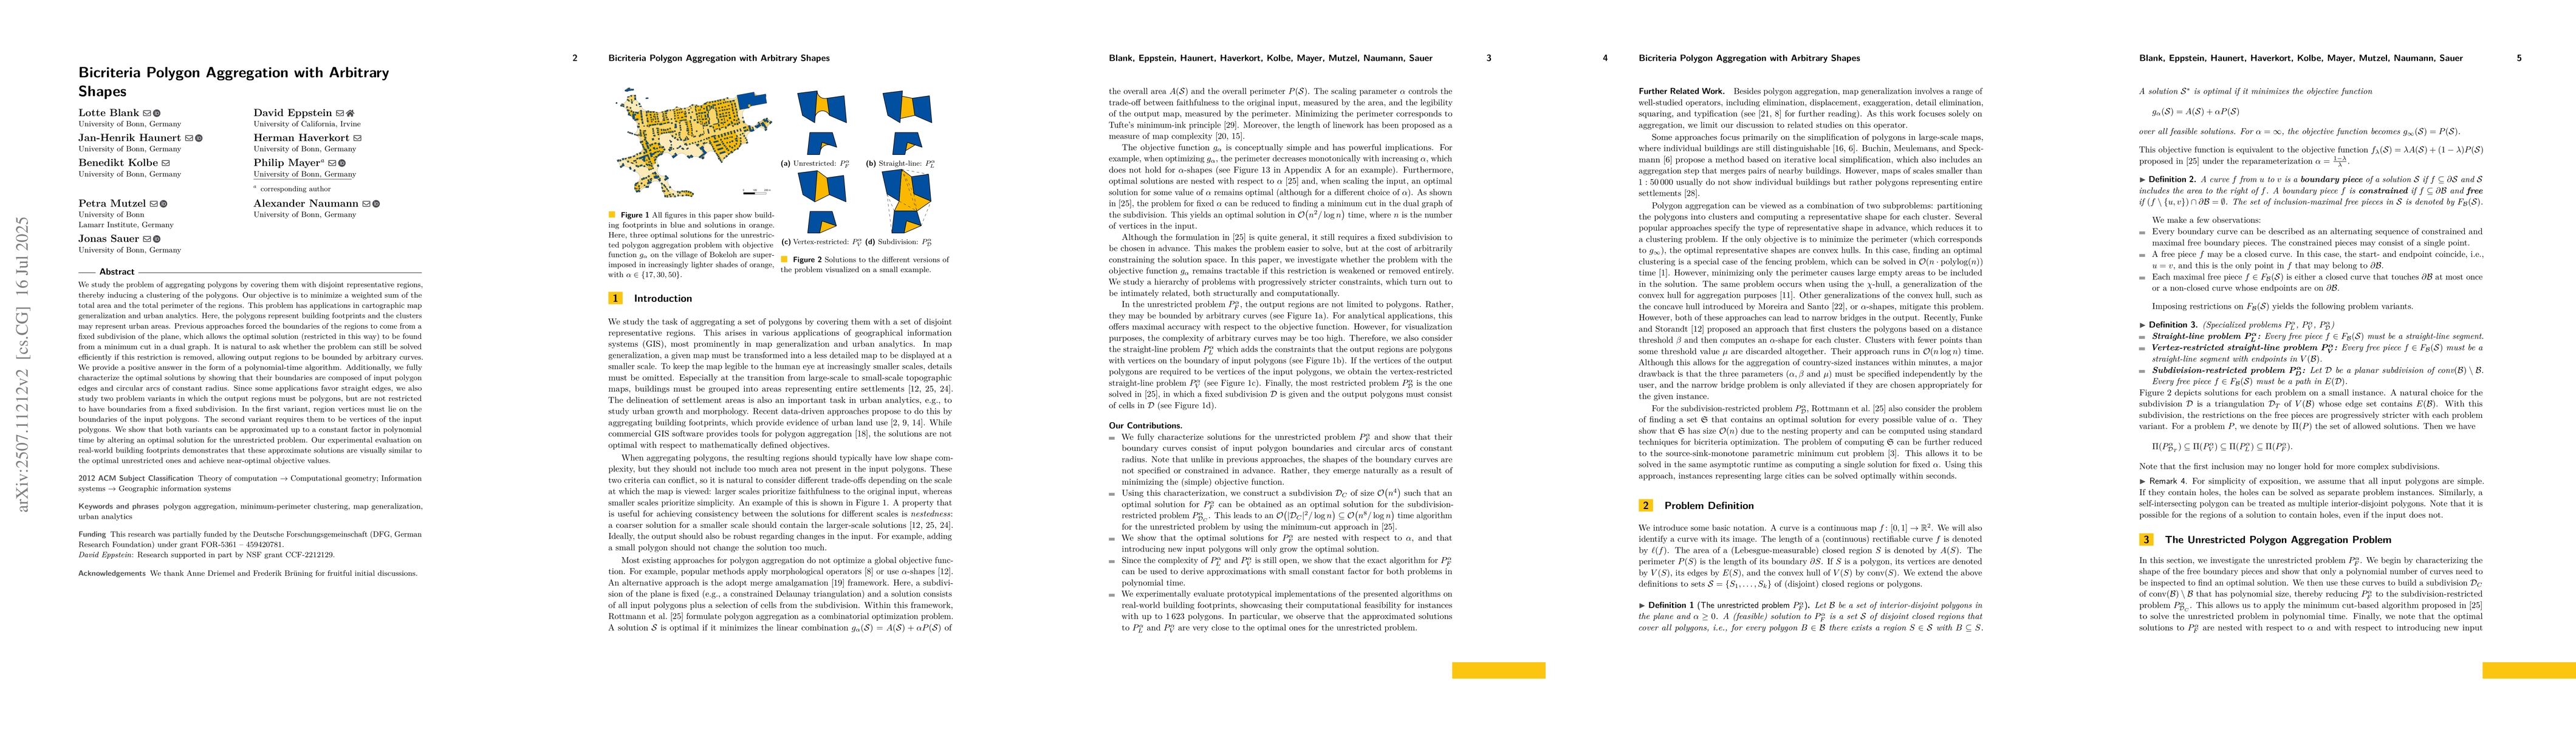
We study the problem of aggregating polygons by covering them with disjoint representative regions, thereby inducing a clustering of the polygons. Our objective is to minimize a weighted sum of the to...
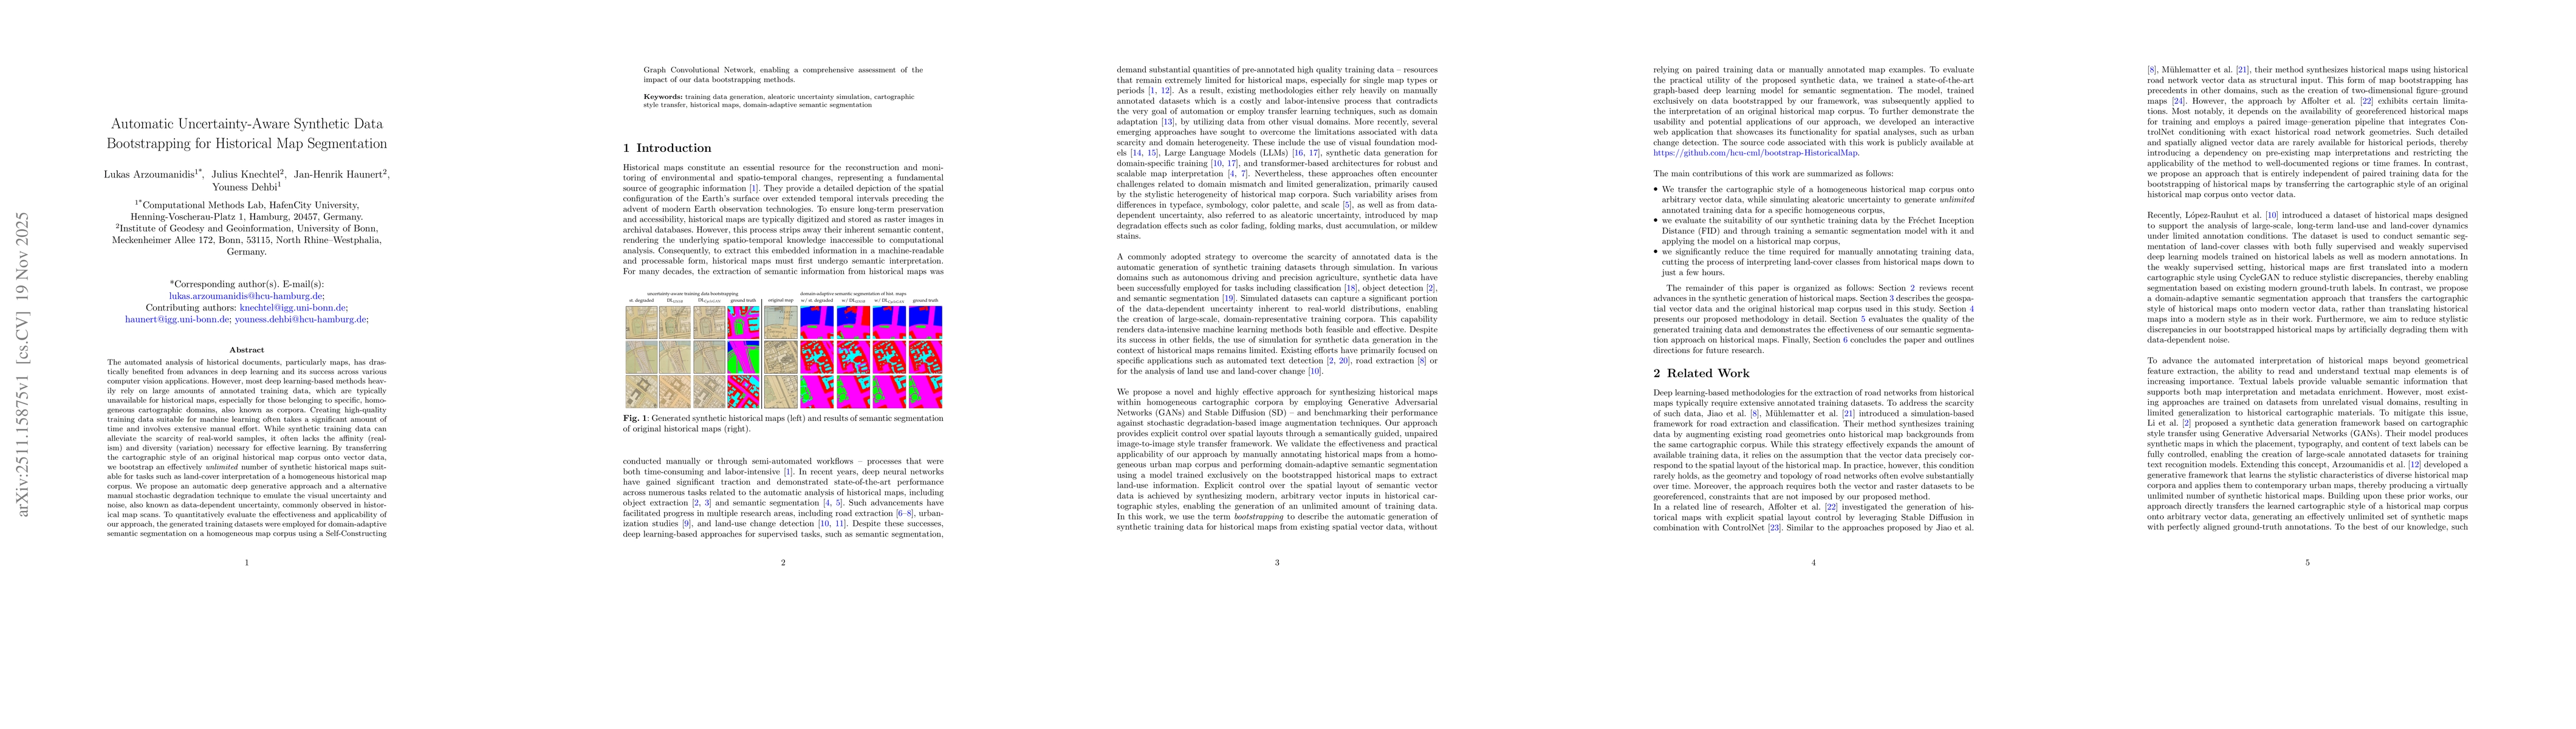
The automated analysis of historical documents, particularly maps, has drastically benefited from advances in deep learning and its success across various computer vision applications. However, most d...