01
MethodologyHow they did it
The research methodology used was a combination of literature review and experimental design.
MosaicSets presents a novel method for embedding set systems into grid graphs to create Euler-like diagrams, optimizing both overall and individual set compactness. Despite the NP-hardness of the problem, optimal solutions are achievable via integer linear programming, and a relaxation technique allows visualization of non-embeddable set systems.
MosaicSets presents a novel method for embedding set systems into grid graphs to create Euler-like diagrams, optimizing both overall and individual set compactness. Despite the NP-hardness of the problem, optimal solutions are achievable via integer linear programming, and a relaxation technique allows visualization of non-embeddable set systems.
The research methodology used was a combination of literature review and experimental design. More in Methodology →
Main finding 1: The use of Mosaic Sets resulted in improved visualization of agricultural data. — Main finding 2: The Kelp style visualization method showed better compactness scores than the boundry style. More in Key Results →
This research is important because it contributes to the development of new methods for visualizing and analyzing large datasets in agriculture. More in Significance →
Limitation 1: The sample size was limited, which may affect the generalizability of the results. — Limitation 2: The data used in this study were not representative of all agricultural data. More in Limitations →
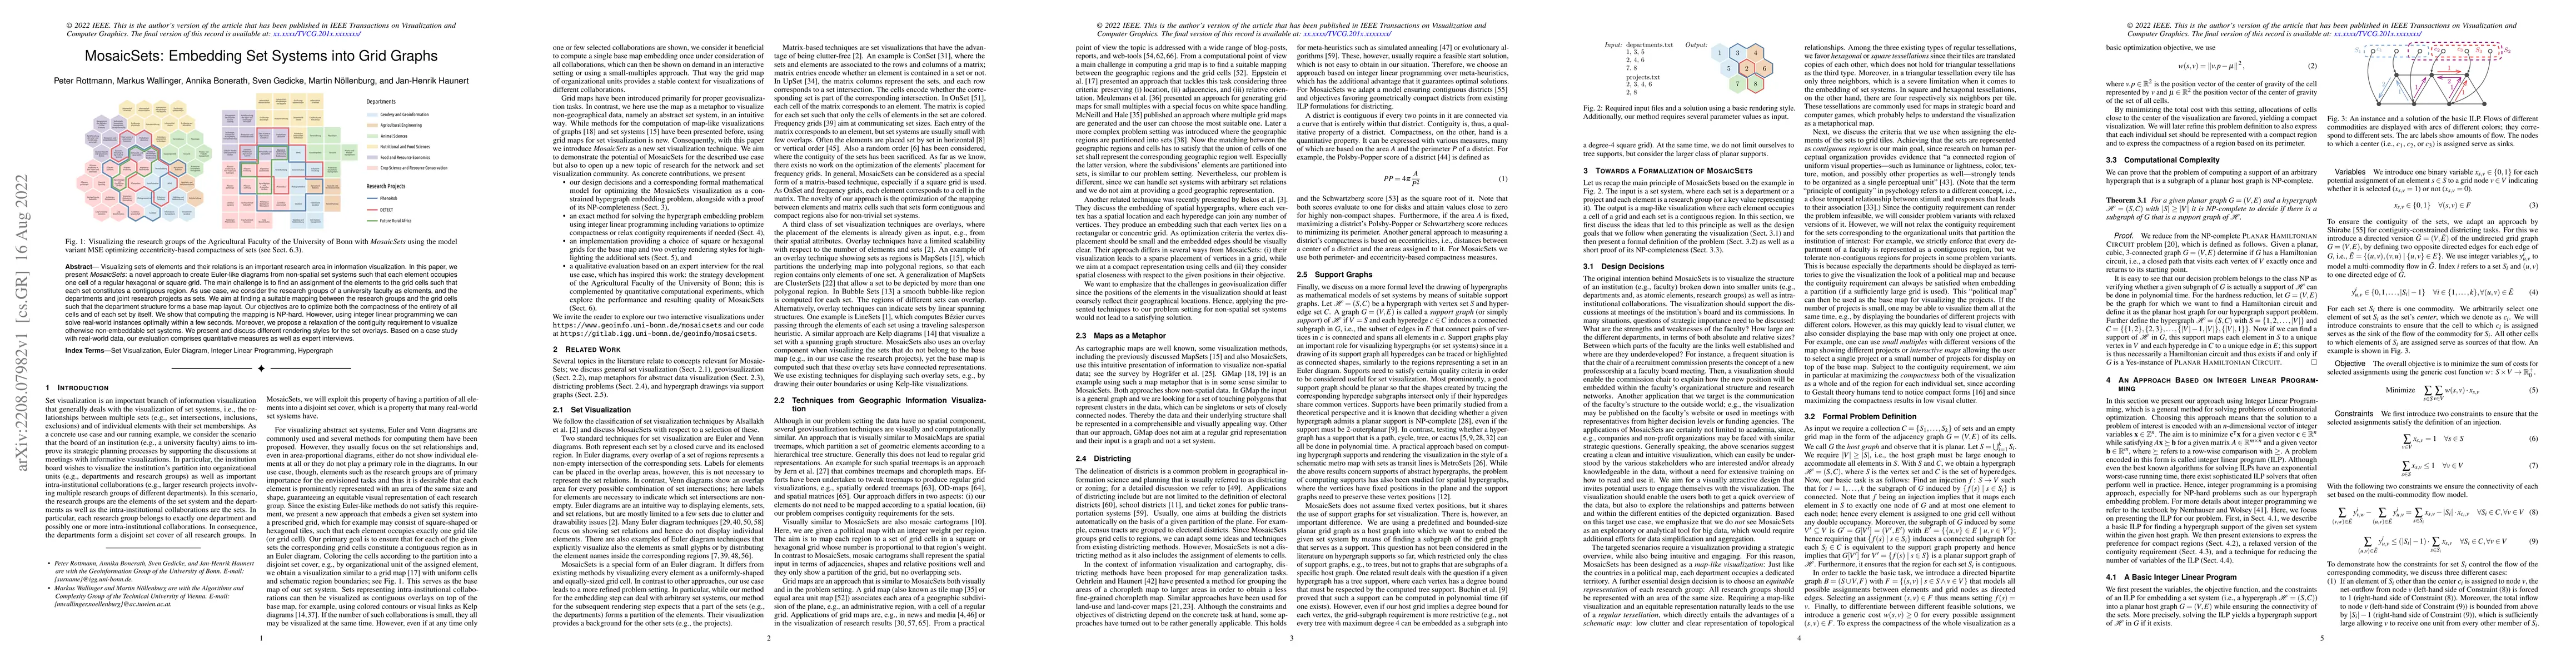
Visualizing sets of elements and their relations is an important research area in information visualization. In this paper, we present MosaicSets: a novel approach to create Euler-like diagrams from non-spatial set systems such that each element occupies one cell of a regular hexagonal or square grid. The main challenge is to find an assignment of the elements to the grid cells such that each set constitutes a contiguous region. As use case, we consider the research groups of a university faculty as elements, and the departments and joint research projects as sets. We aim at finding a suitable mapping between the research groups and the grid cells such that the department structure forms a base map layout. Our objectives are to optimize both the compactness of the entirety of all cells and of each set by itself. We show that computing the mapping is NP-hard. However, using integer linear programming we can solve real-world instances optimally within a few seconds. Moreover, we propose a relaxation of the contiguity requirement to visualize otherwise non-embeddable set systems. We present and discuss different rendering styles for the set overlays. Based on a case study with real-world data, our evaluation comprises quantitative measures as well as expert interviews.
Seven facets of this paper, analysed and brought into focus by AI.
This research is important because it contributes to the development of new methods for visualizing and analyzing large datasets in agriculture.
The research methodology used was a combination of literature review and experimental design.
This research is important because it contributes to the development of new methods for visualizing and analyzing large datasets in agriculture.
The development and implementation of a new visualization method for large datasets in agriculture.
Mosaic Sets is a novel approach to visualizing agricultural data, offering improved compactness scores and efficiency in data analysis.
Current paper (gray), citations (green), references (blue)
Display is limited for performance on very large graphs.
Discussion 0