Academic Profile
Statistics
Similar Authors
Papers on arXiv
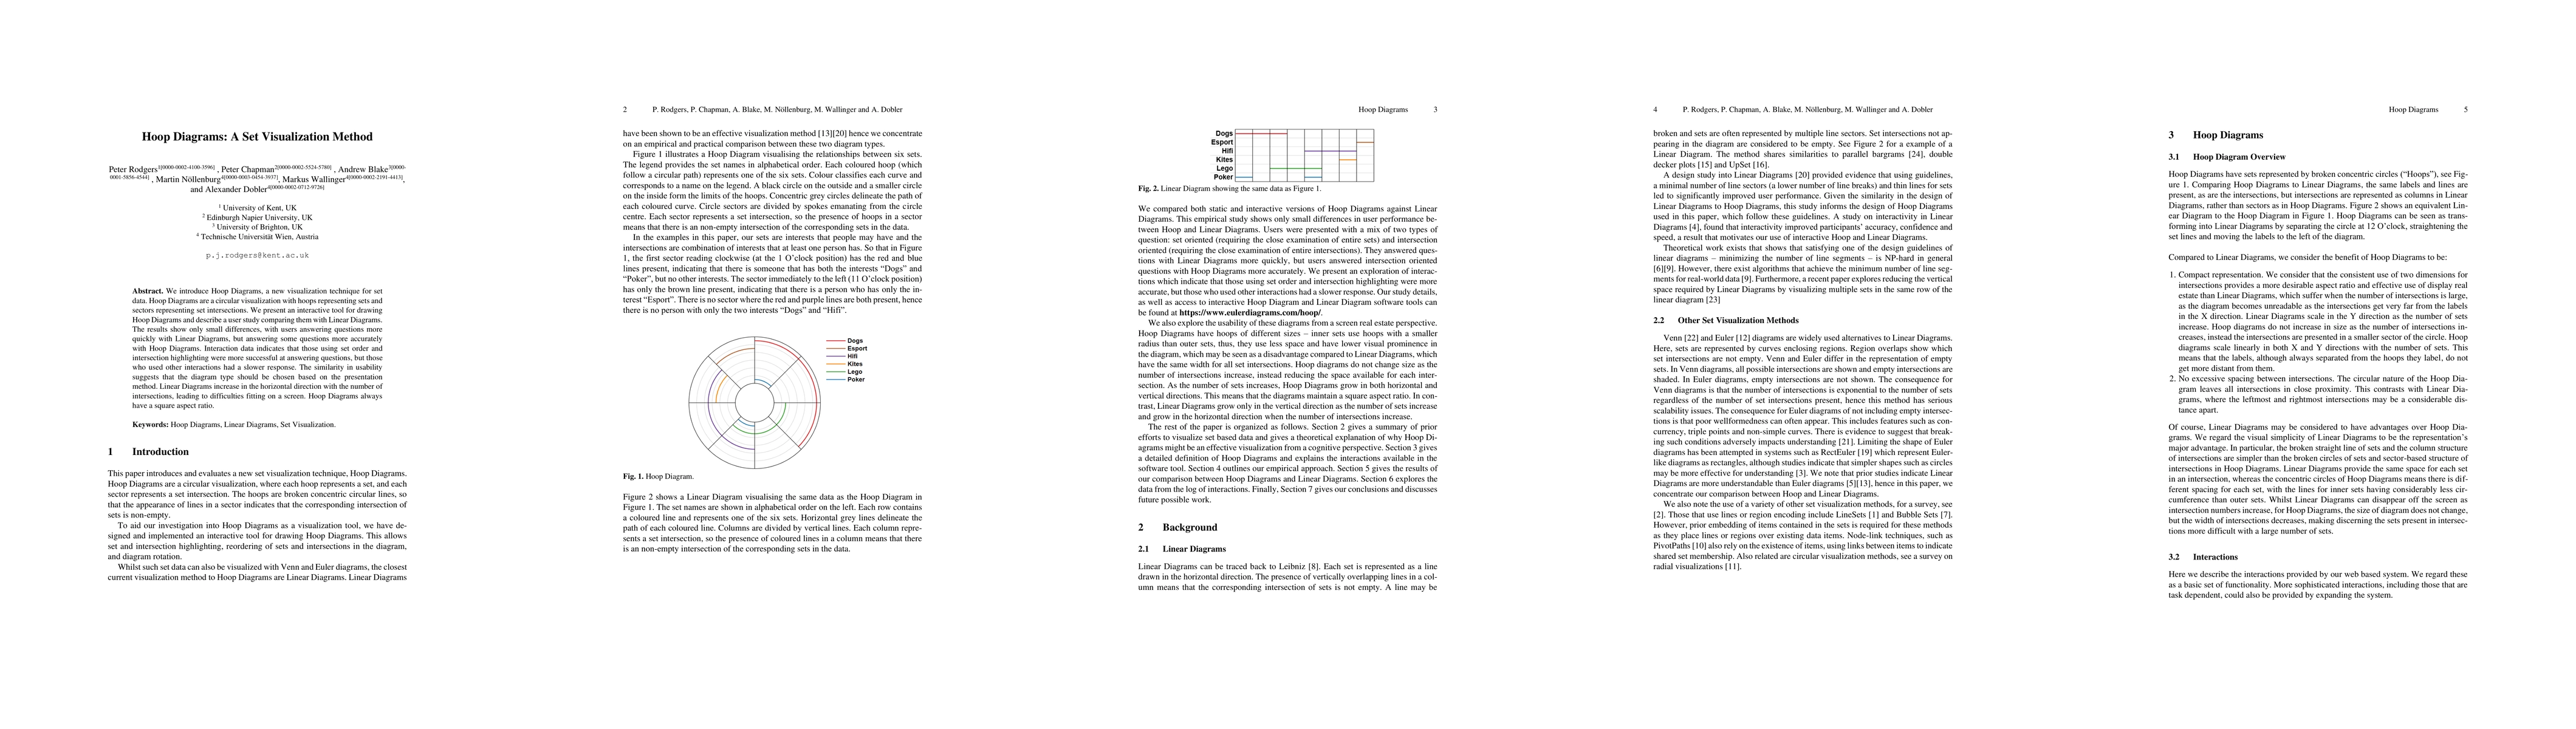
We introduce Hoop Diagrams, a new visualization technique for set data. Hoop Diagrams are a circular visualization with hoops representing sets and sectors representing set intersections. We present...
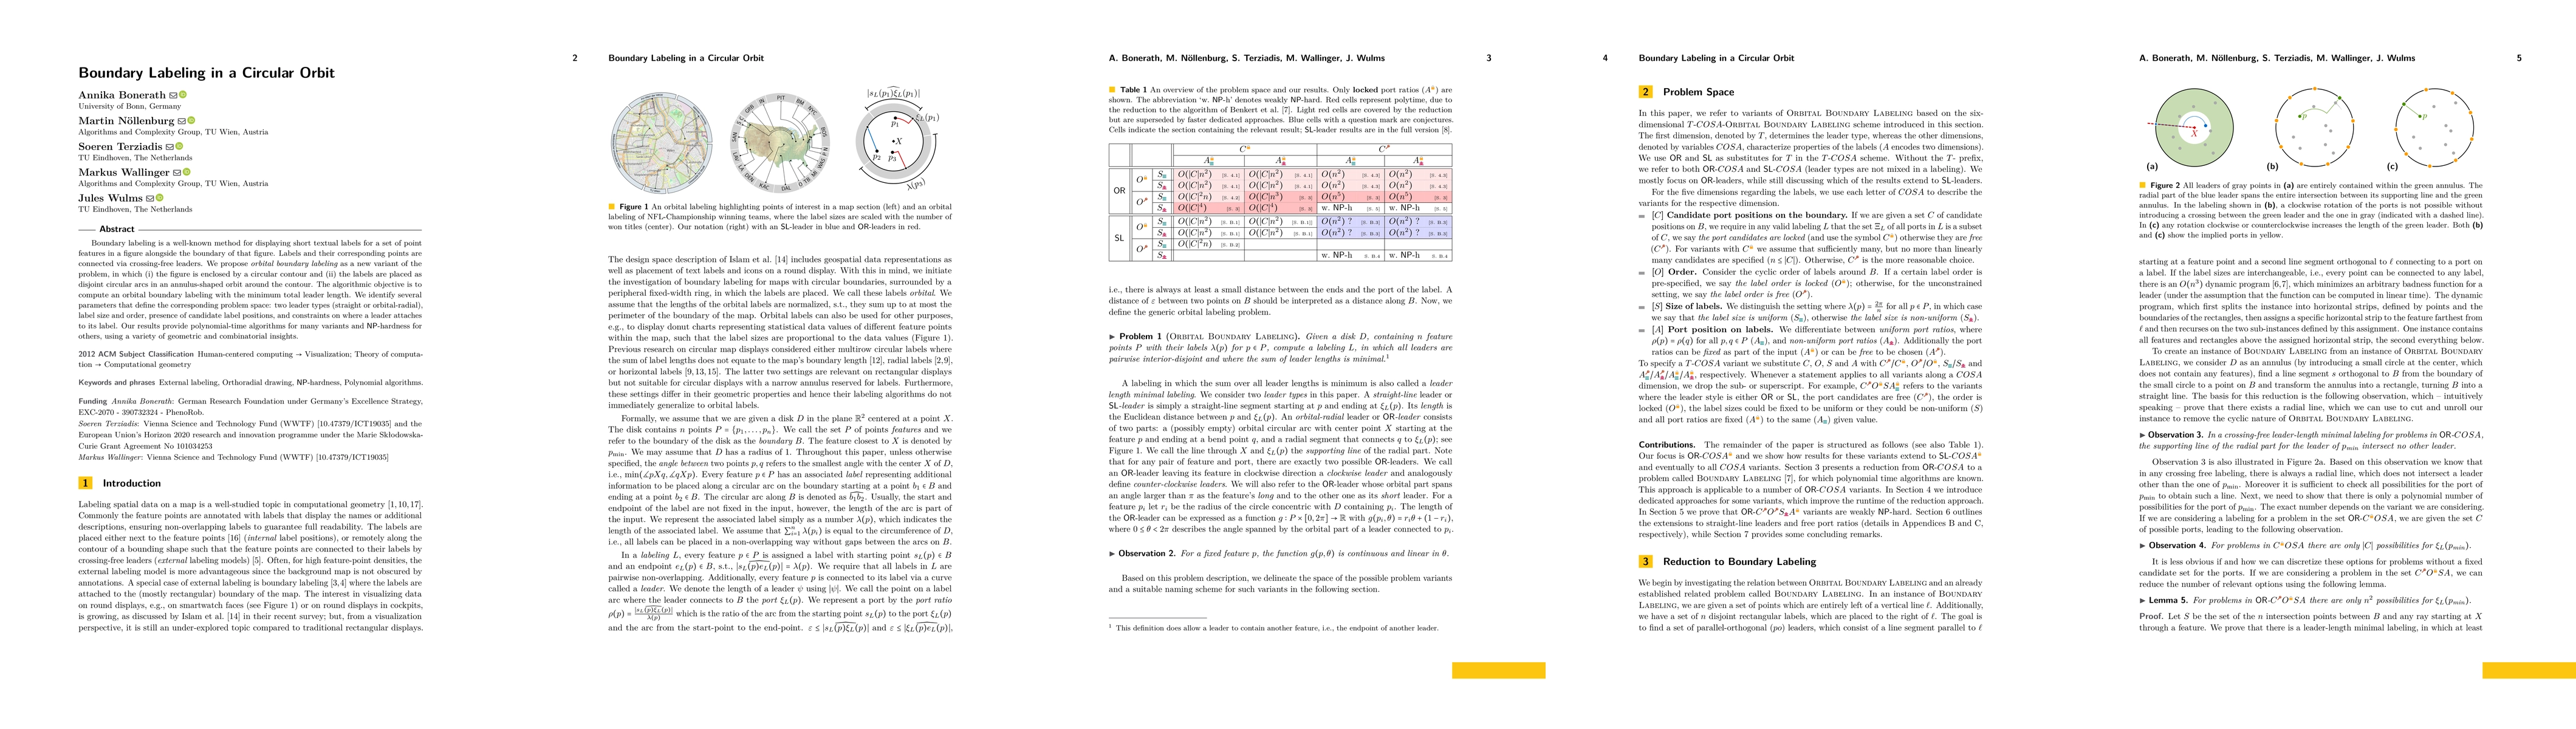
Schematic depictions in text books and maps often need to label specific point features with a text label. We investigate one variant of such a labeling, where the image contour is a circle and the ...
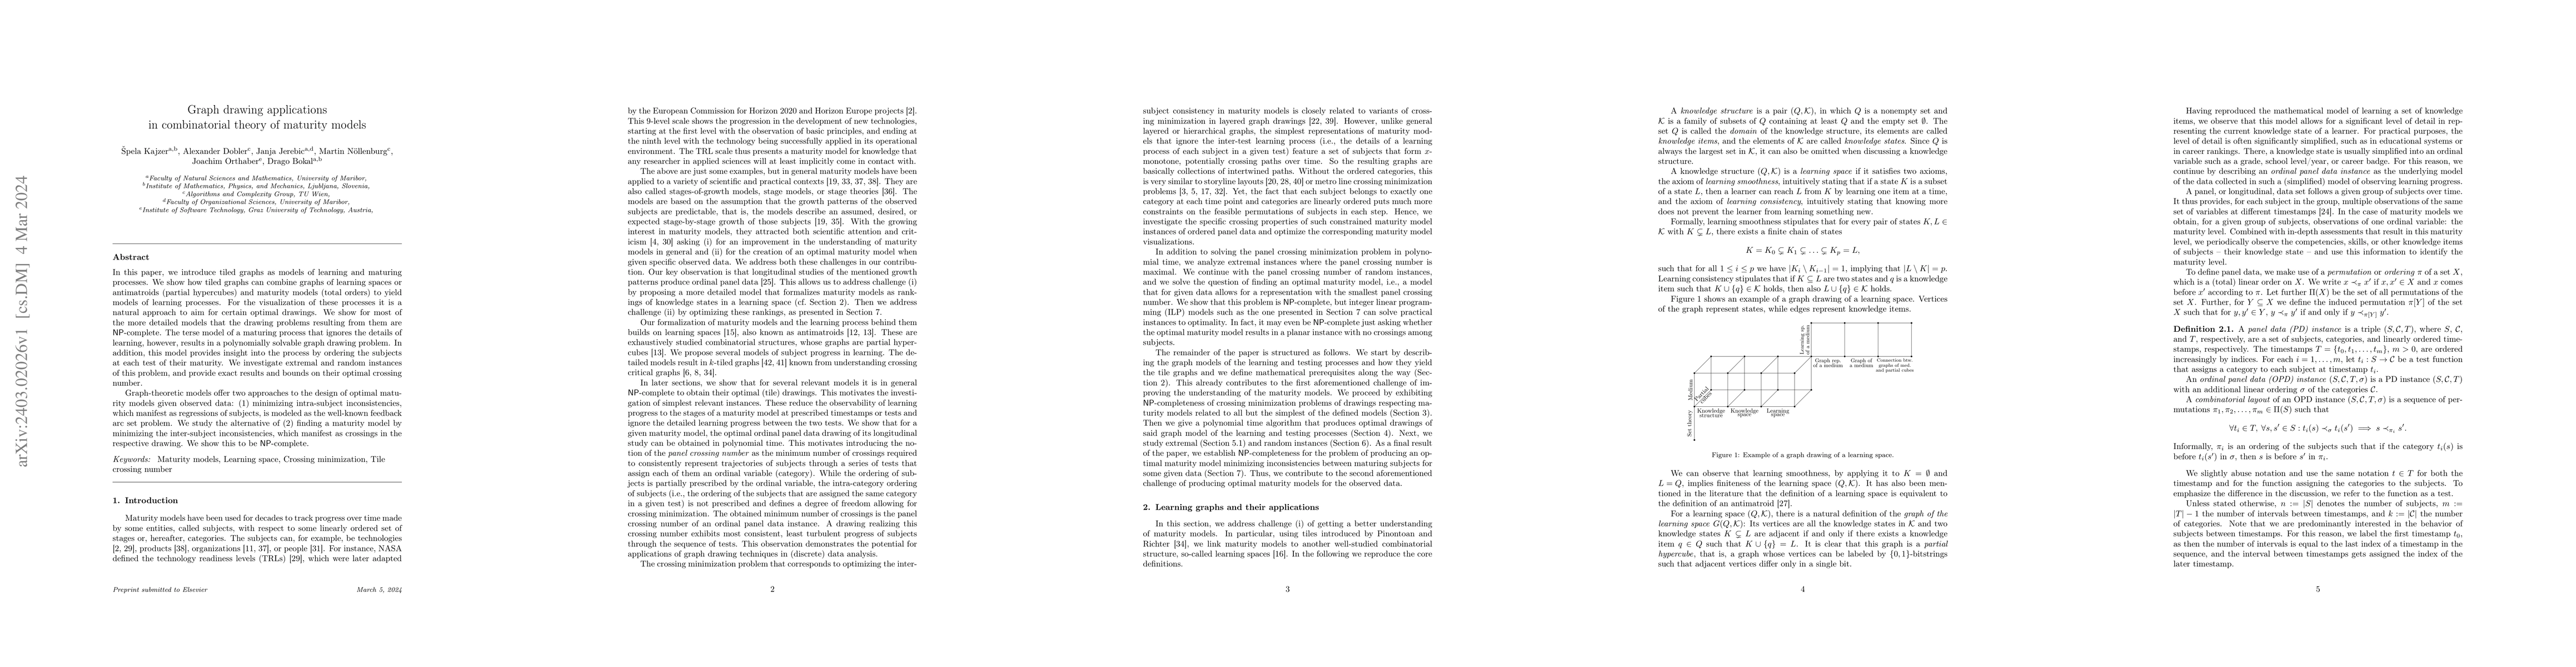
In this paper, we introduce tiled graphs as models of learning and maturing processes. We show how tiled graphs can combine graphs of learning spaces or antimatroids (partial hypercubes) and maturit...
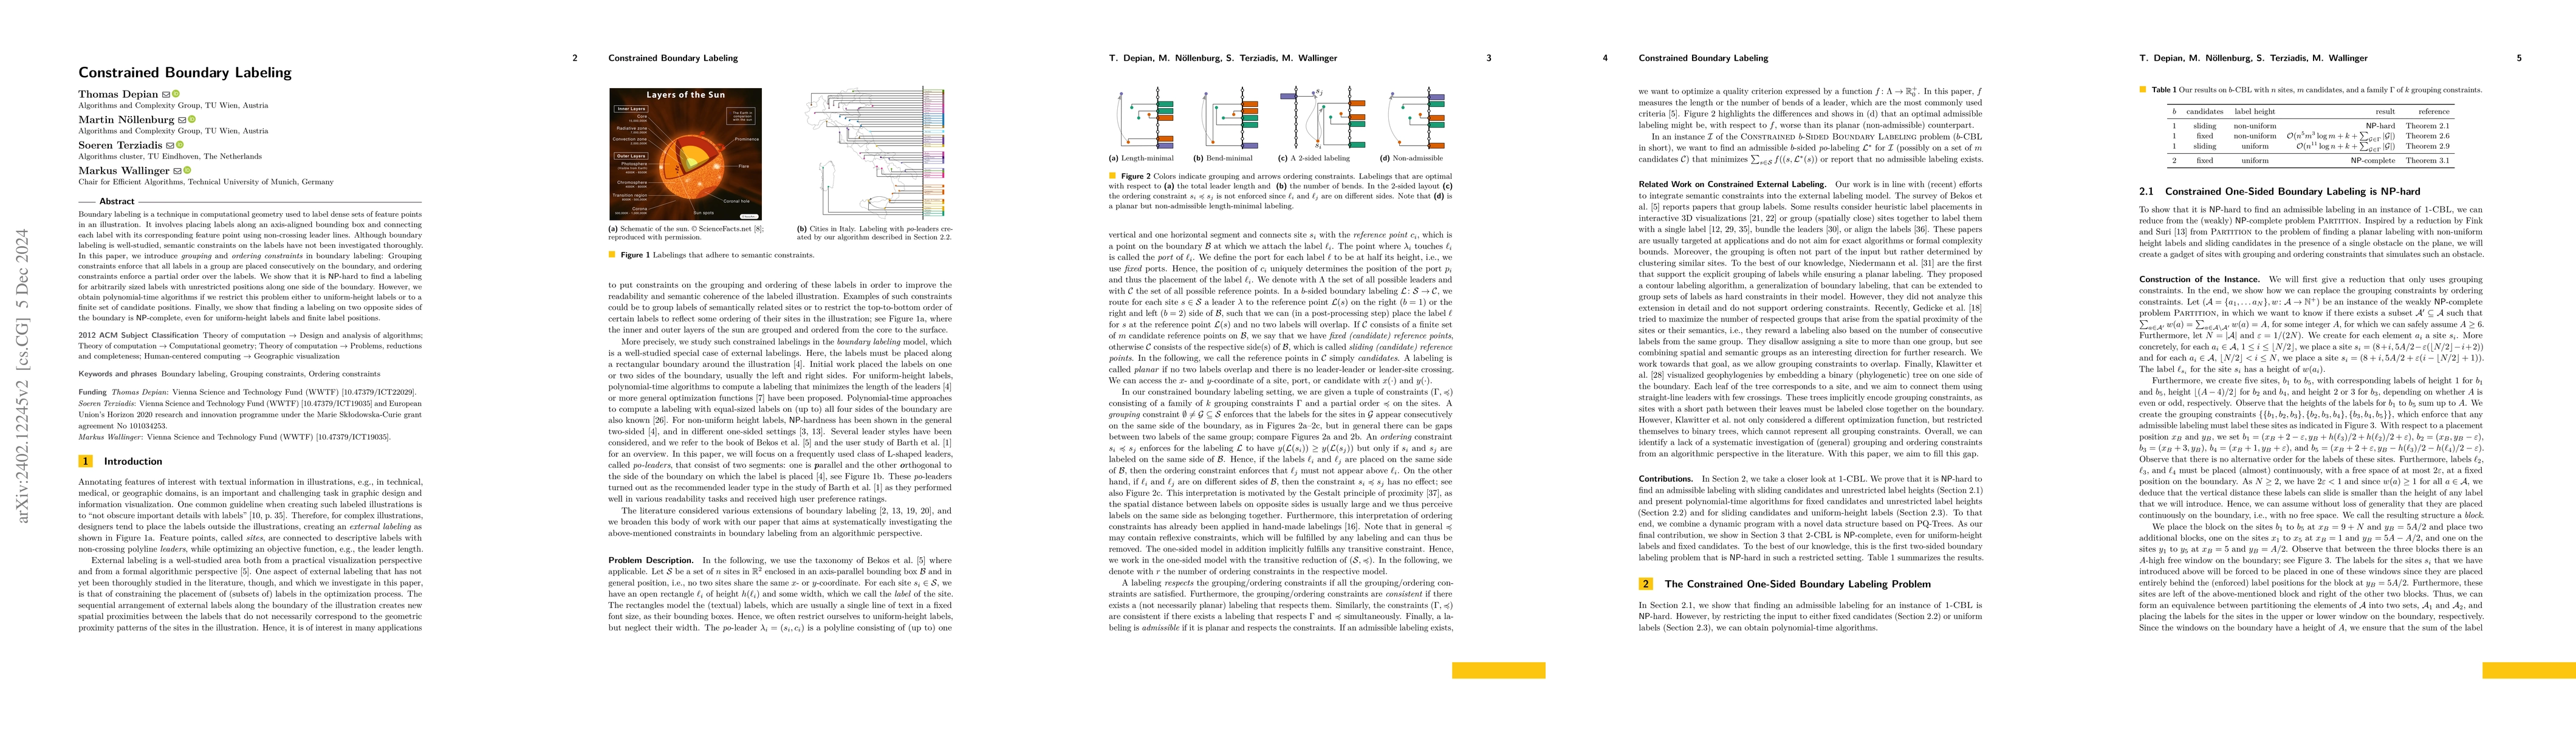
Boundary labeling is a technique used to label dense sets of feature points in an illustration. It involves placing labels along a rectangular boundary box and connecting each label with its corresp...
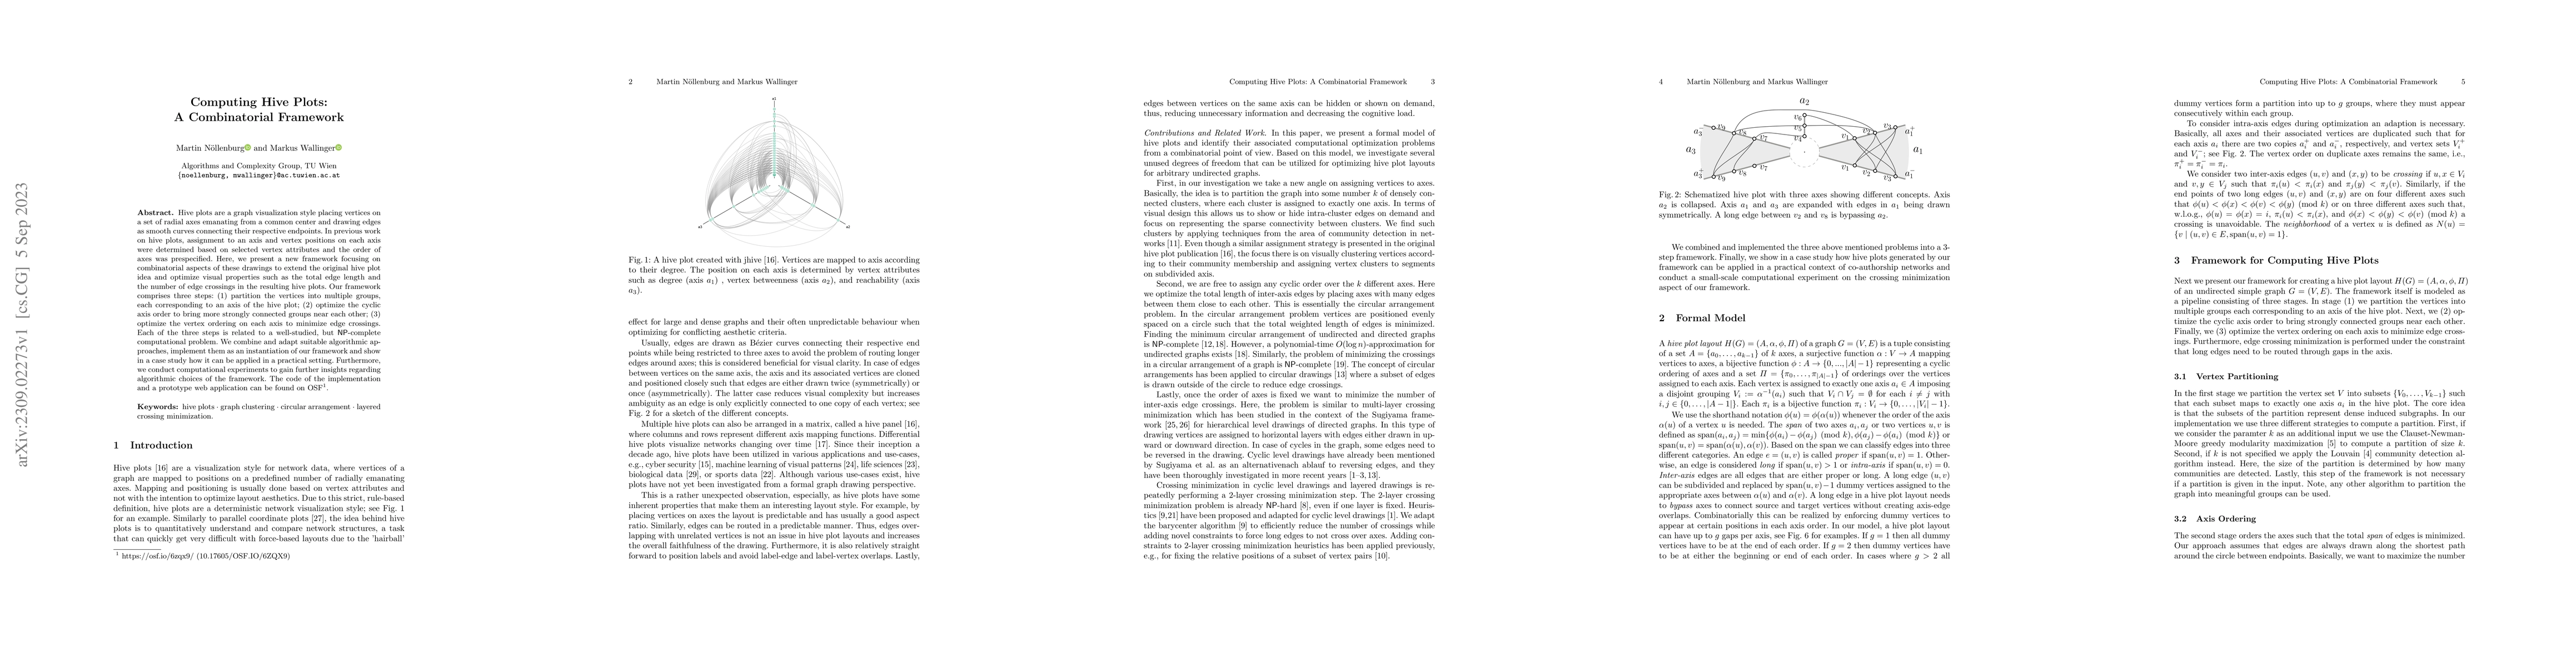
Hive plots are a graph visualization style placing vertices on a set of radial axes emanating from a common center and drawing edges as smooth curves connecting their respective endpoints. In previo...

A fundamental question is whether one can maintain a maximum independent set in polylogarithmic update time for a dynamic collection of geometric objects in Euclidean space. Already, for a set of in...
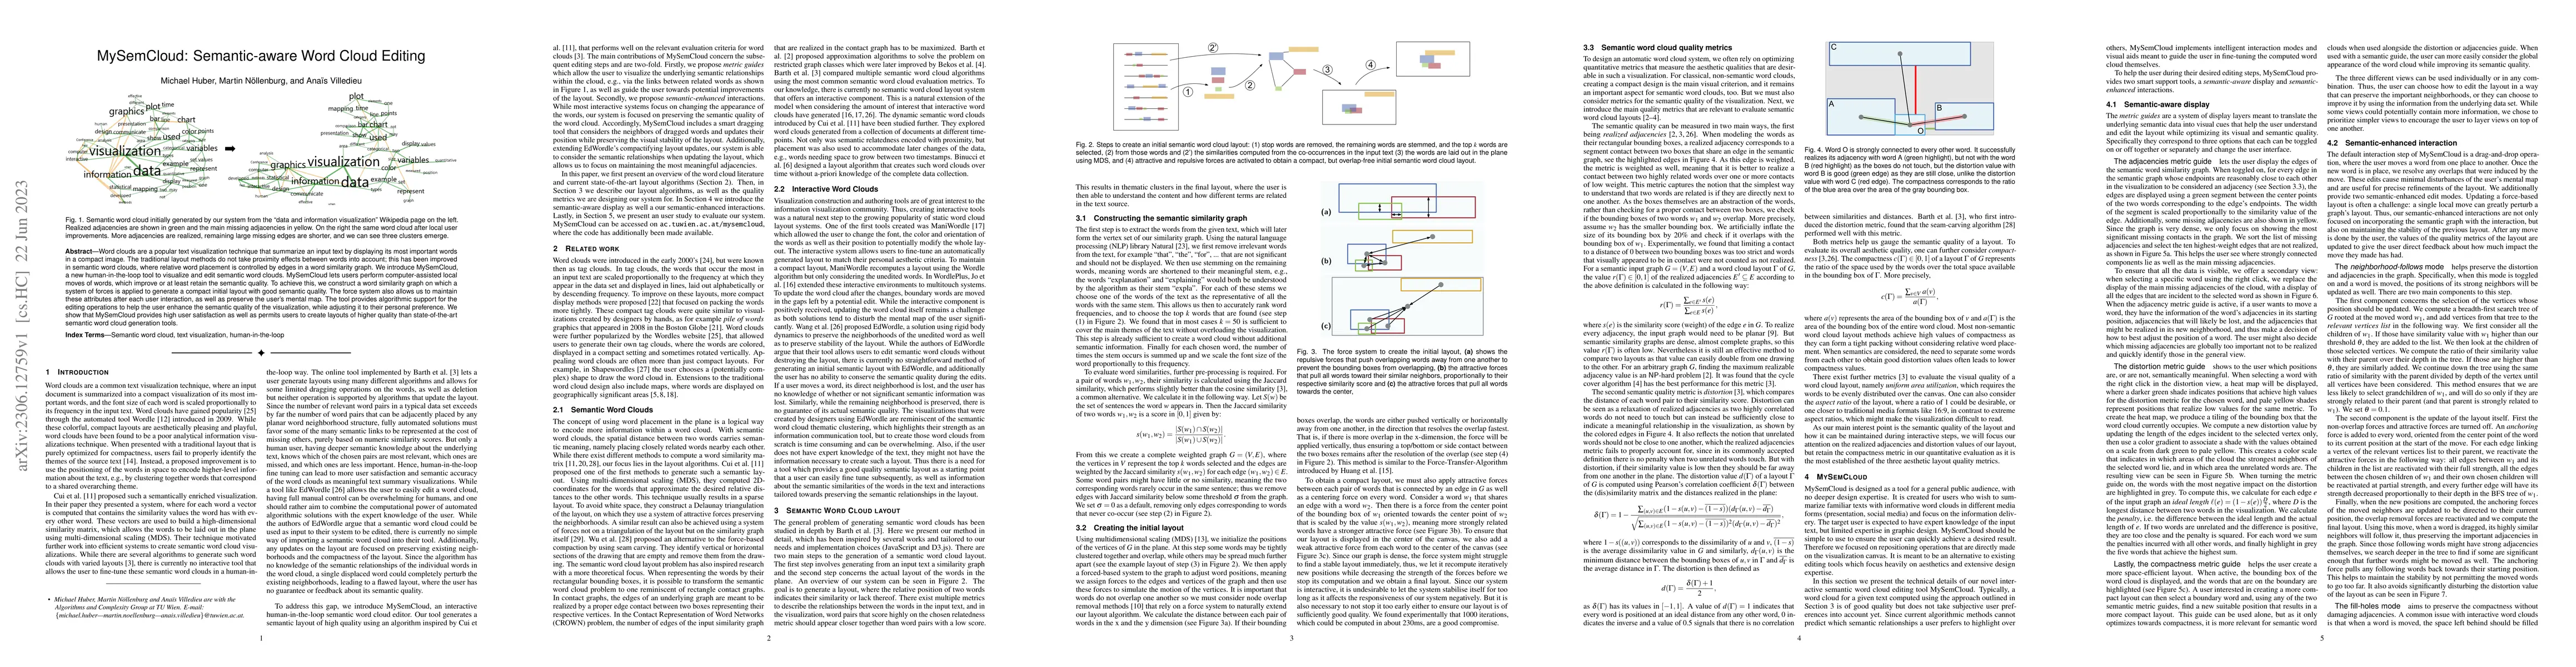
Word clouds are a popular text visualization technique that summarize an input text by displaying its most important words in a compact image. The traditional layout methods do not take proximity ef...
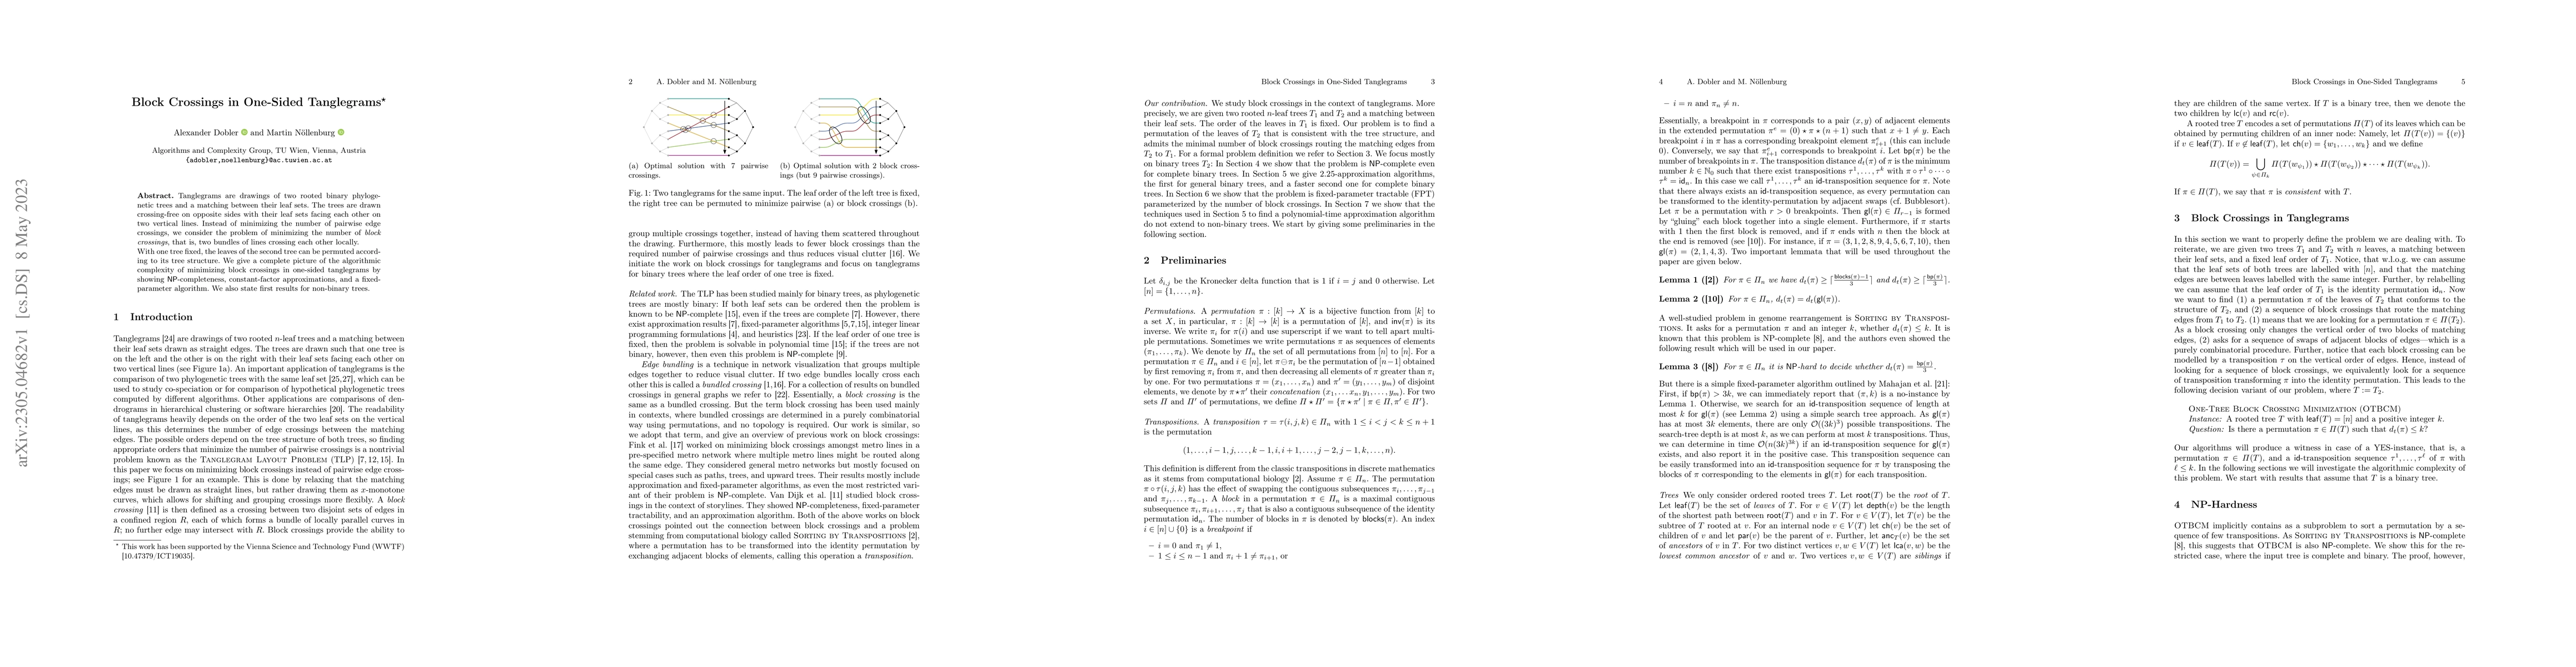
Tanglegrams are drawings of two rooted binary phylogenetic trees and a matching between their leaf sets. The trees are drawn crossing-free on opposite sides with their leaf sets facing each other on...
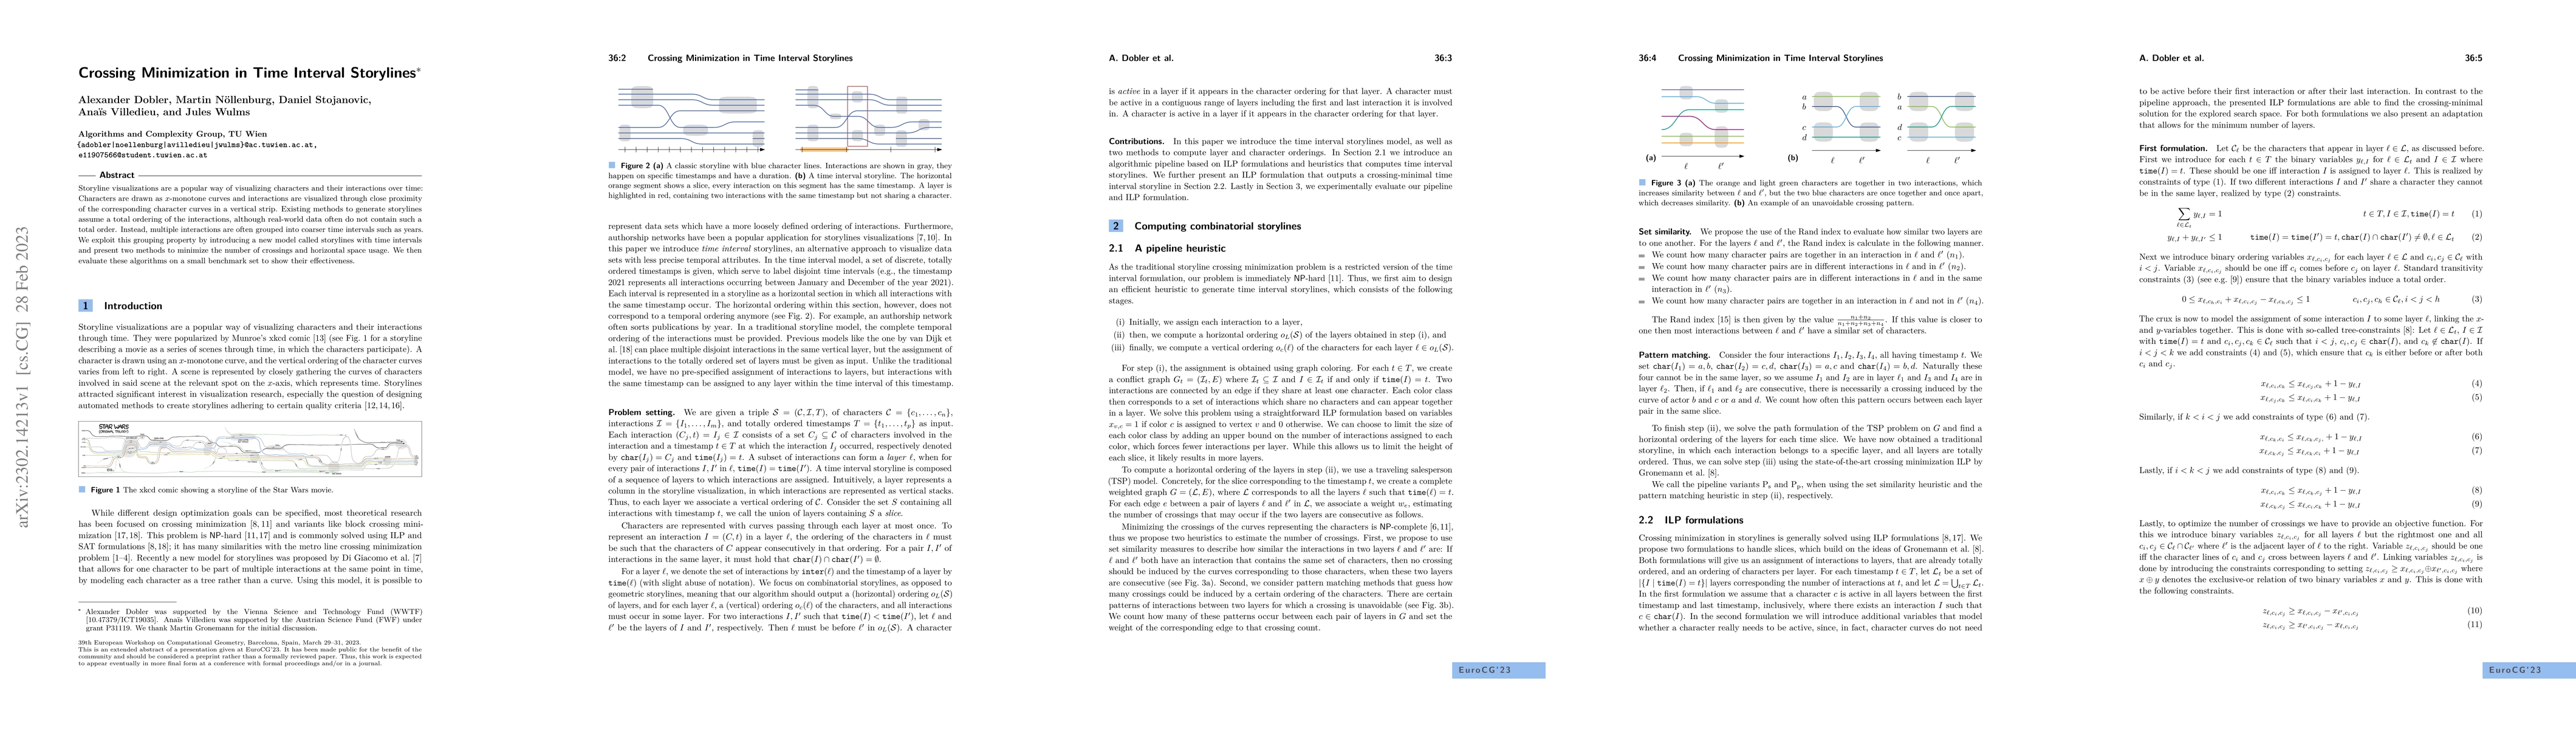
Storyline visualizations are a popular way of visualizing characters and their interactions over time: Characters are drawn as x-monotone curves and interactions are visualized through close proximi...
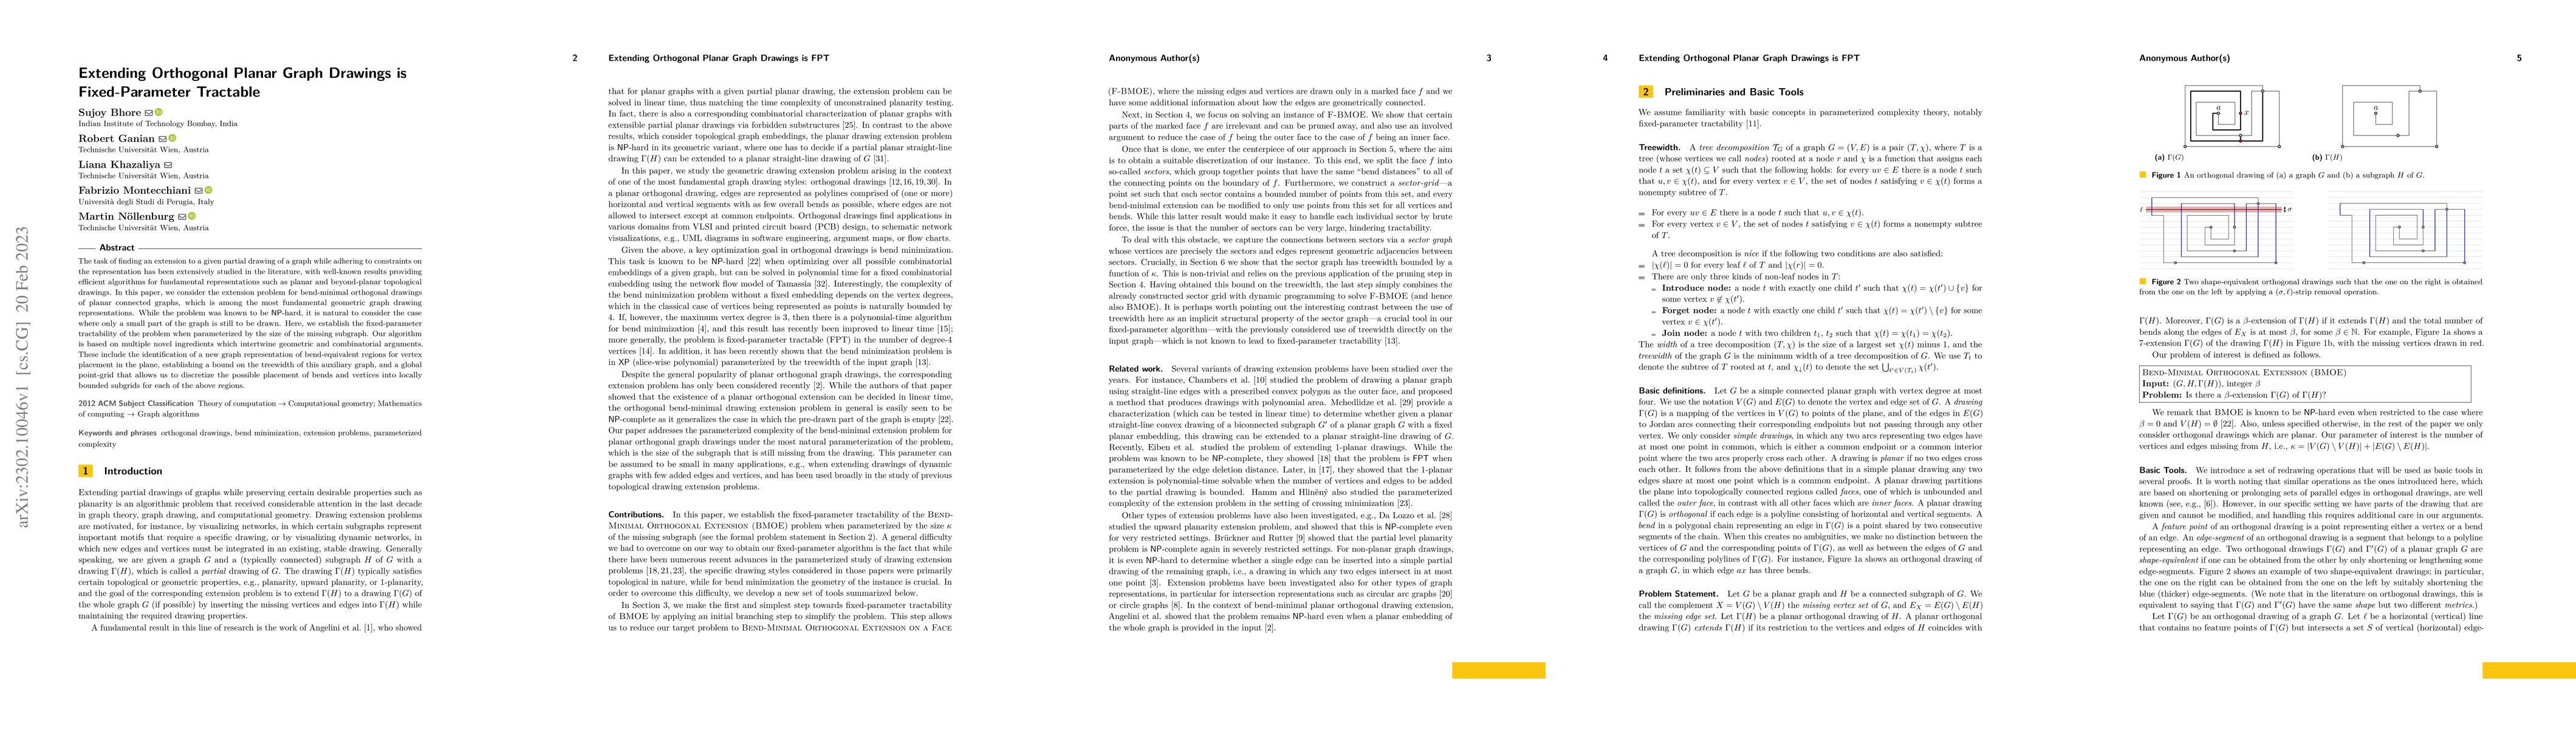
The task of finding an extension to a given partial drawing of a graph while adhering to constraints on the representation has been extensively studied in the literature, with well-known results pro...
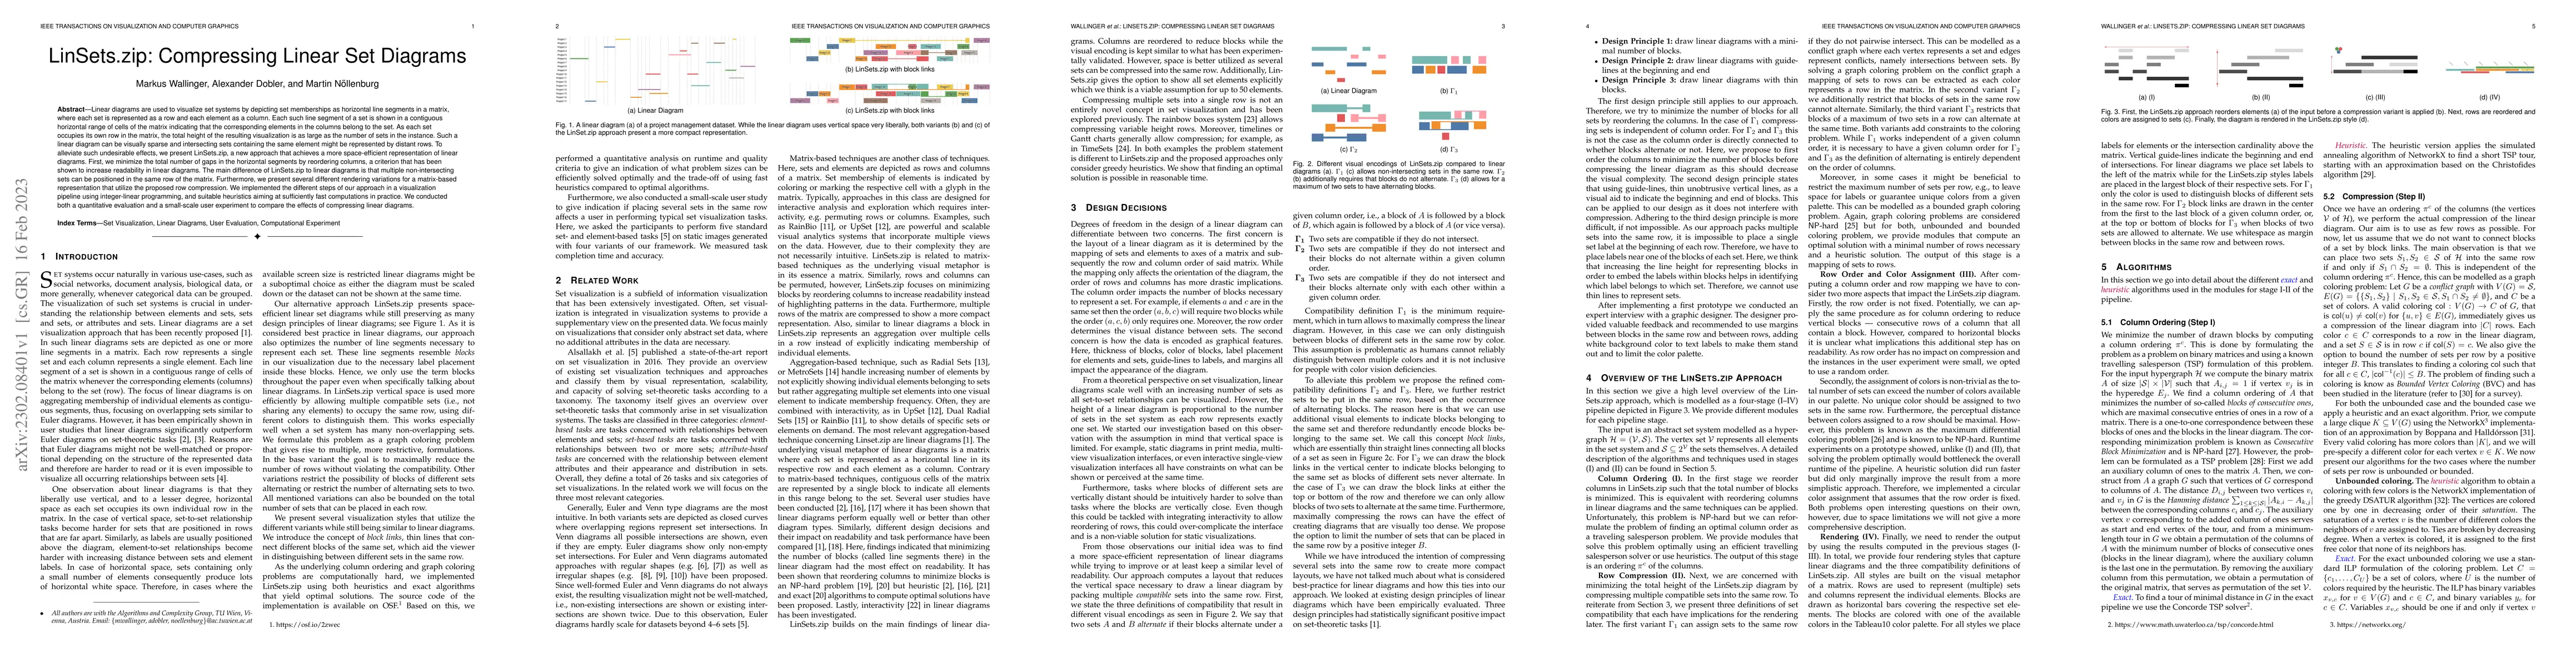
Linear diagrams are used to visualize set systems by depicting set memberships as horizontal line segments in a matrix, where each set is represented as a row and each element as a column. Each such...
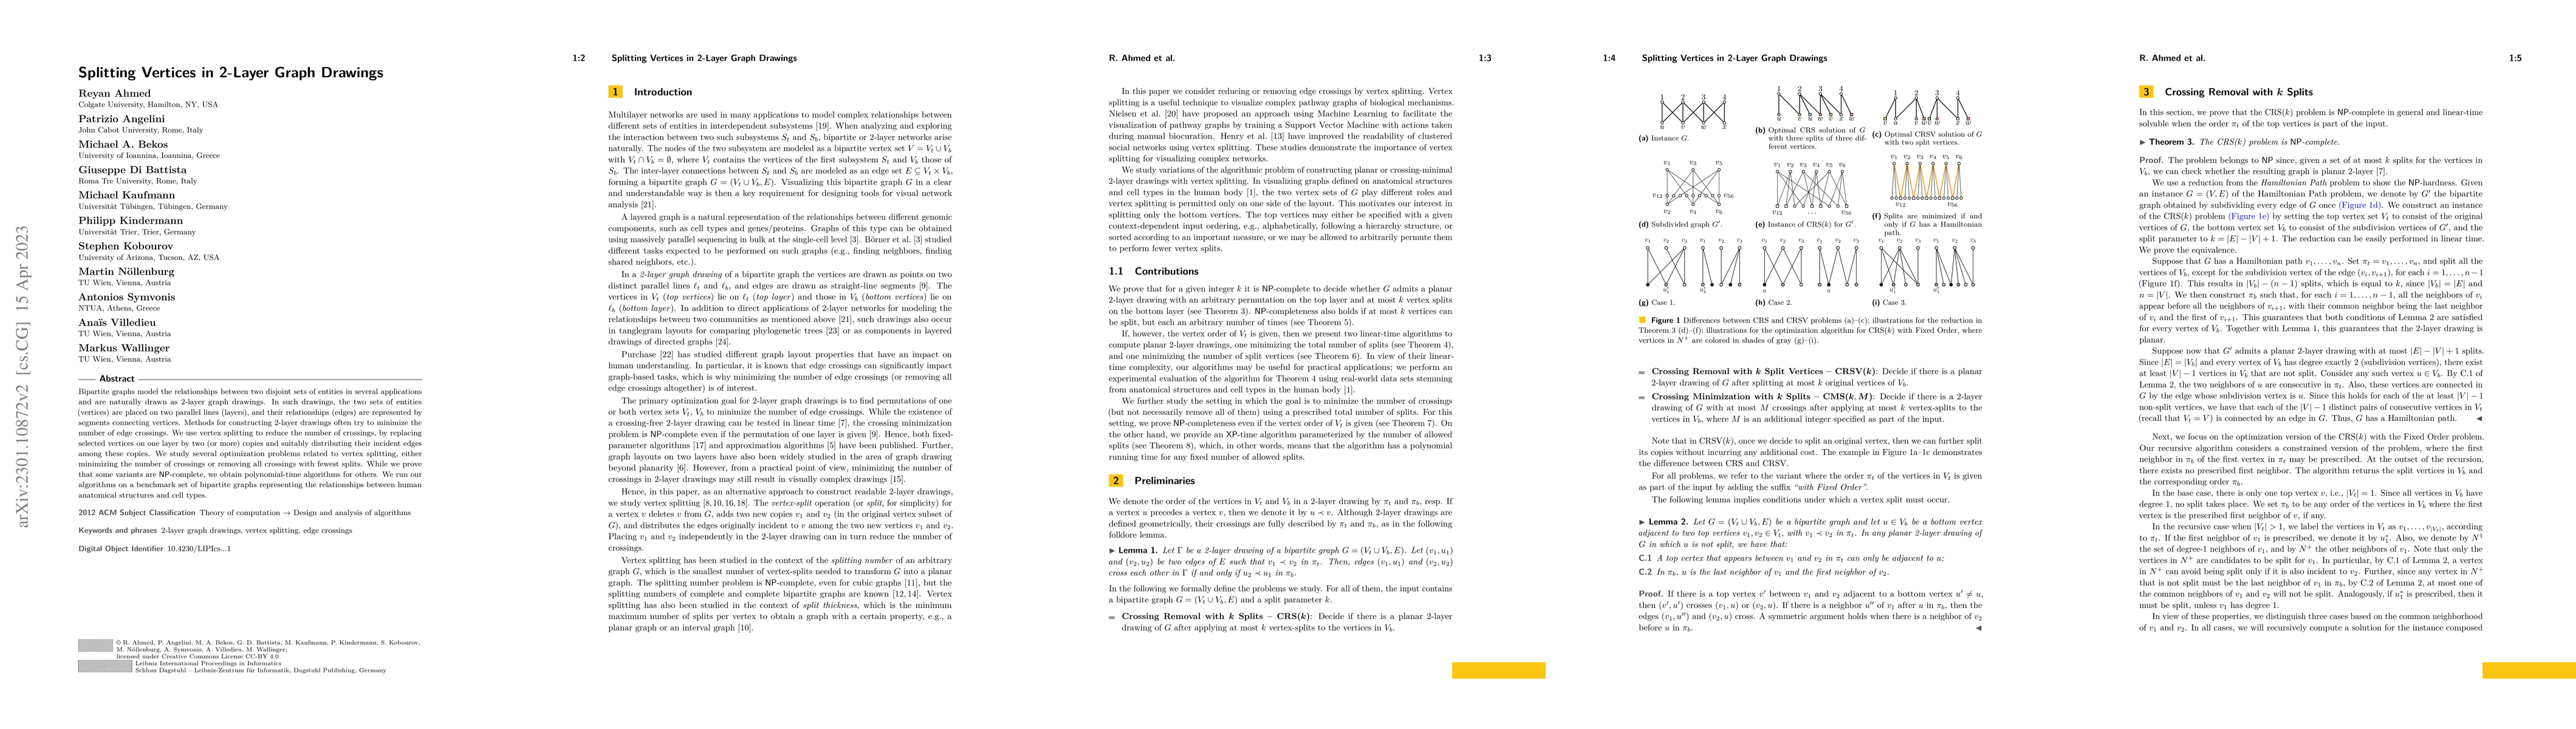
Bipartite graphs model the relationships between two disjoint sets of entities in several applications and are naturally drawn as 2-layer graph drawings. In such drawings, the two sets of entities (...
Vertex splitting replaces a vertex by two copies and partitions its incident edges amongst the copies. This problem has been studied as a graph editing operation to achieve desired properties with a...
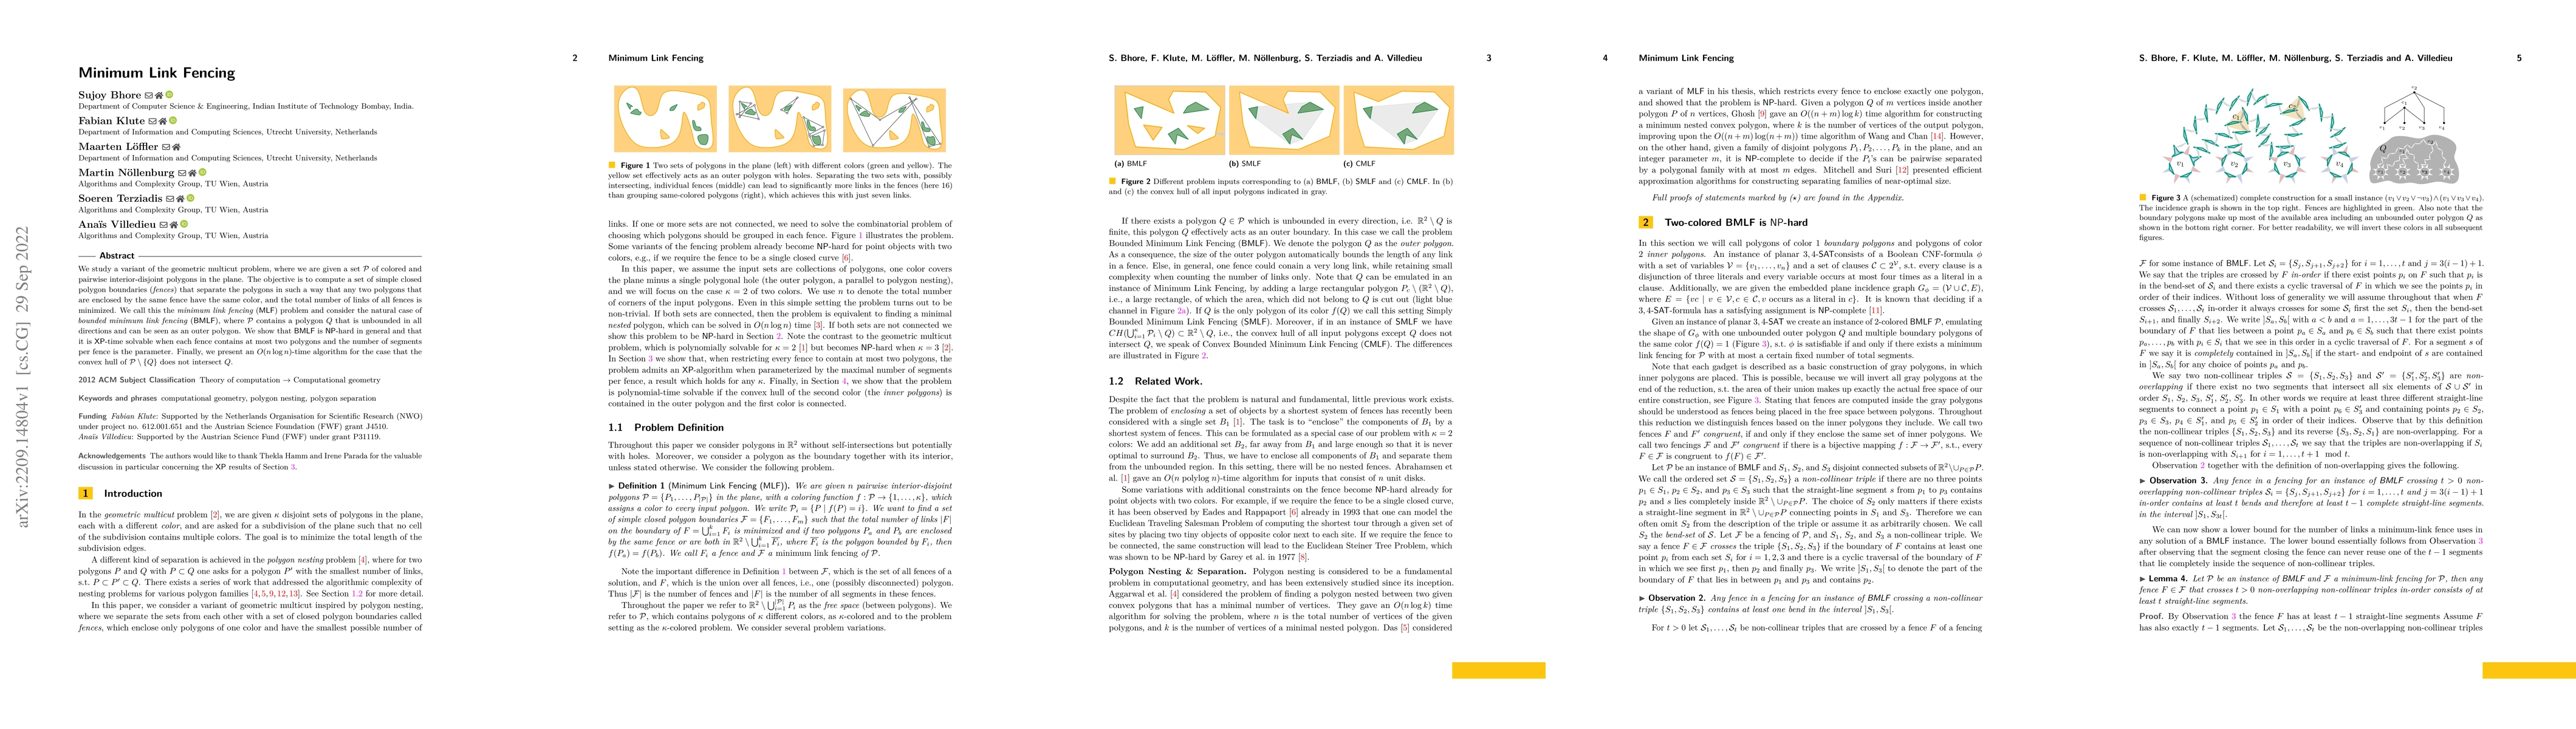
We study a variant of the geometric multicut problem, where we are given a set $\mathcal{P}$ of colored and pairwise interior-disjoint polygons in the plane. The objective is to compute a set of sim...
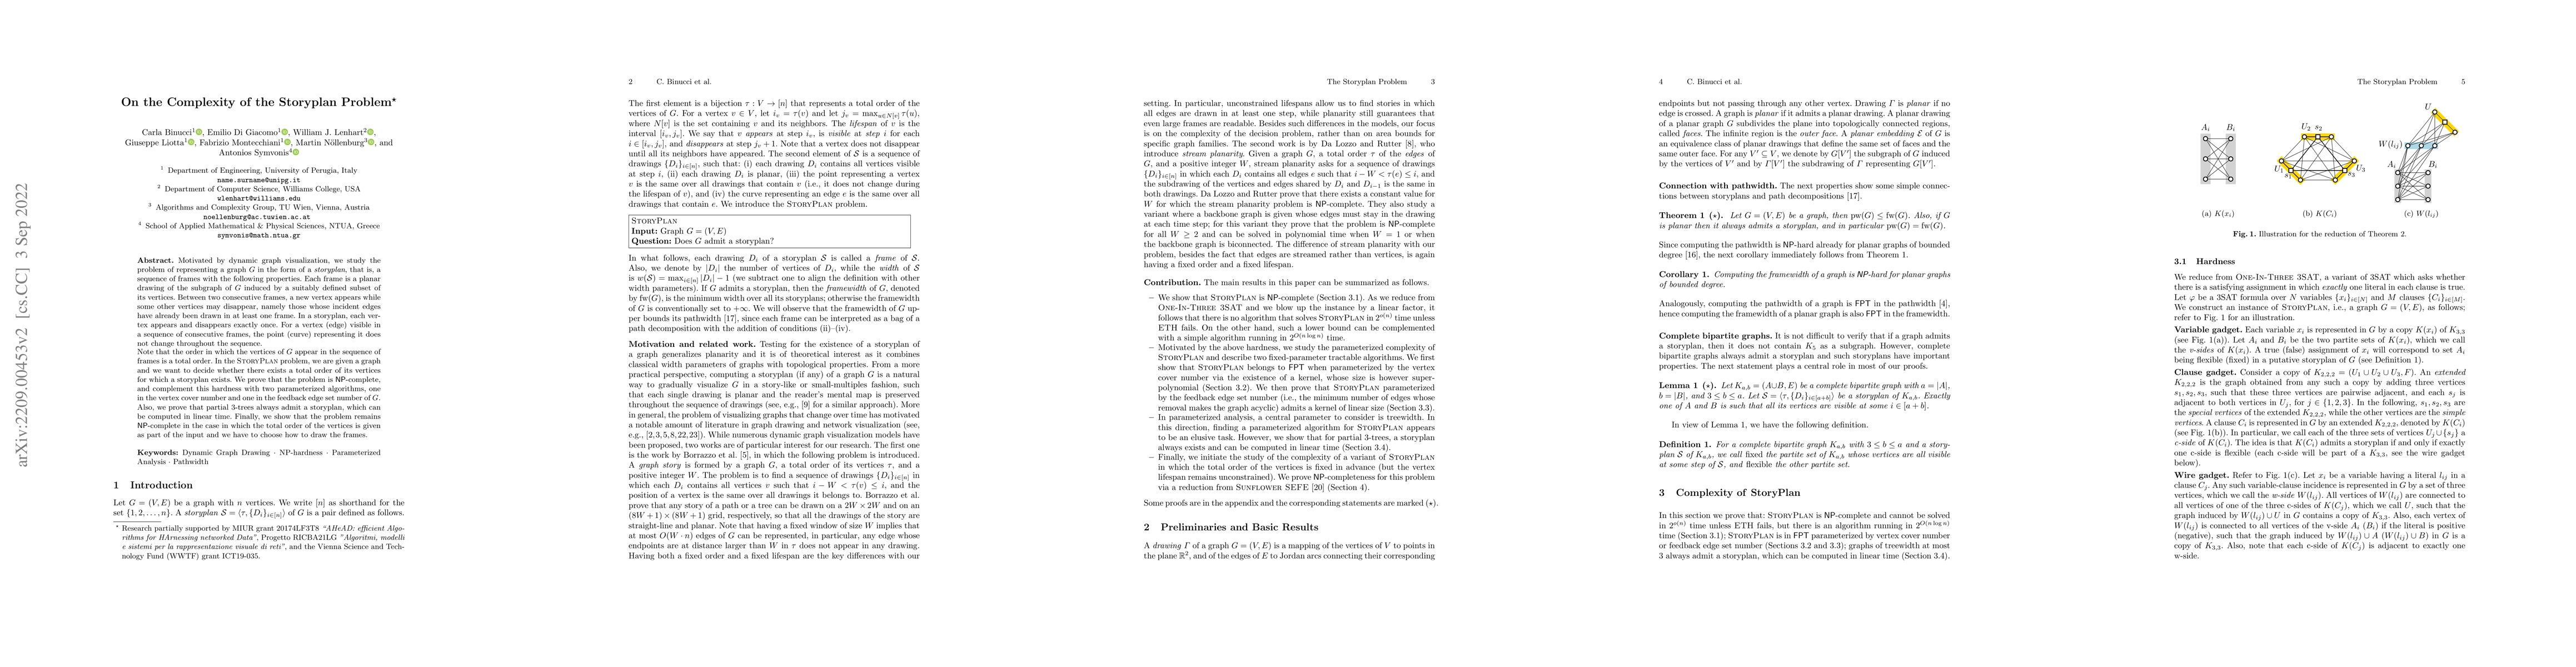
Motivated by dynamic graph visualization, we study the problem of representing a graph $G$ in the form of a \emph{storyplan}, that is, a sequence of frames with the following properties. Each frame ...
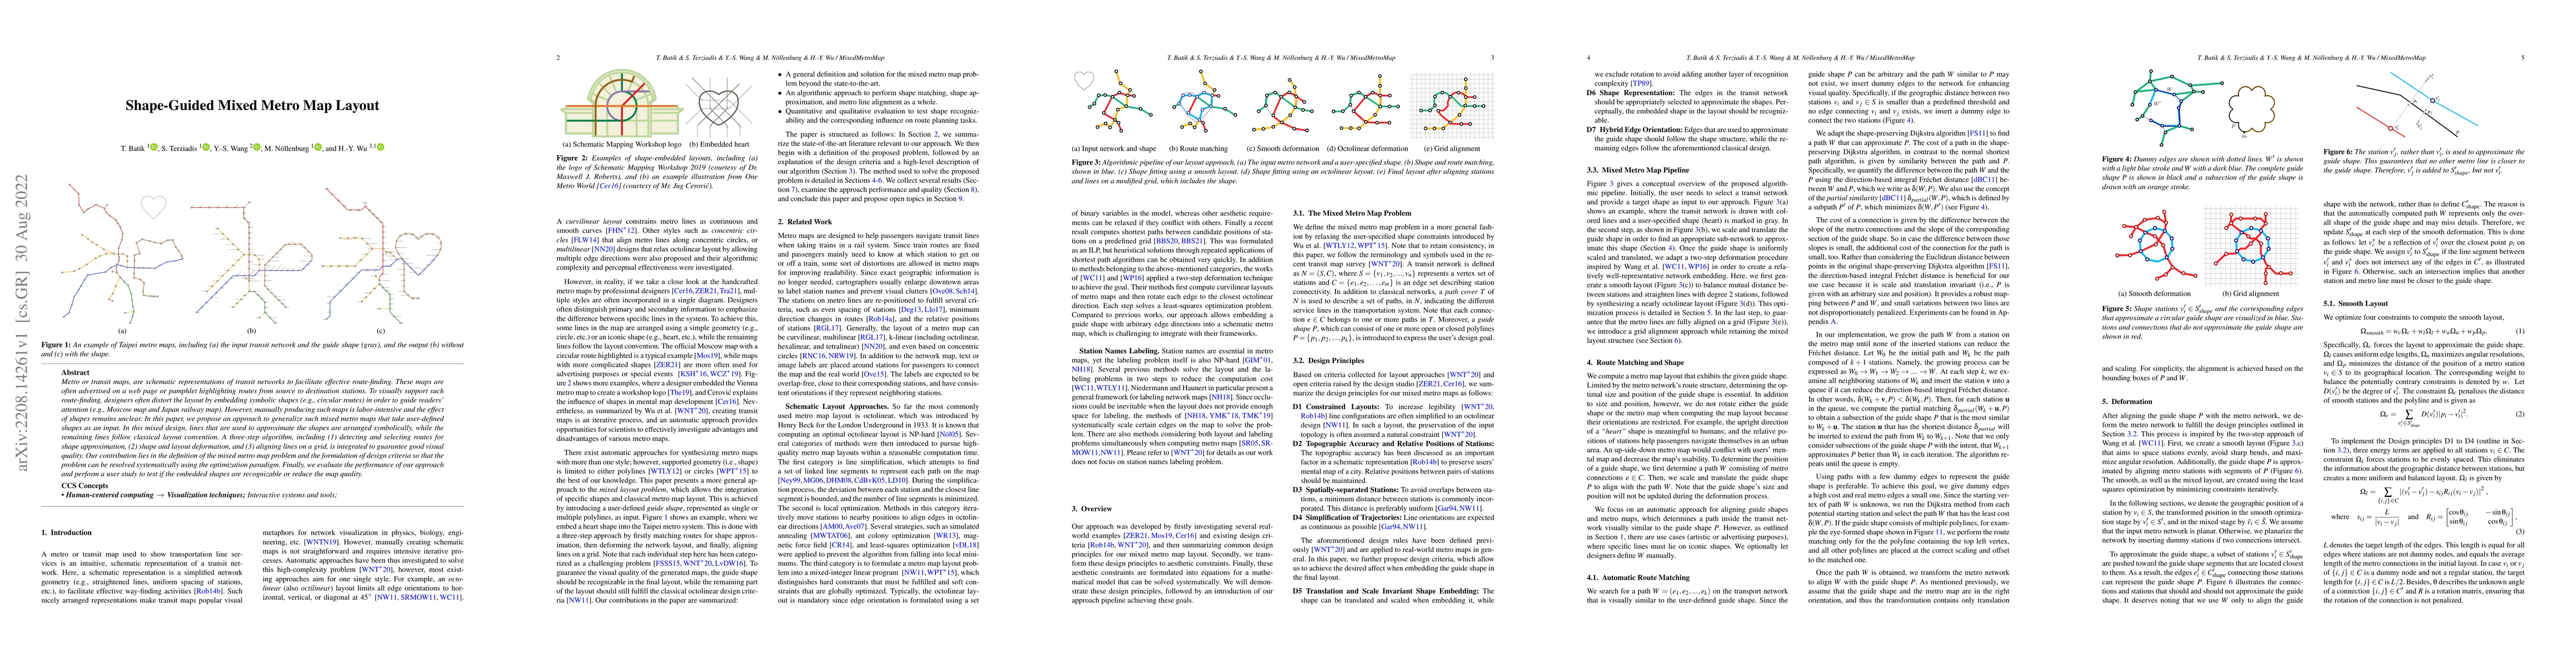
Metro or transit maps, are schematic representations of transit networks to facilitate effective route-finding. These maps are often advertised on a web page or pamphlet highlighting routes from sou...
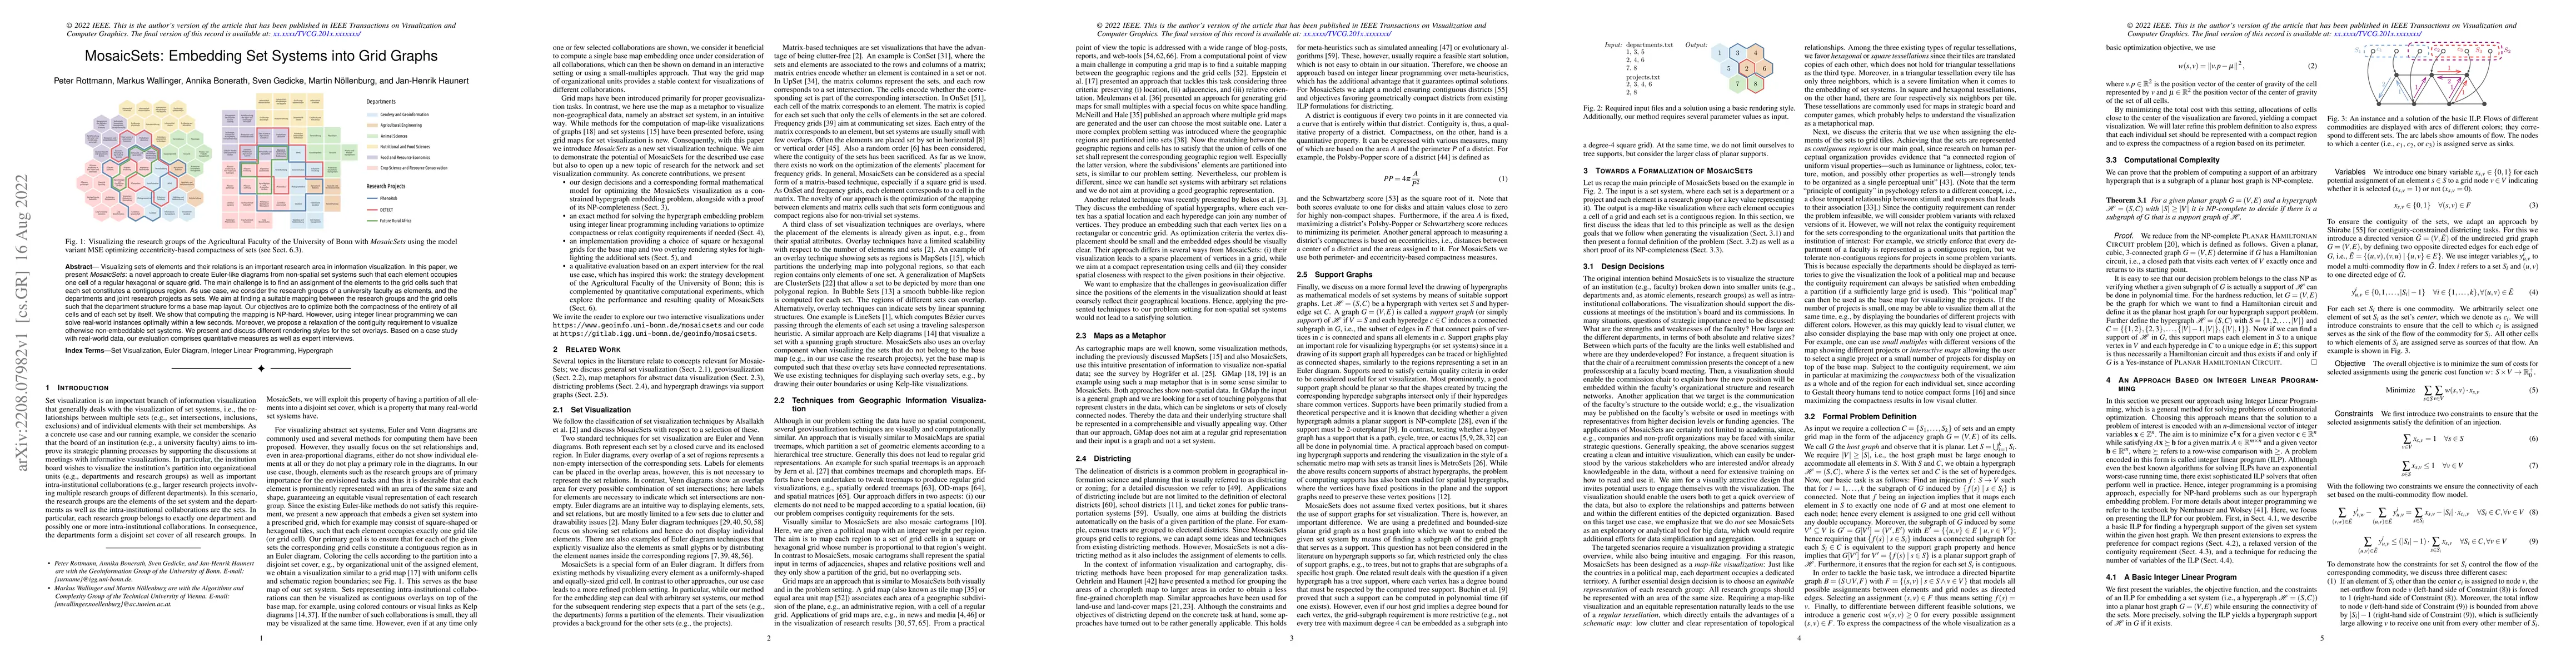
Visualizing sets of elements and their relations is an important research area in information visualization. In this paper, we present MosaicSets: a novel approach to create Euler-like diagrams from...
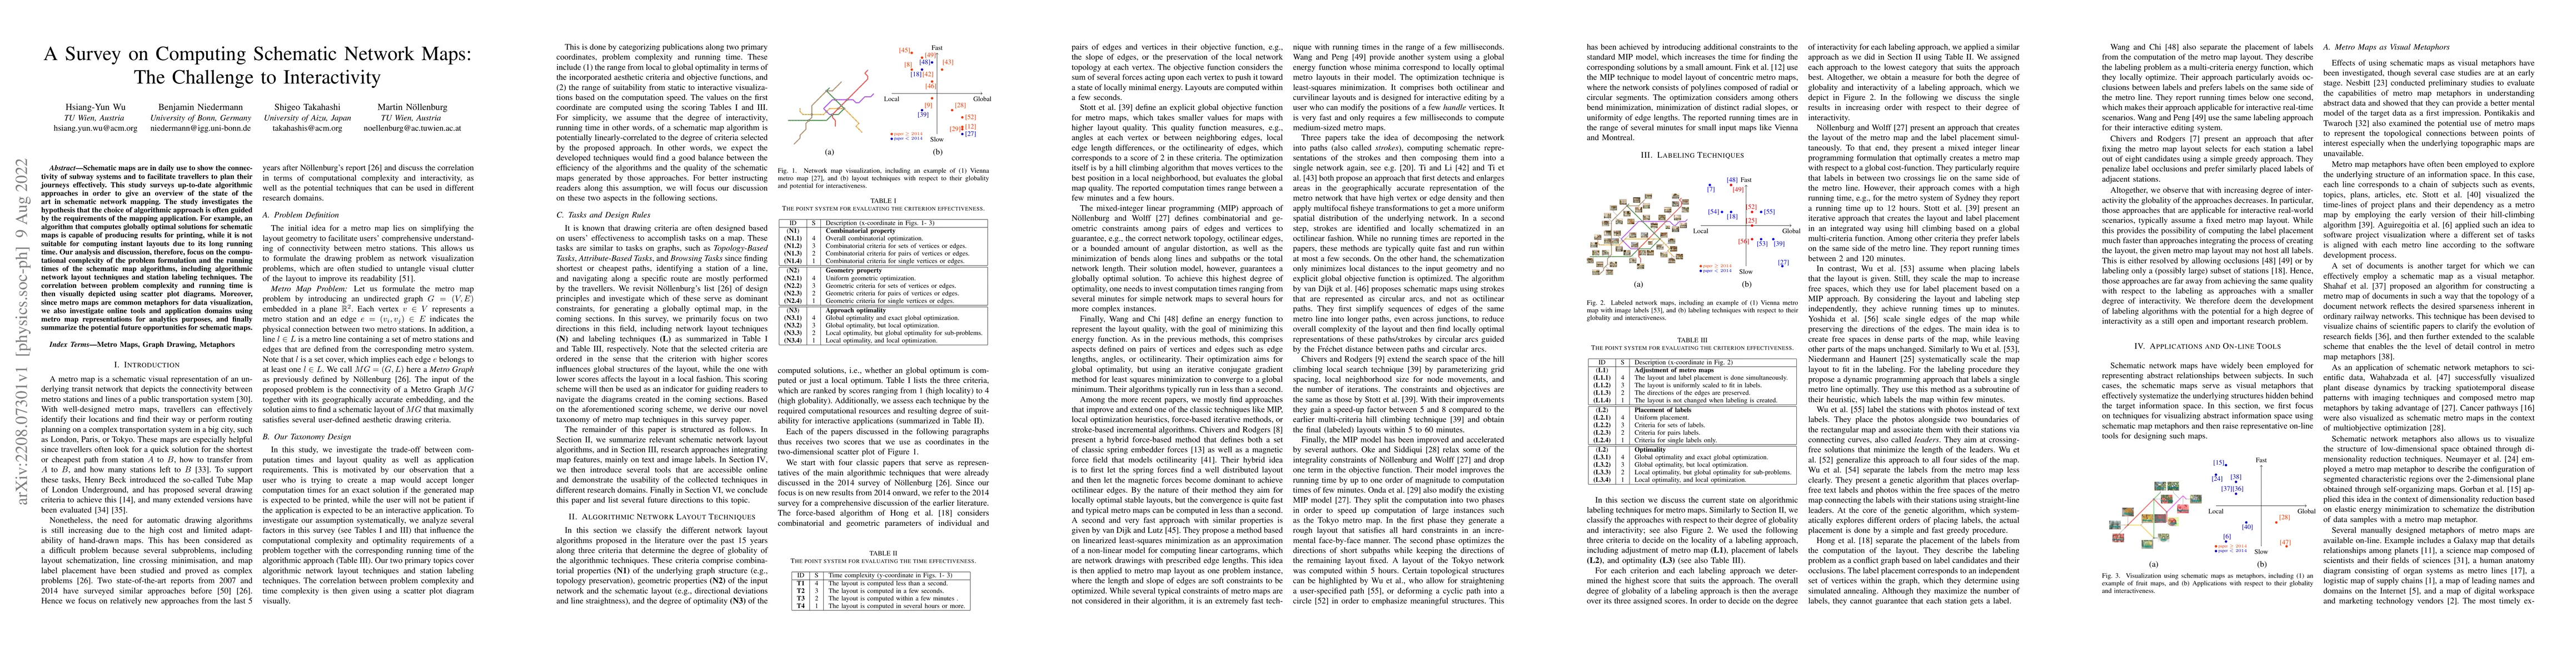
Schematic maps are in daily use to show the connectivity of subway systems and to facilitate travellers to plan their journeys effectively. This study surveys up-to-date algorithmic approaches in or...
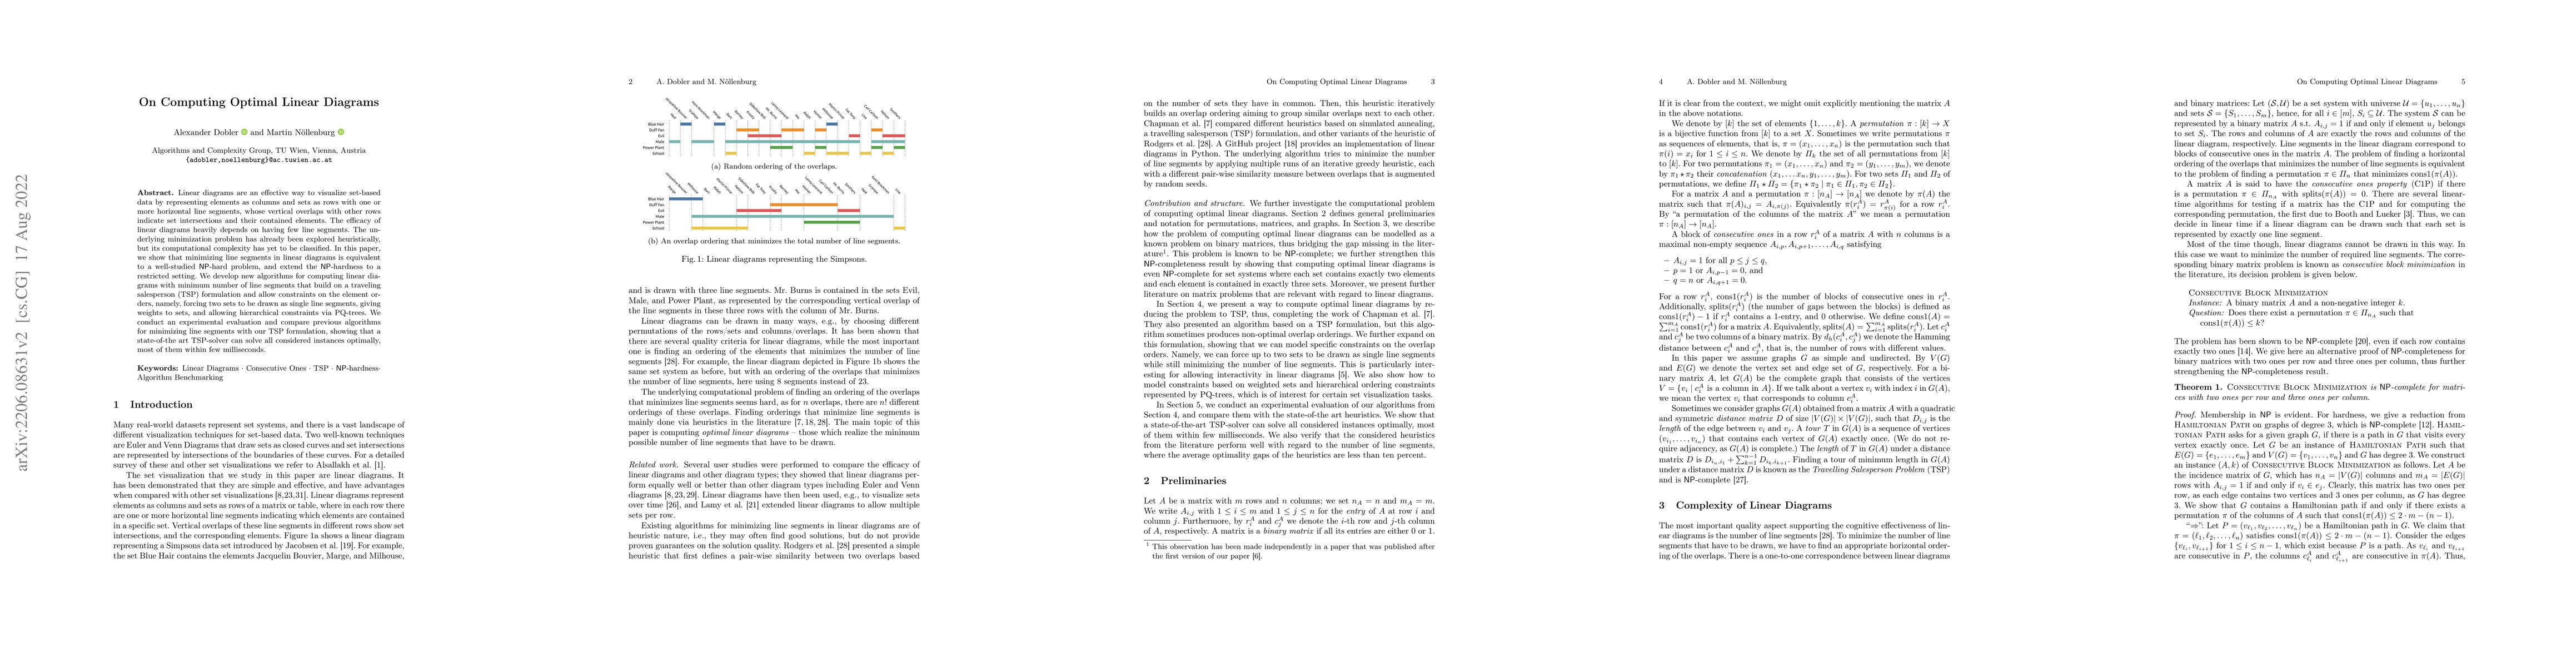
Linear diagrams are an effective way to visualize set-based data by representing elements as columns and sets as rows with one or more horizontal line segments, whose vertical overlaps with other ro...
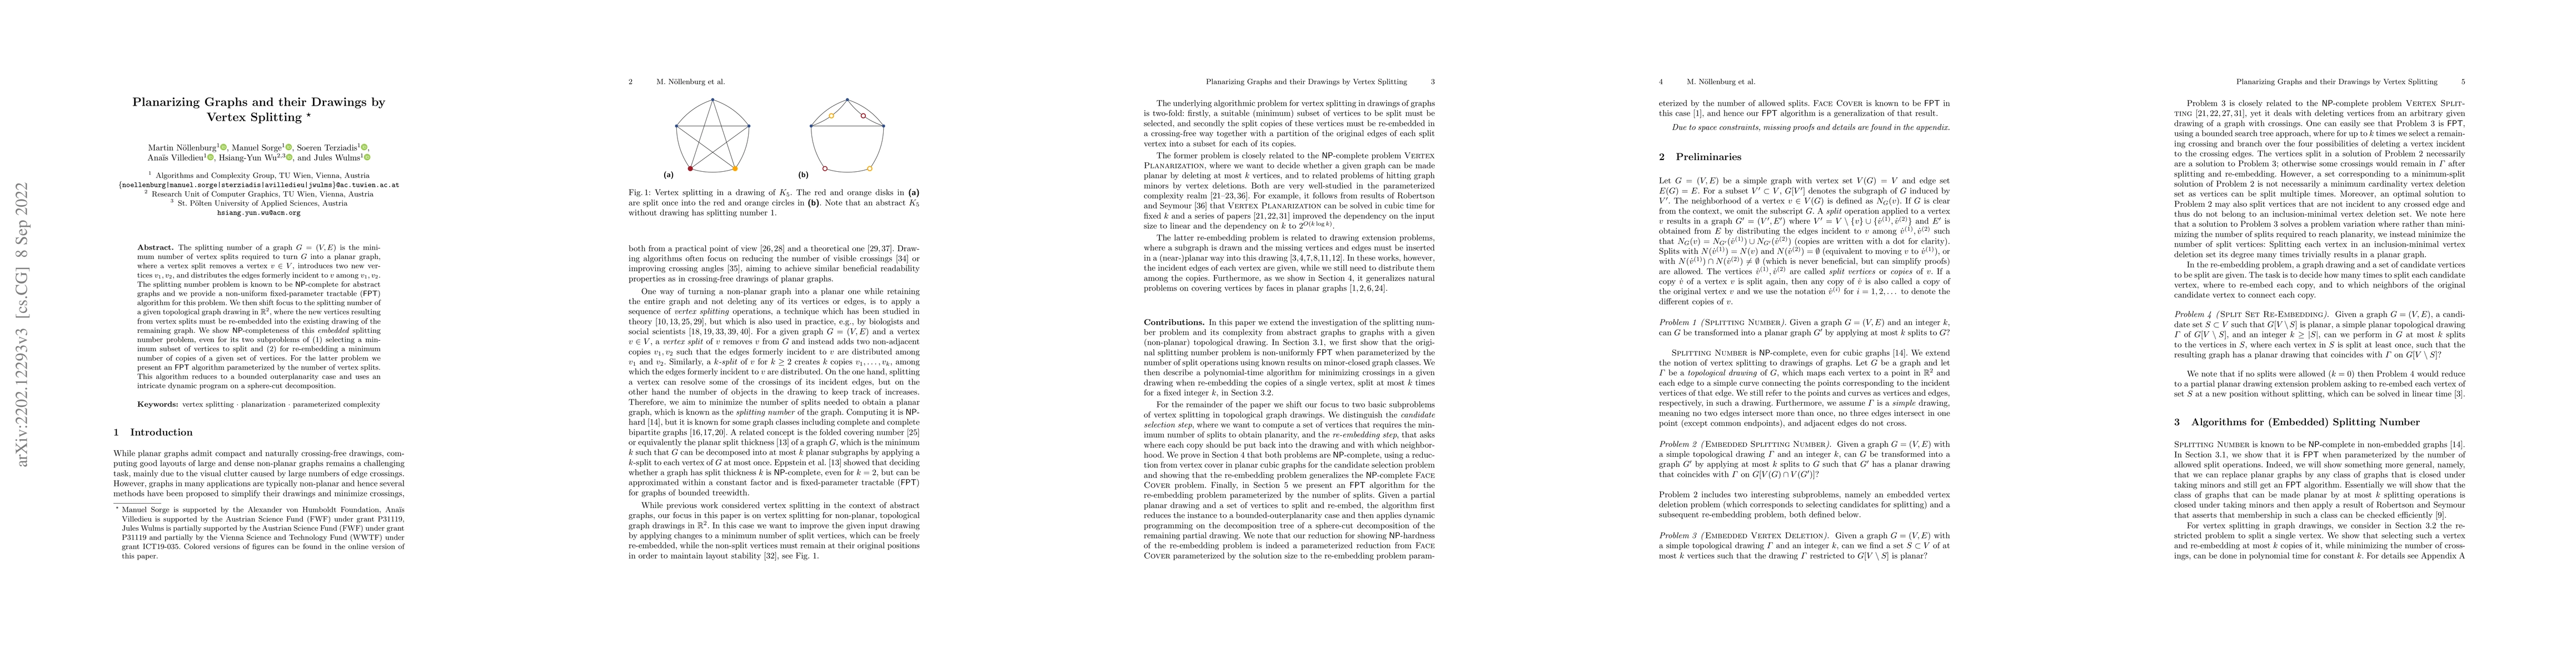
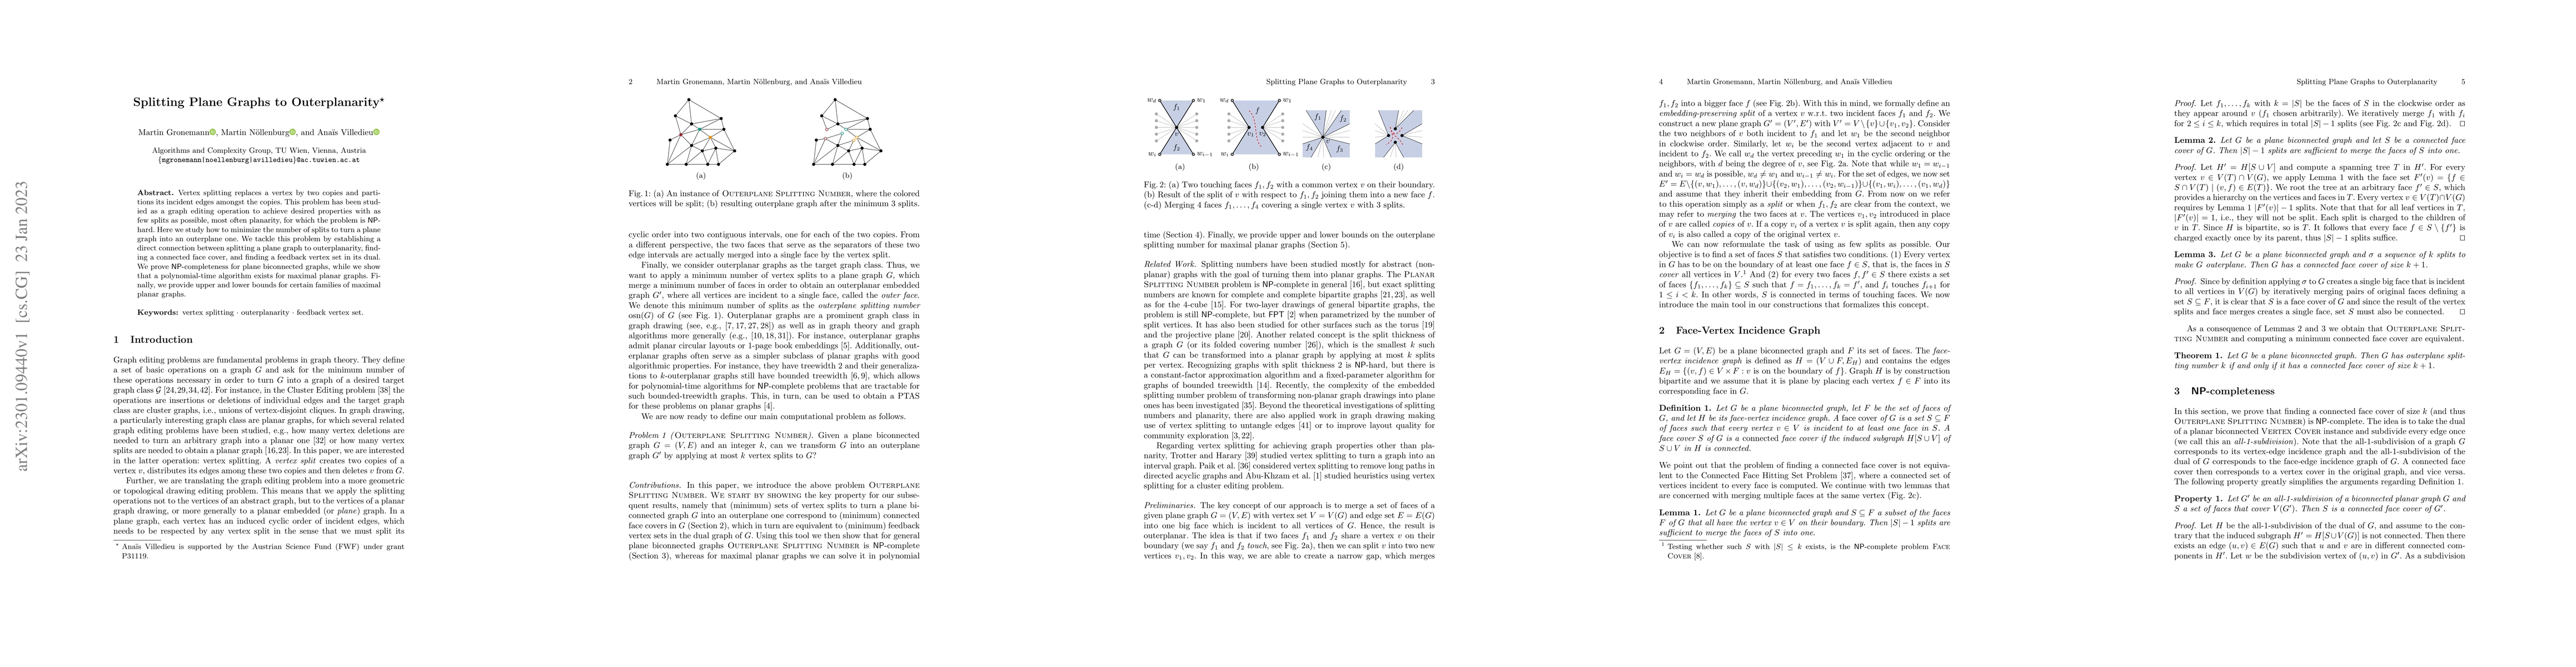
The splitting number of a graph $G=(V,E)$ is the minimum number of vertex splits required to turn $G$ into a planar graph, where a vertex split removes a vertex $v \in V$, introduces two new vertice...
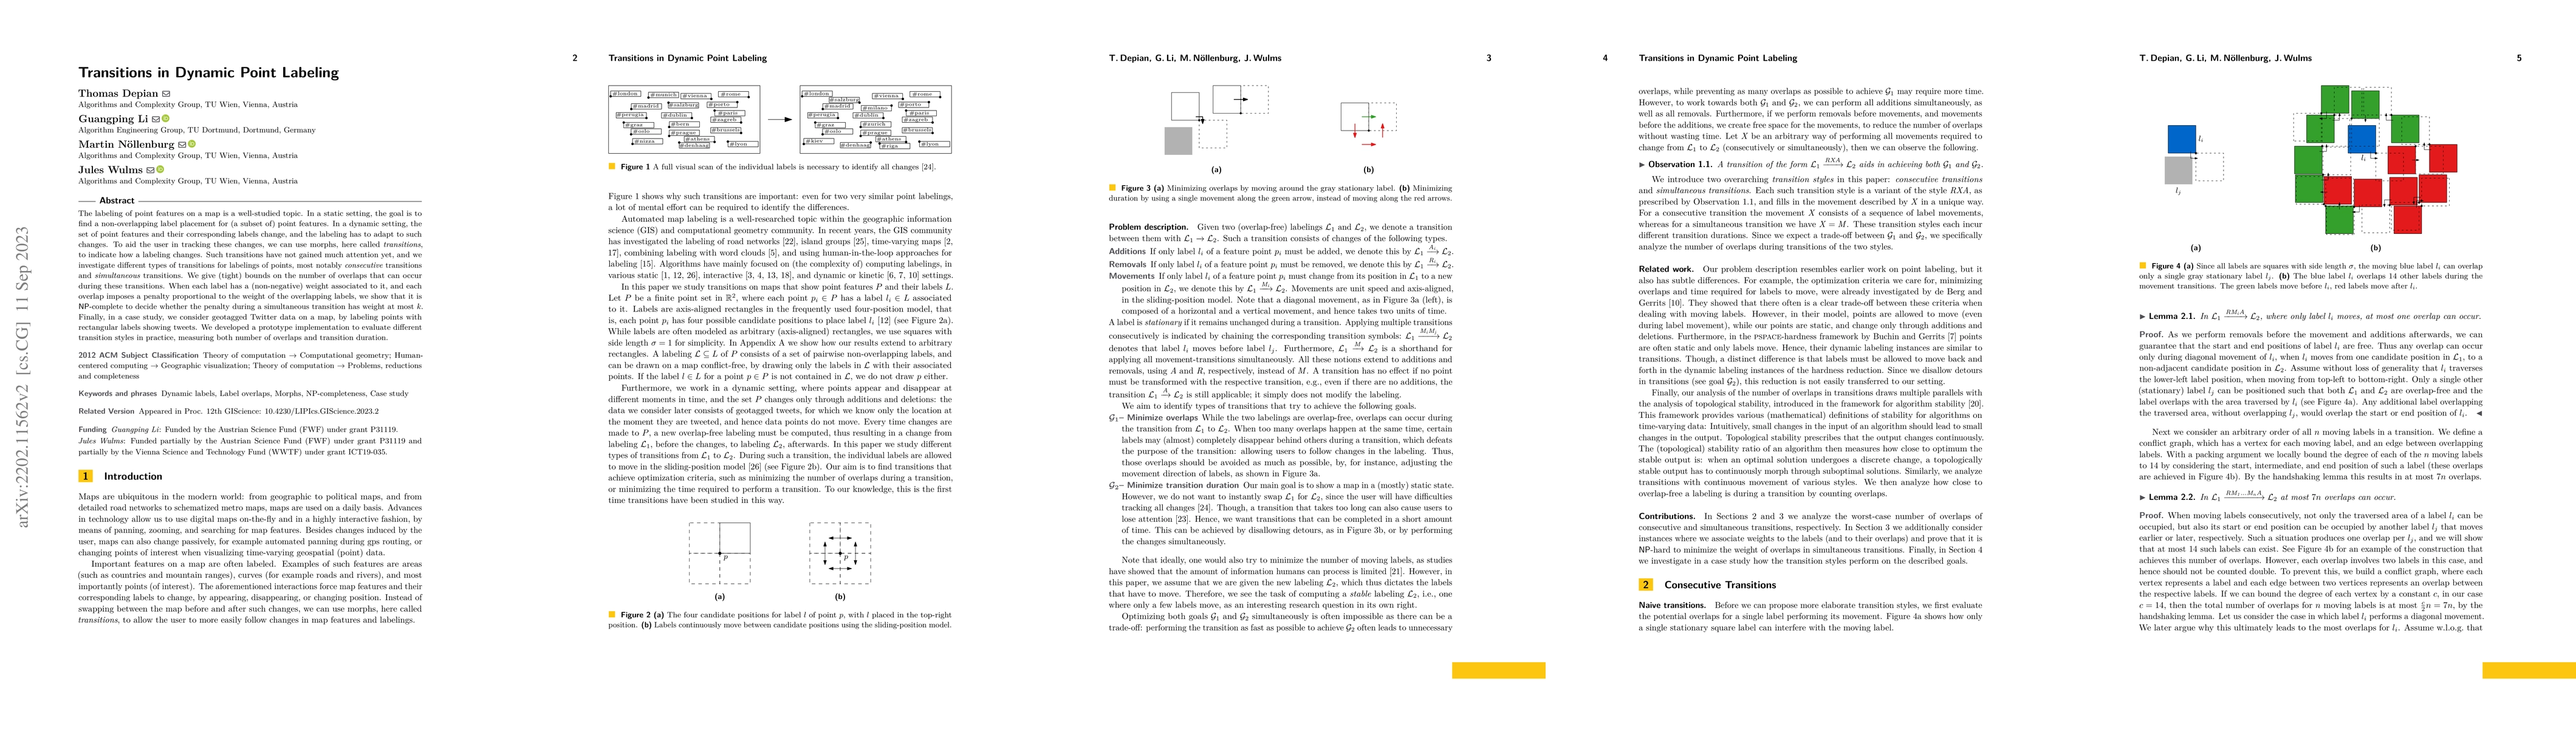
The labeling of point features on a map is a well-studied topic. In a static setting, the goal is to find a non-overlapping label placement for (a subset of) point features. In a dynamic setting, th...
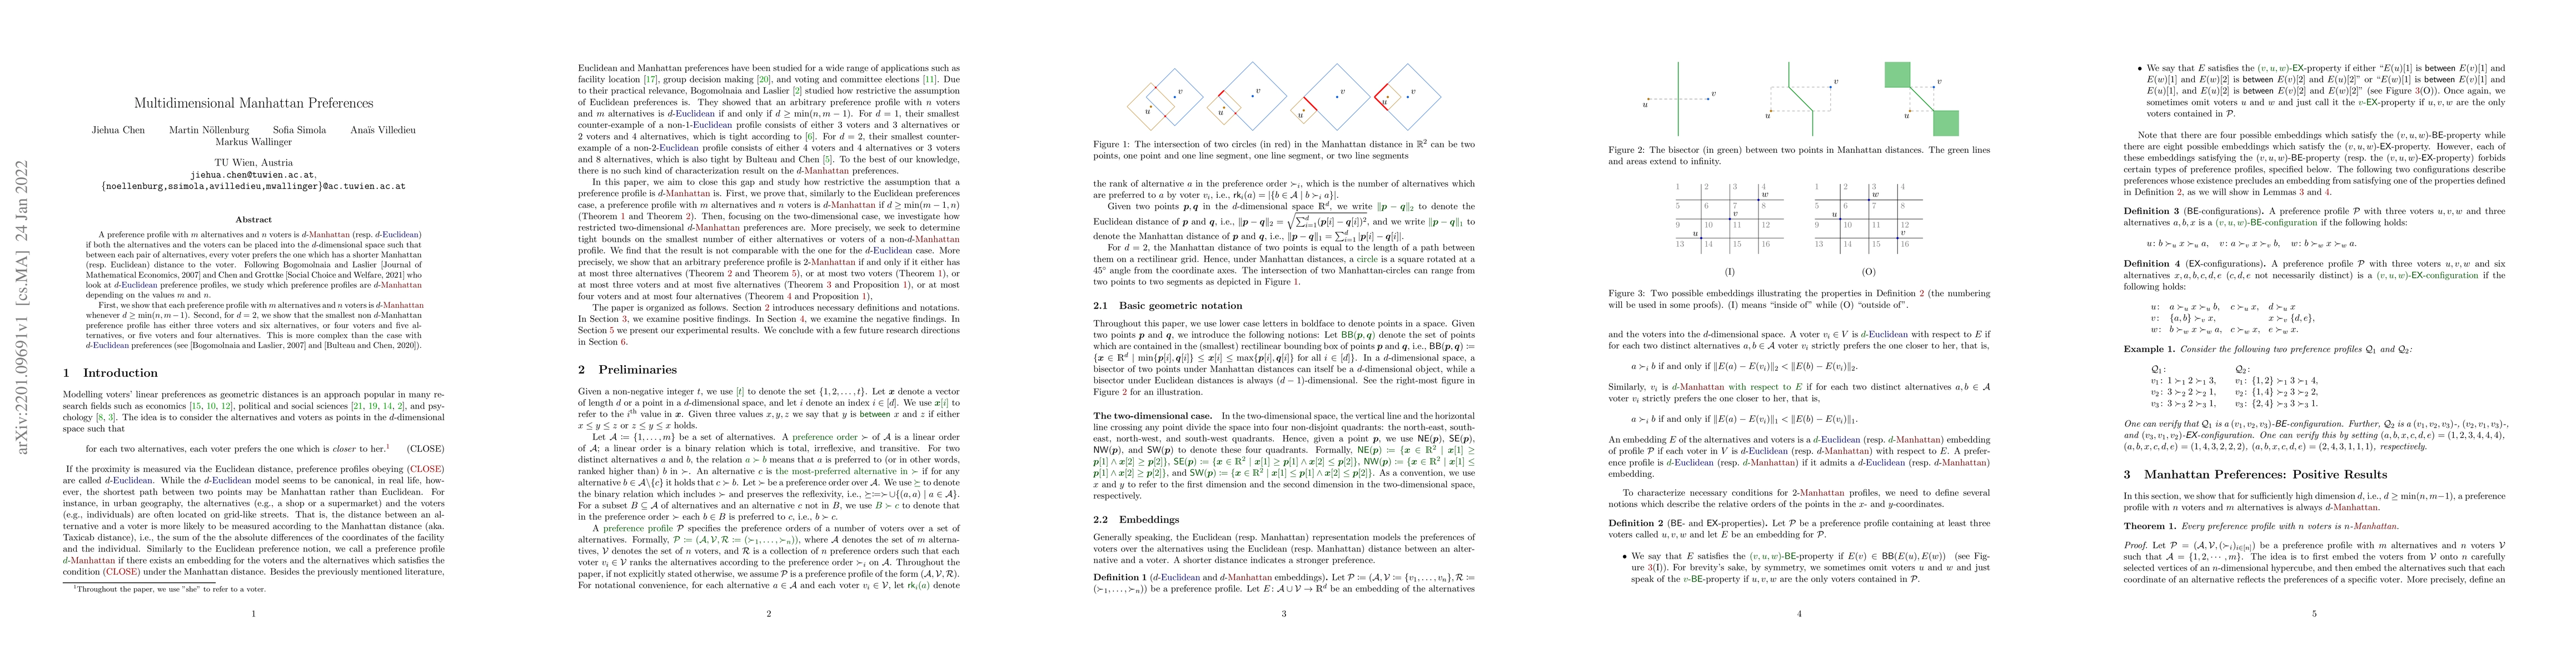
A preference profile with $m$ alternatives and $n$ voters is $d$-Manhattan (resp. $d$-Euclidean) if both the alternatives and the voters can be placed into the $d$-dimensional space such that betwee...
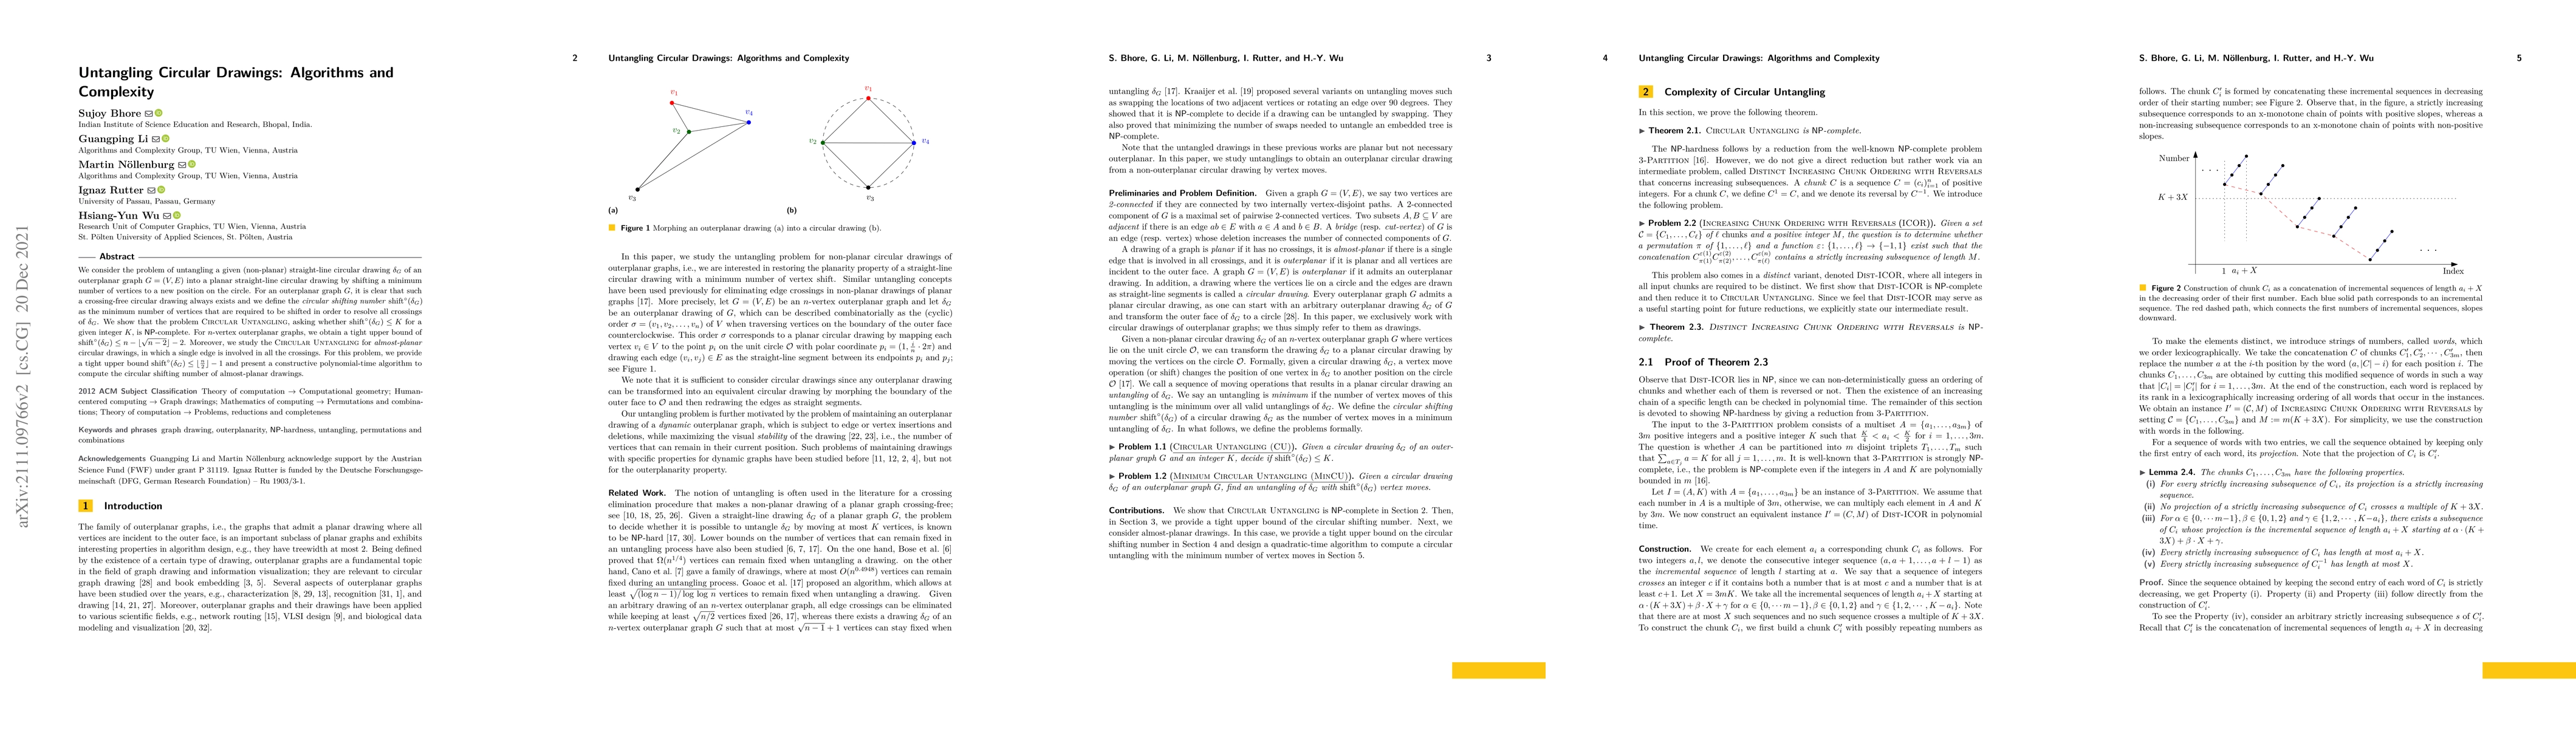
We consider the problem of untangling a given (non-planar) straight-line circular drawing $\delta_G$ of an outerplanar graph $G=(V, E)$ into a planar straight-line circular drawing by shifting a min...
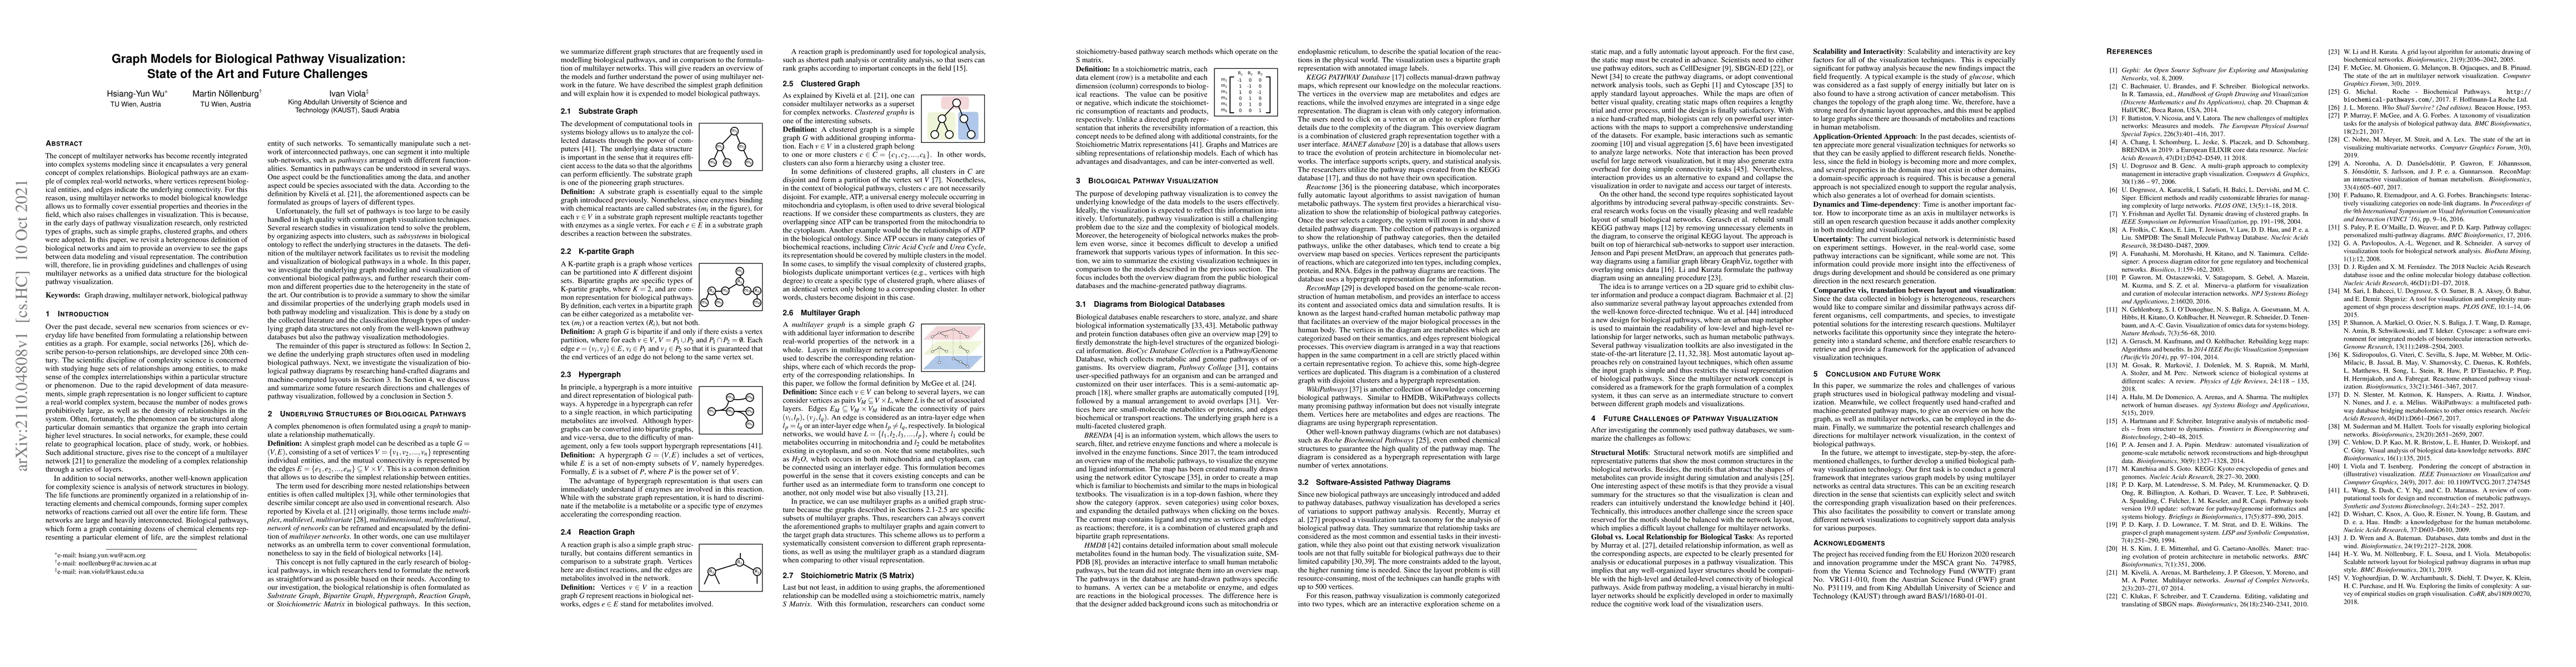
The concept of multilayer networks has become recently integrated into complex systems modeling since it encapsulates a very general concept of complex relationships. Biological pathways are an exam...
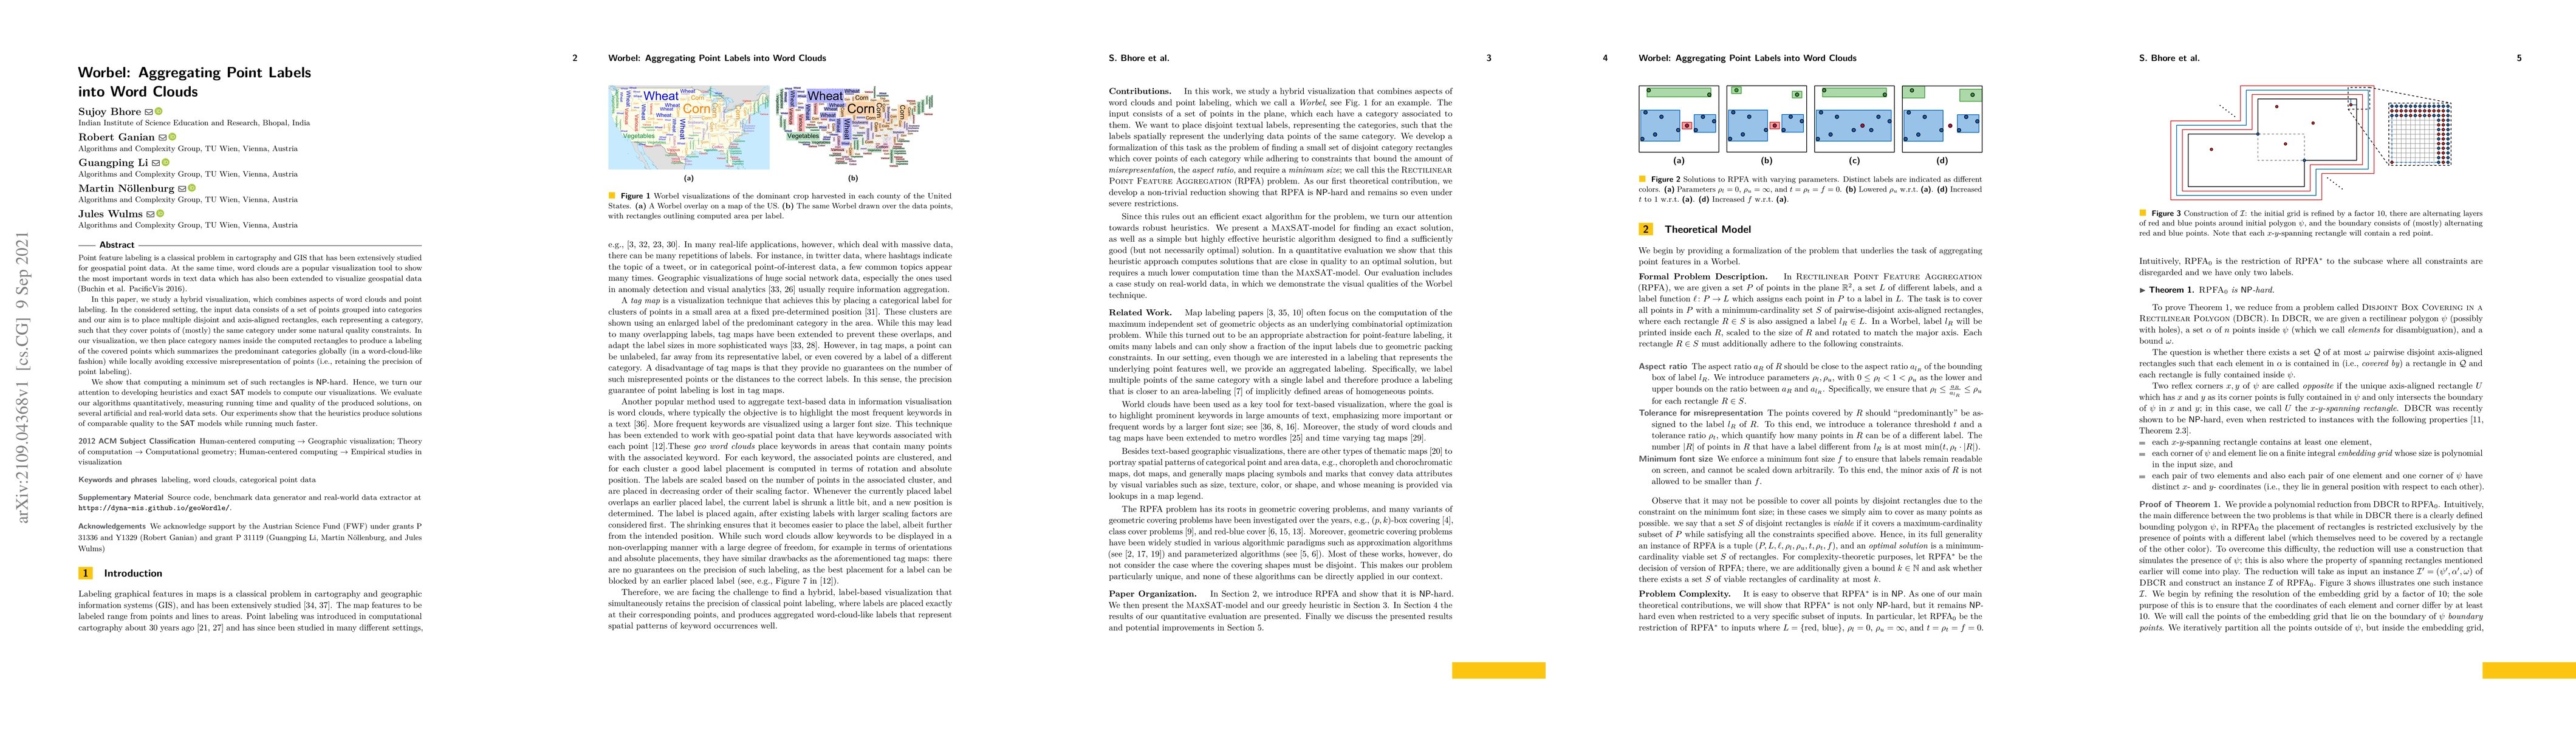
Point feature labeling is a classical problem in cartography and GIS that has been extensively studied for geospatial point data. At the same time, word clouds are a popular visualization tool to sh...
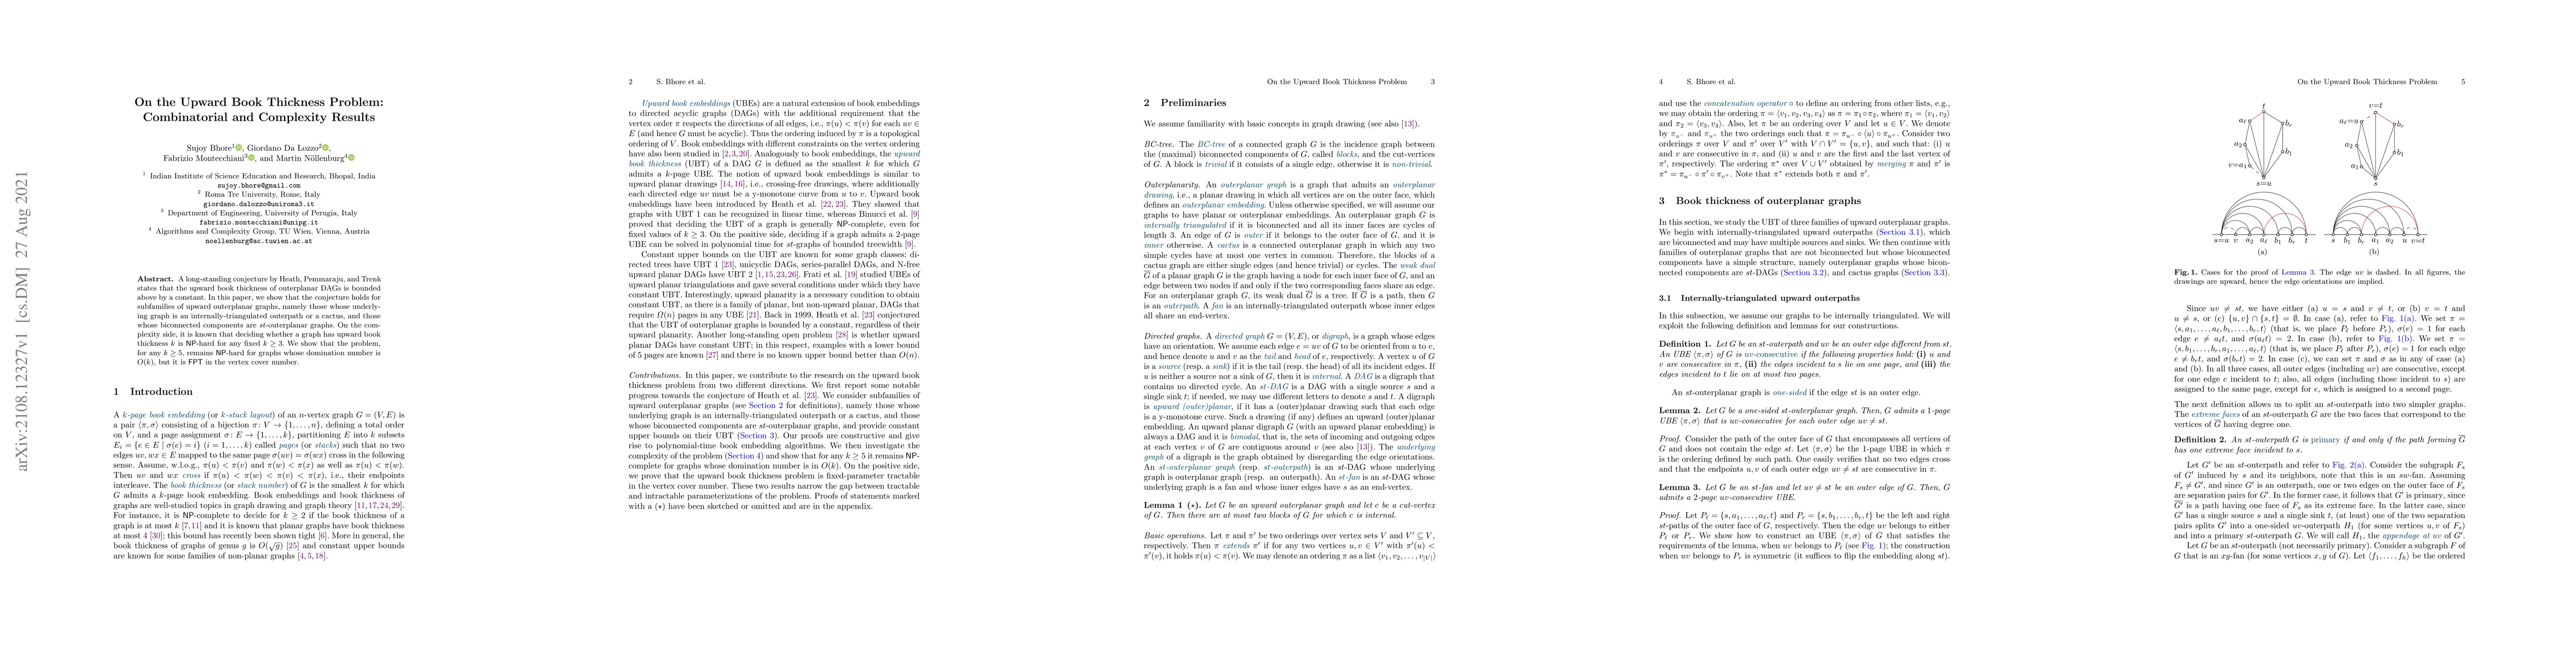
A long-standing conjecture by Heath, Pemmaraju, and Trenk states that the upward book thickness of outerplanar DAGs is bounded above by a constant. In this paper, we show that the conjecture holds f...
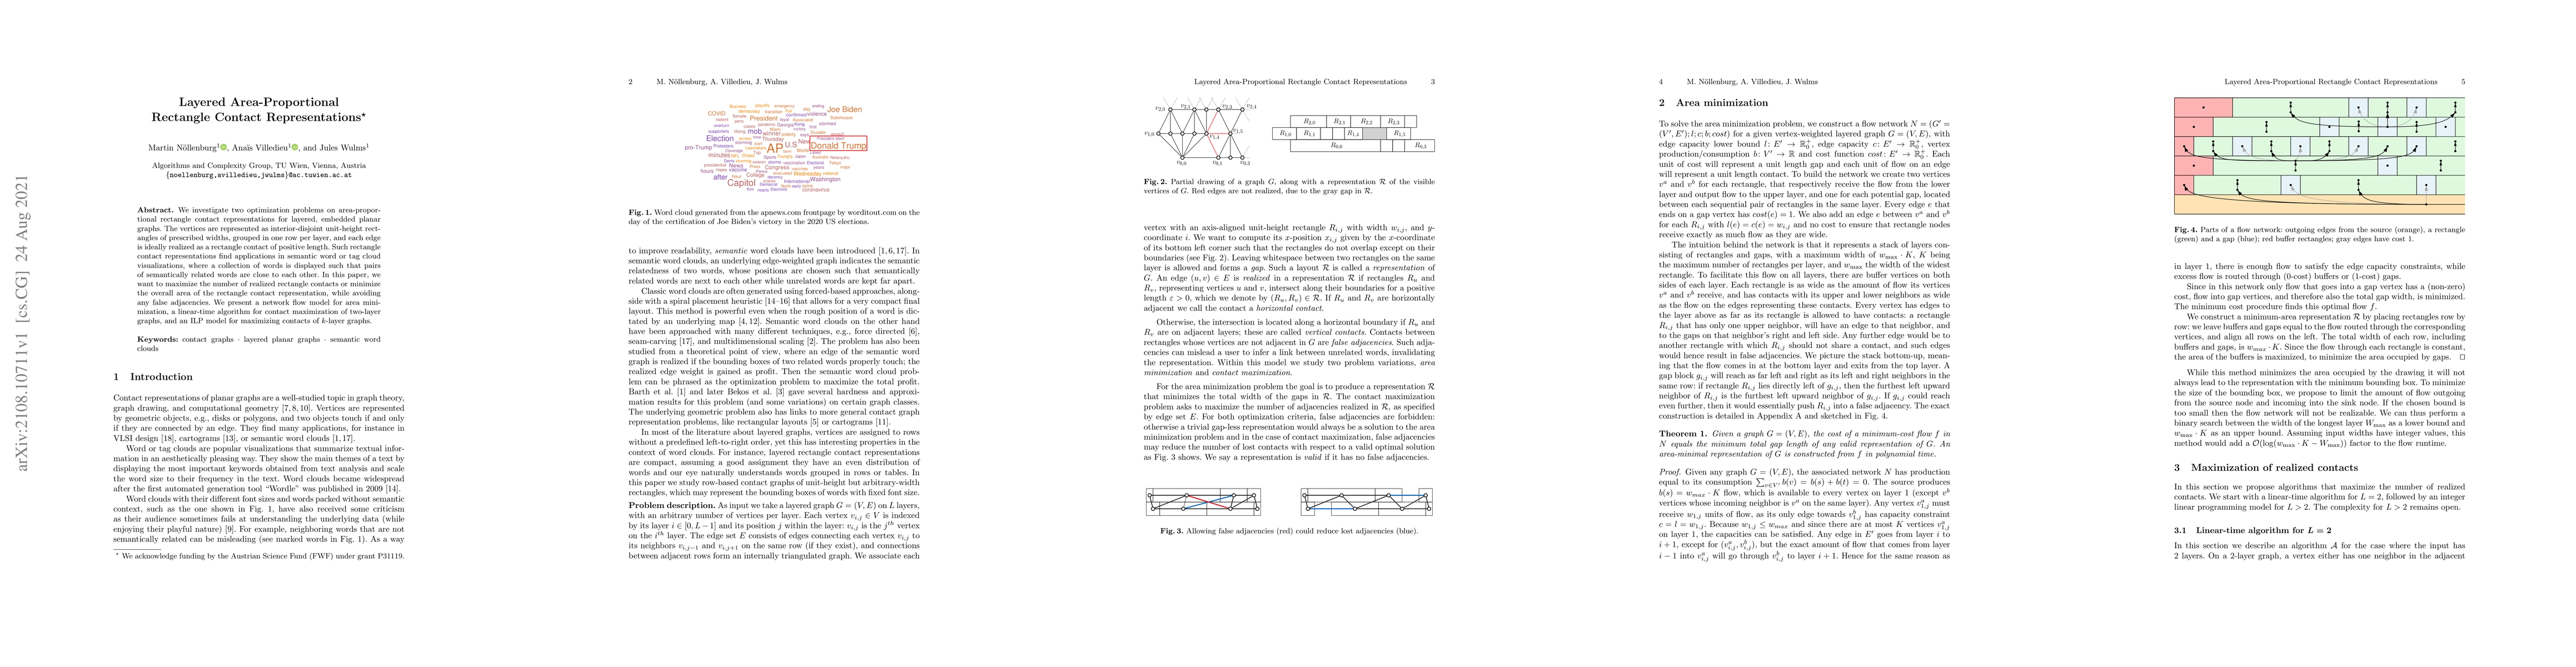
We investigate two optimization problems on area-proportional rectangle contact representations for layered, embedded planar graphs. The vertices are represented as interior-disjoint unit-height rec...
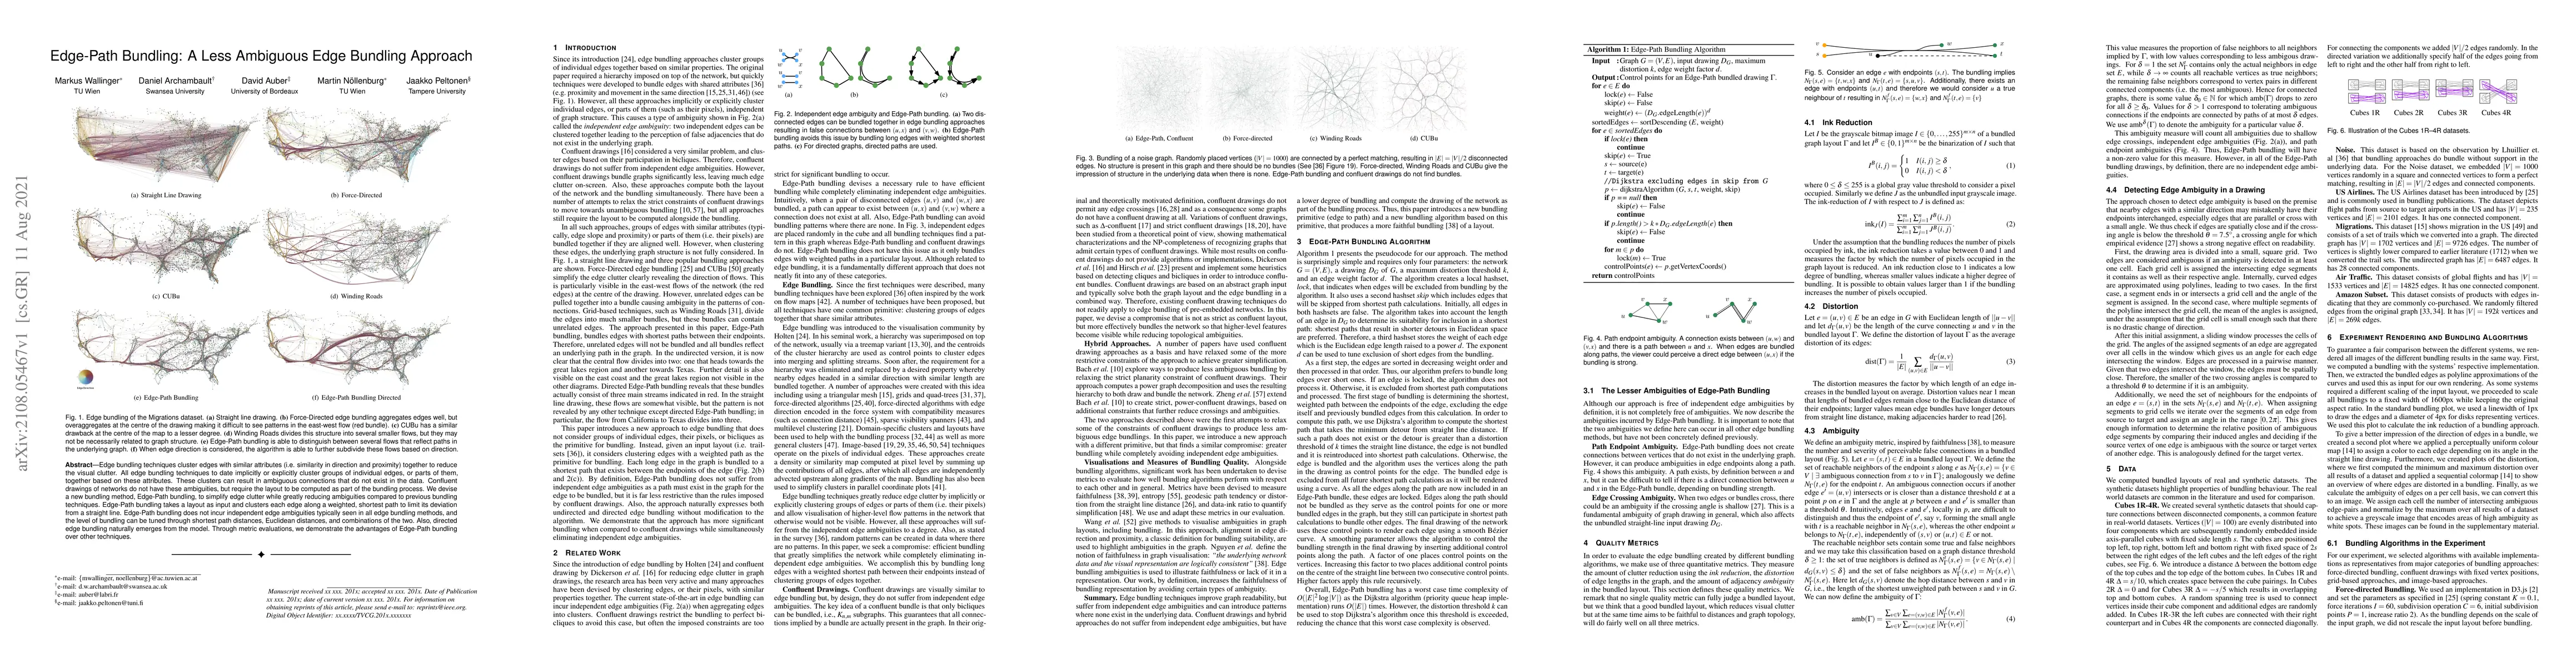
Edge bundling techniques cluster edges with similar attributes (i.e. similarity in direction and proximity) together to reduce the visual clutter. All edge bundling techniques to date implicitly or ...

A $k$-stack layout (or $k$-page book embedding) of a graph consists of a total order of the vertices, and a partition of the edges into $k$ sets of non-crossing edges with respect to the vertex orde...
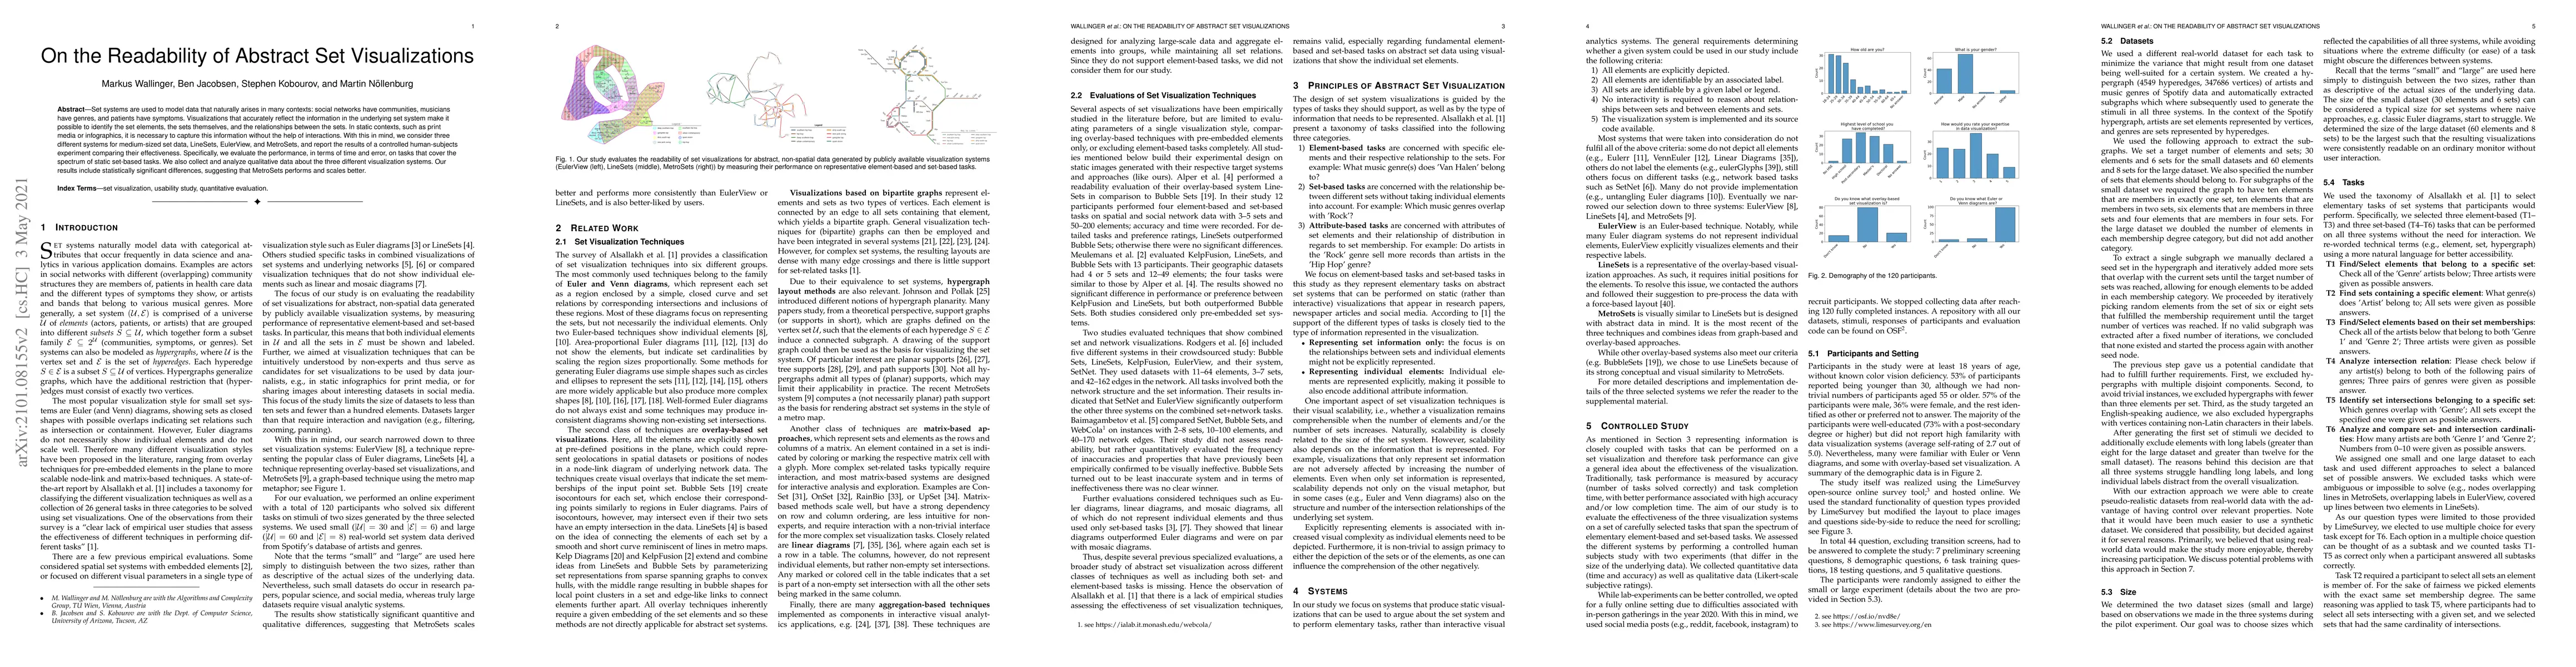
Set systems are used to model data that naturally arises in many contexts: social networks have communities, musicians have genres, and patients have symptoms. Visualizations that accurately reflect...
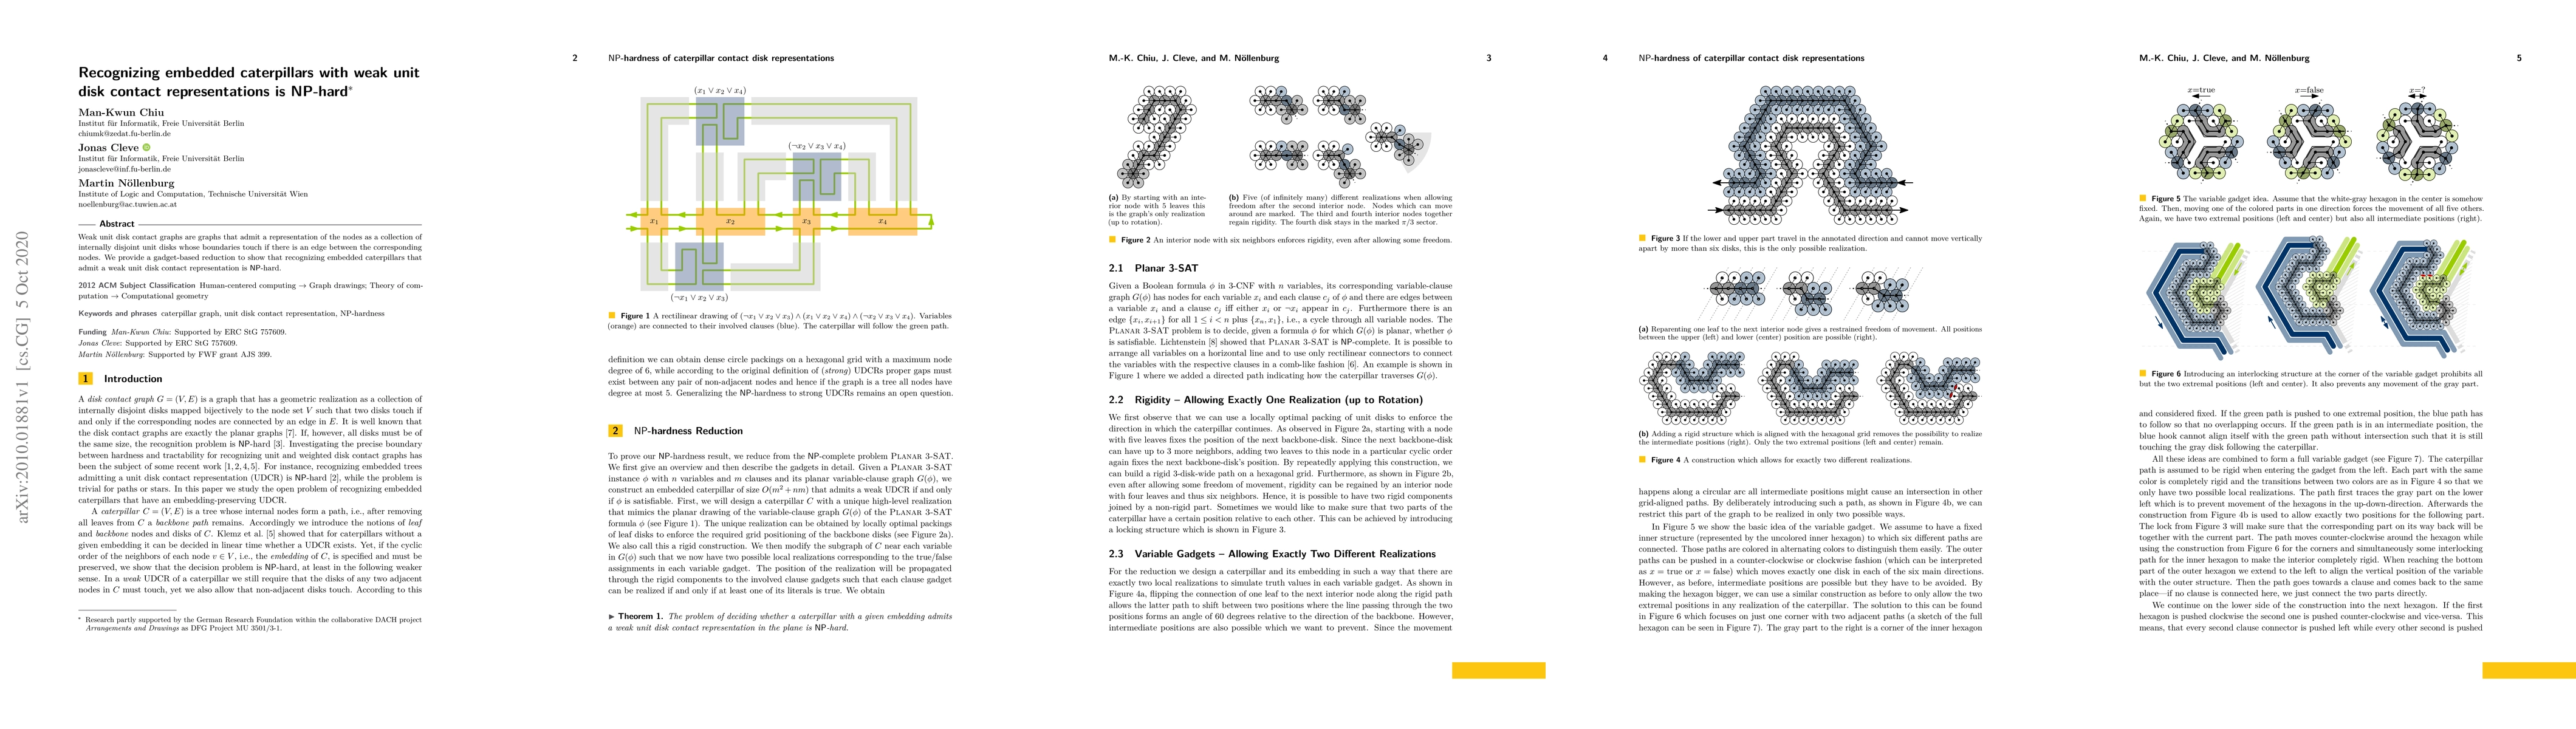
Weak unit disk contact graphs are graphs that admit a representation of the nodes as a collection of internally disjoint unit disks whose boundaries touch if there is an edge between the correspondi...
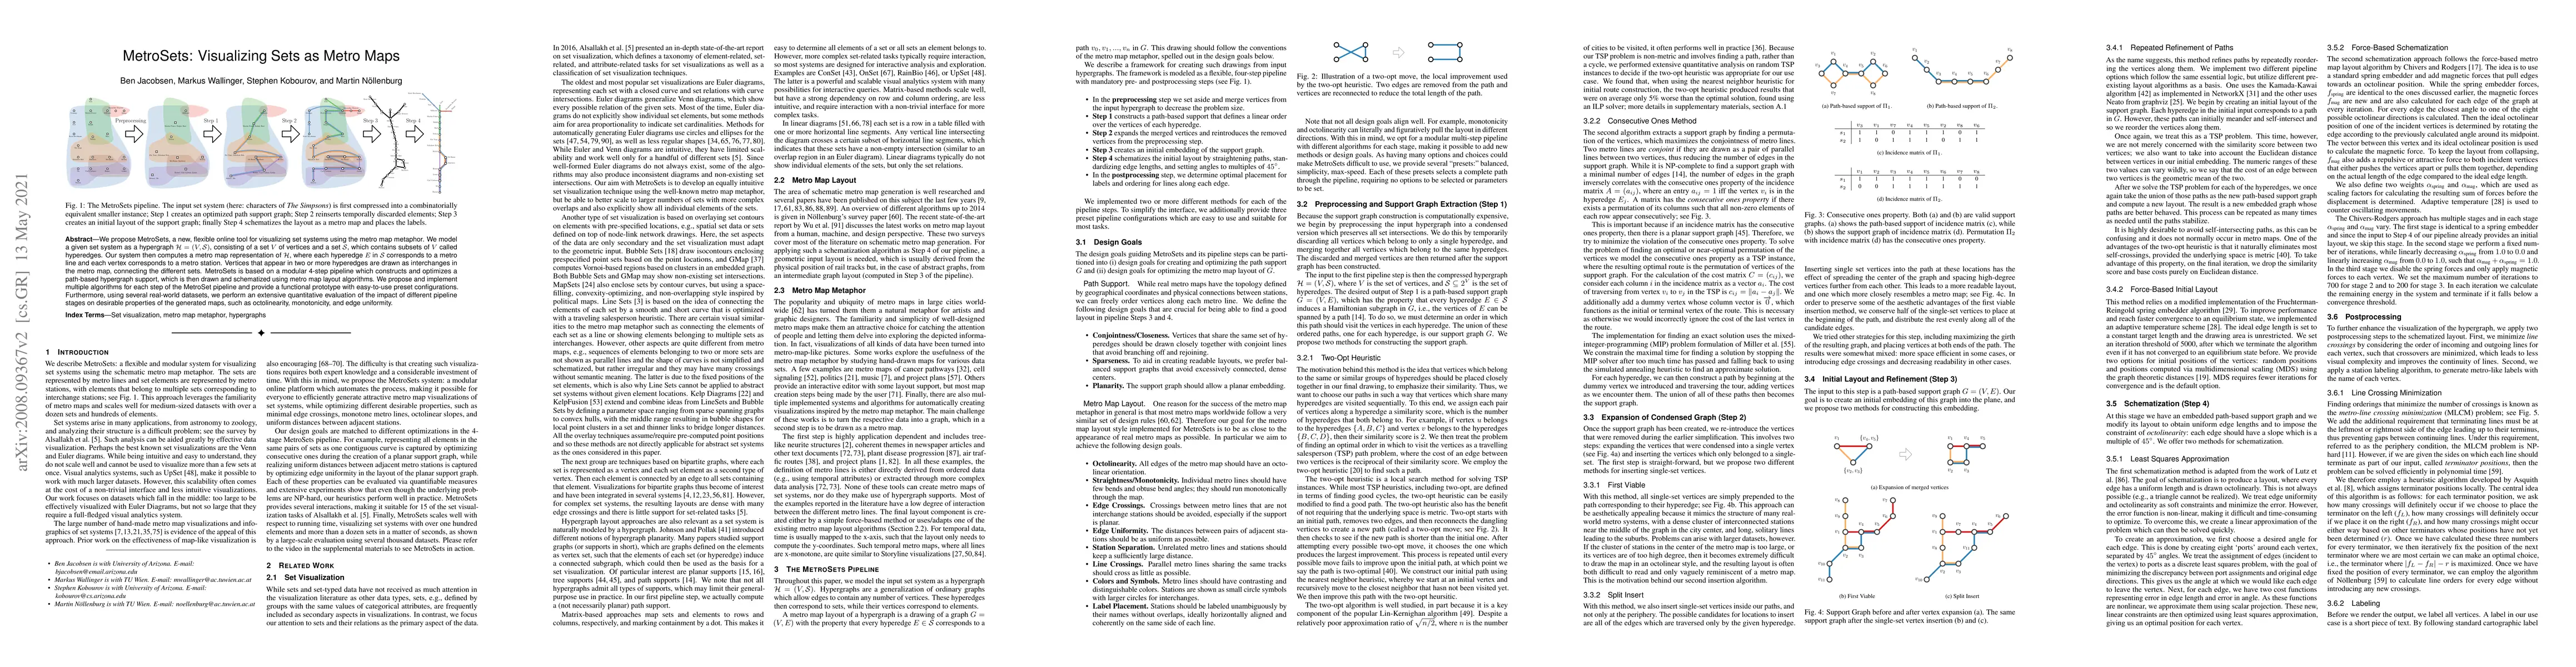
We propose MetroSets, a new, flexible online tool for visualizing set systems using the metro map metaphor. We model a given set system as a hypergraph $\mathcal{H} = (V, \mathcal{S})$, consisting o...
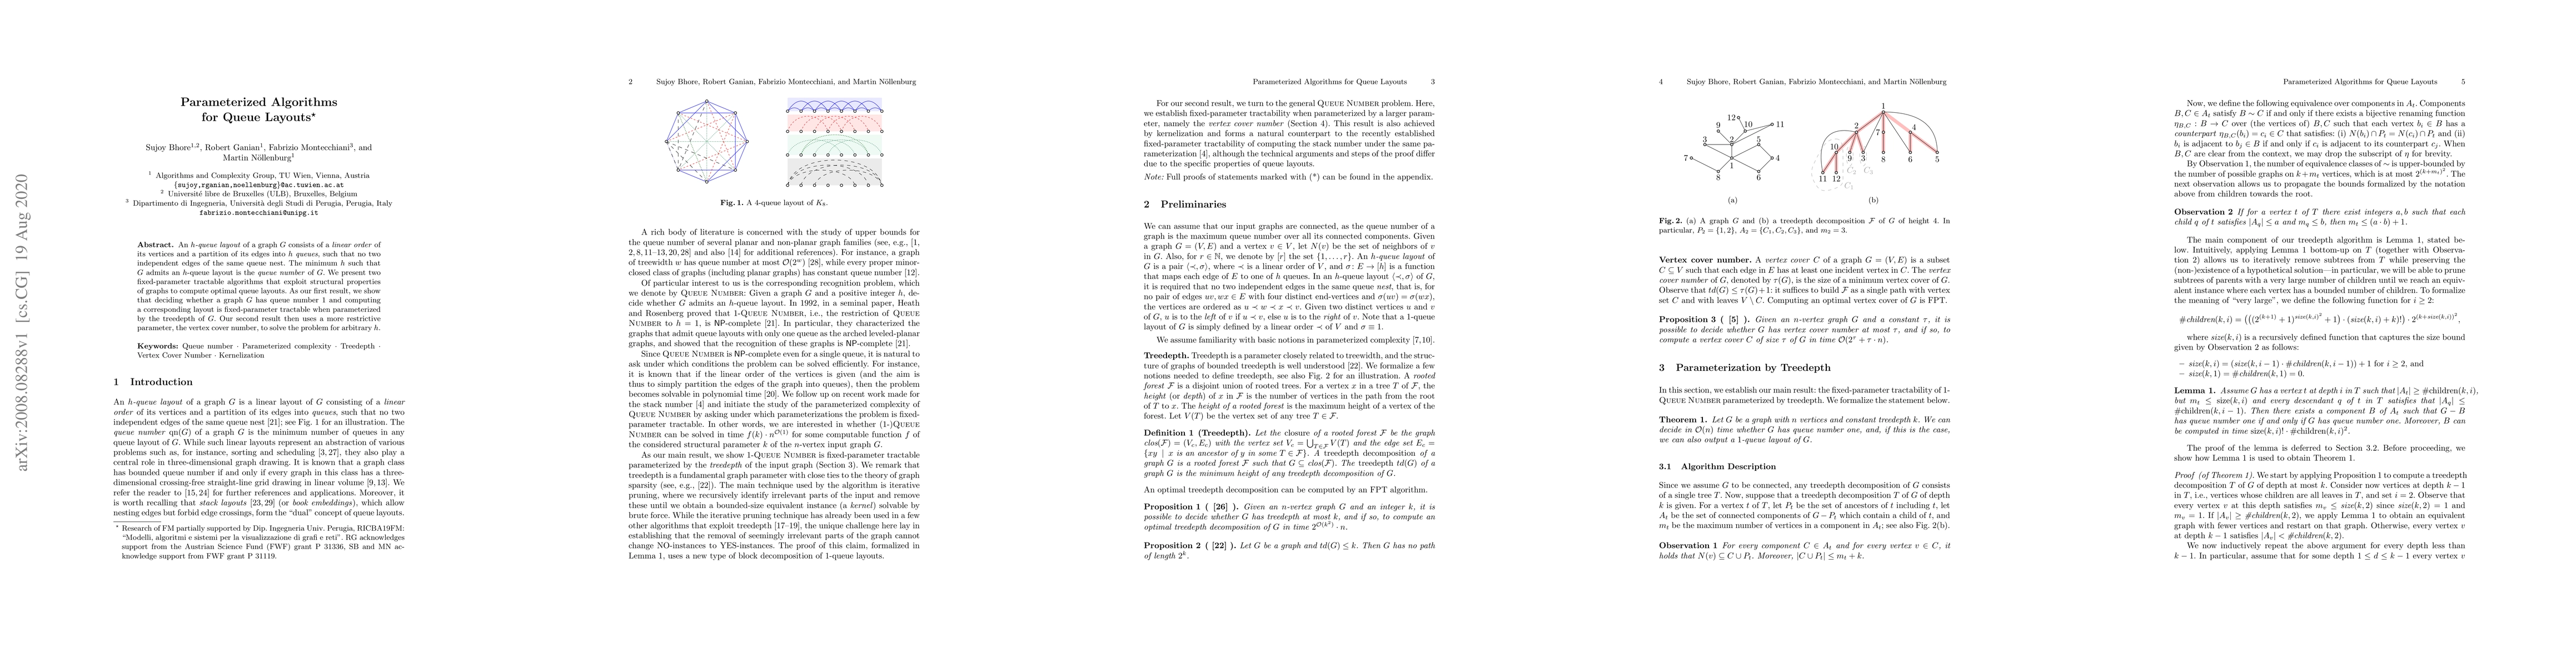
An $h$-queue layout of a graph $G$ consists of a linear order of its vertices and a partition of its edges into $h$ queues, such that no two independent edges of the same queue nest. The minimum $h$...
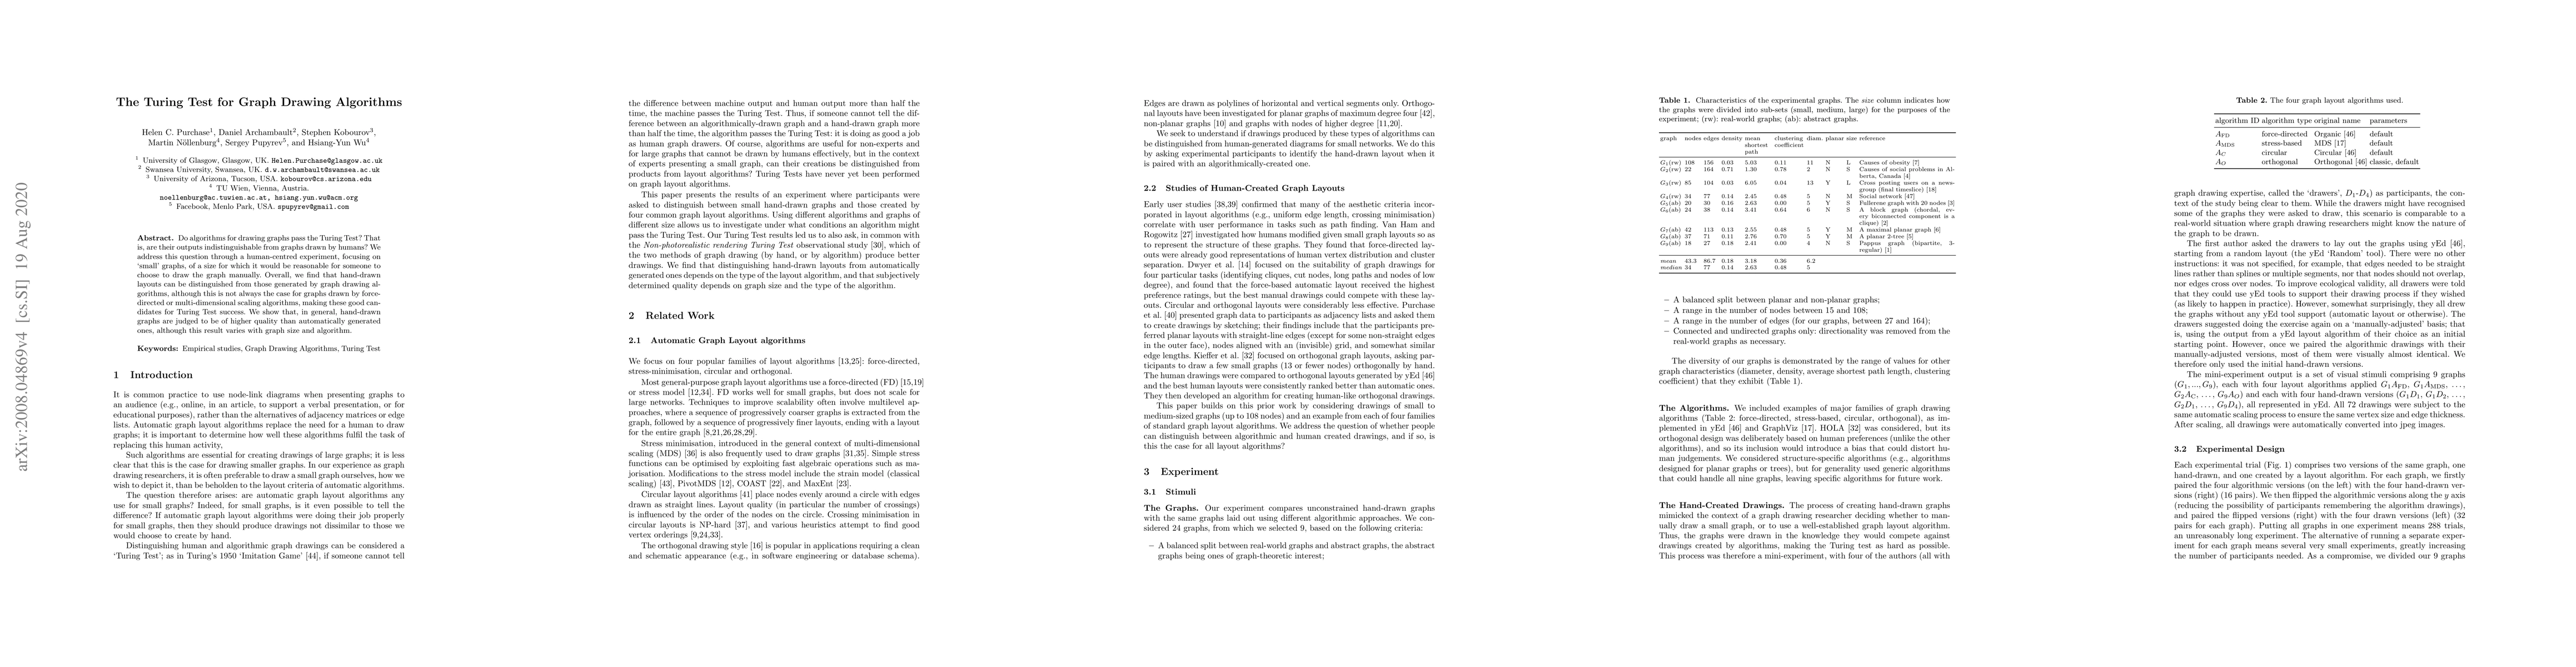
Do algorithms for drawing graphs pass the Turing Test? That is, are their outputs indistinguishable from graphs drawn by humans? We address this question through a human-centred experiment, focusing...
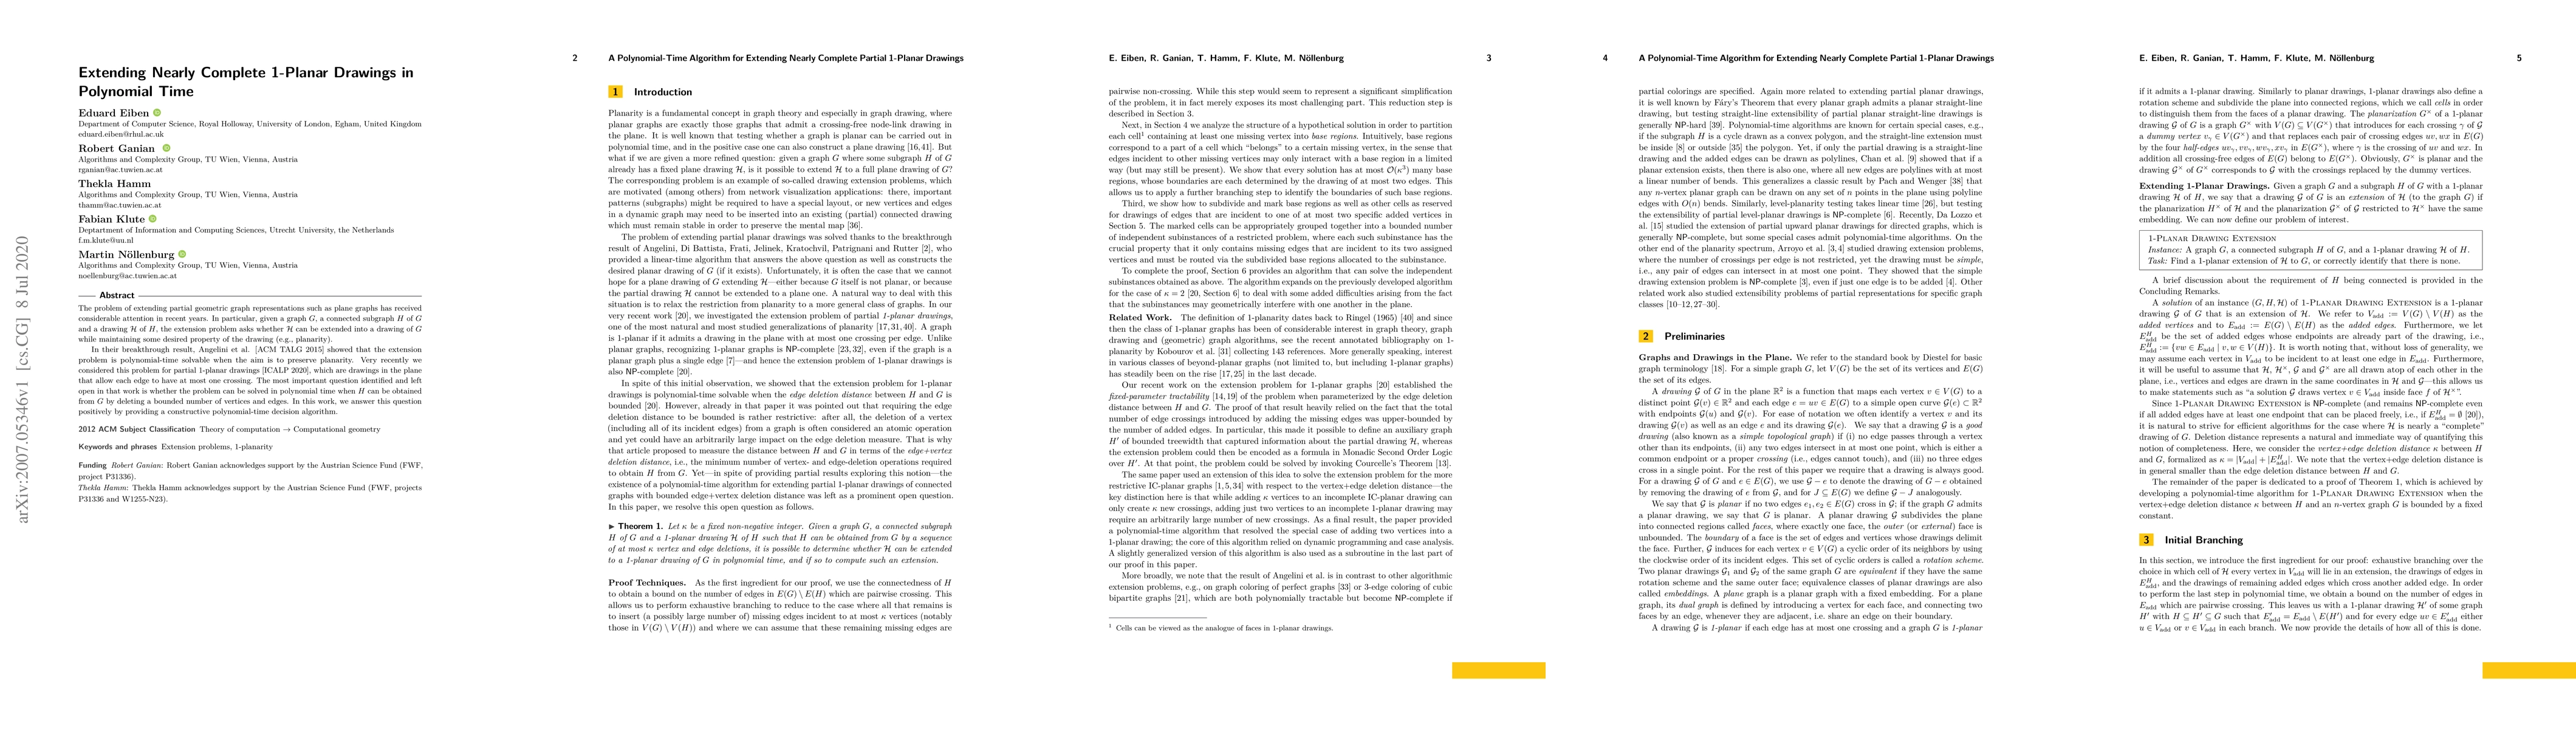
The problem of extending partial geometric graph representations such as plane graphs has received considerable attention in recent years. In particular, given a graph $G$, a connected subgraph $H$ ...
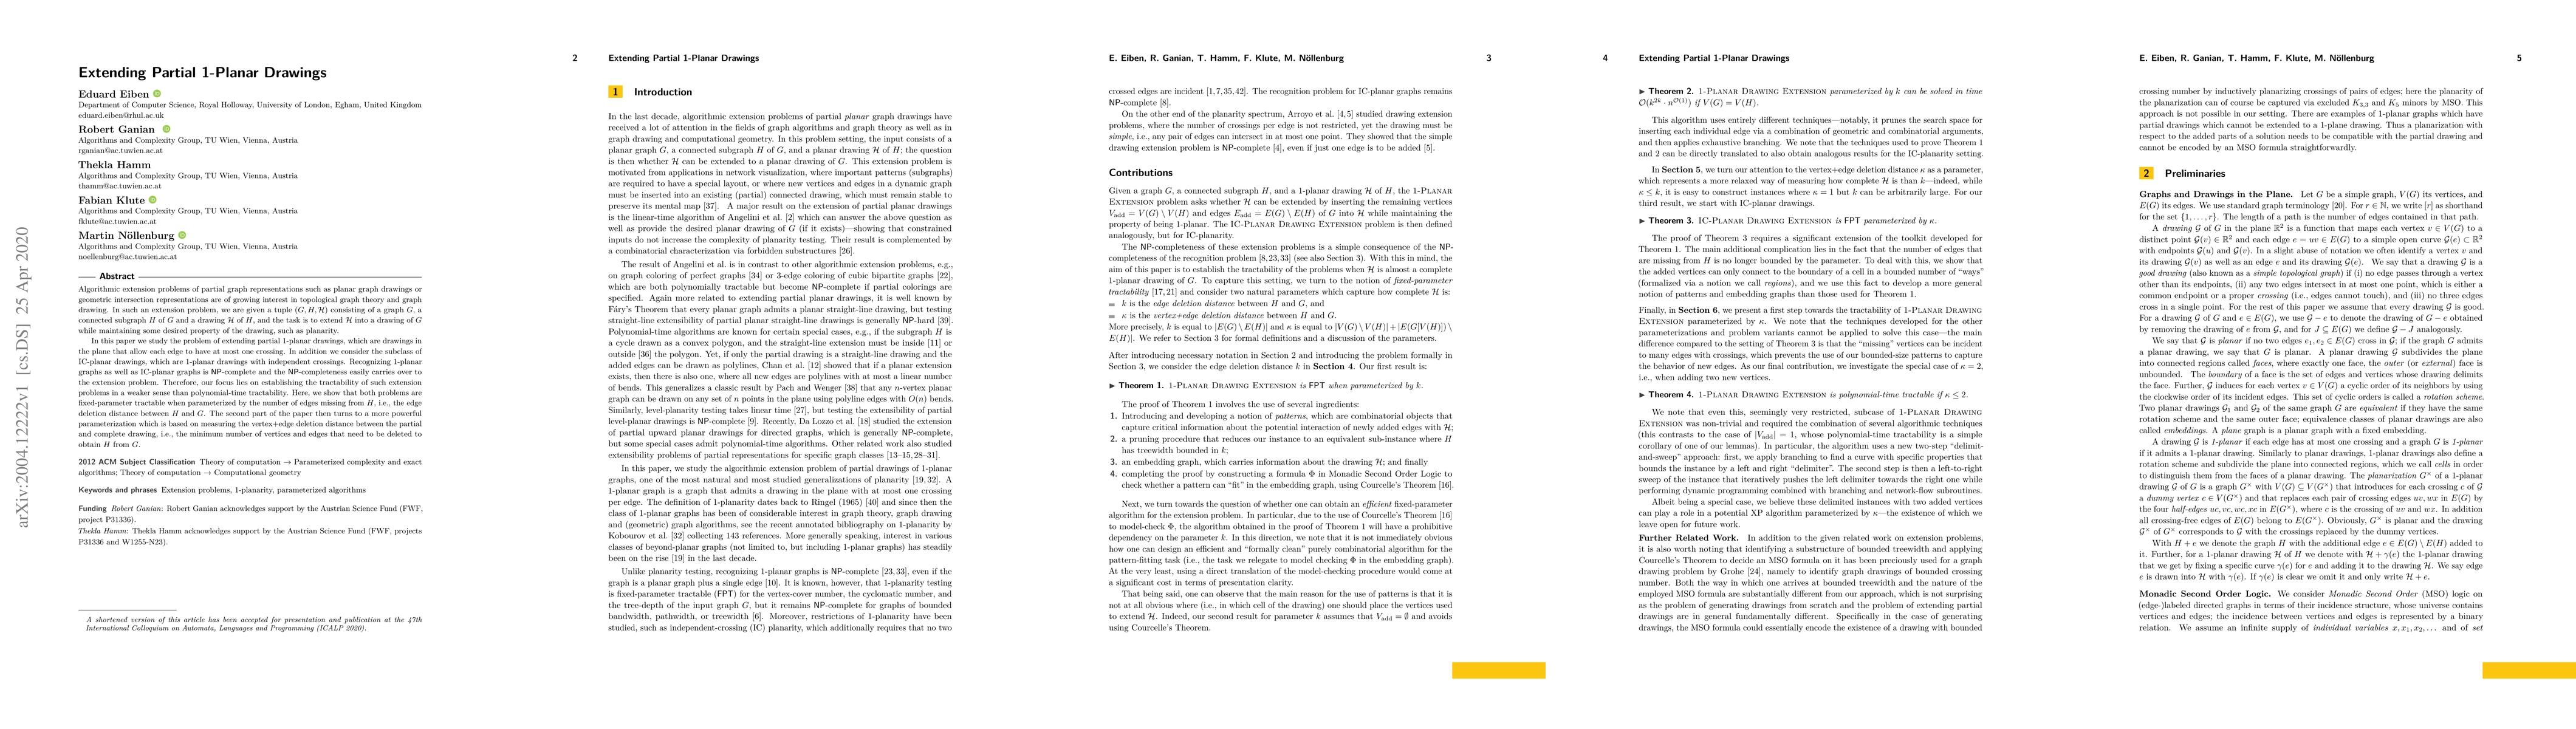
Algorithmic extension problems of partial graph representations such as planar graph drawings or geometric intersection representations are of growing interest in topological graph theory and graph ...
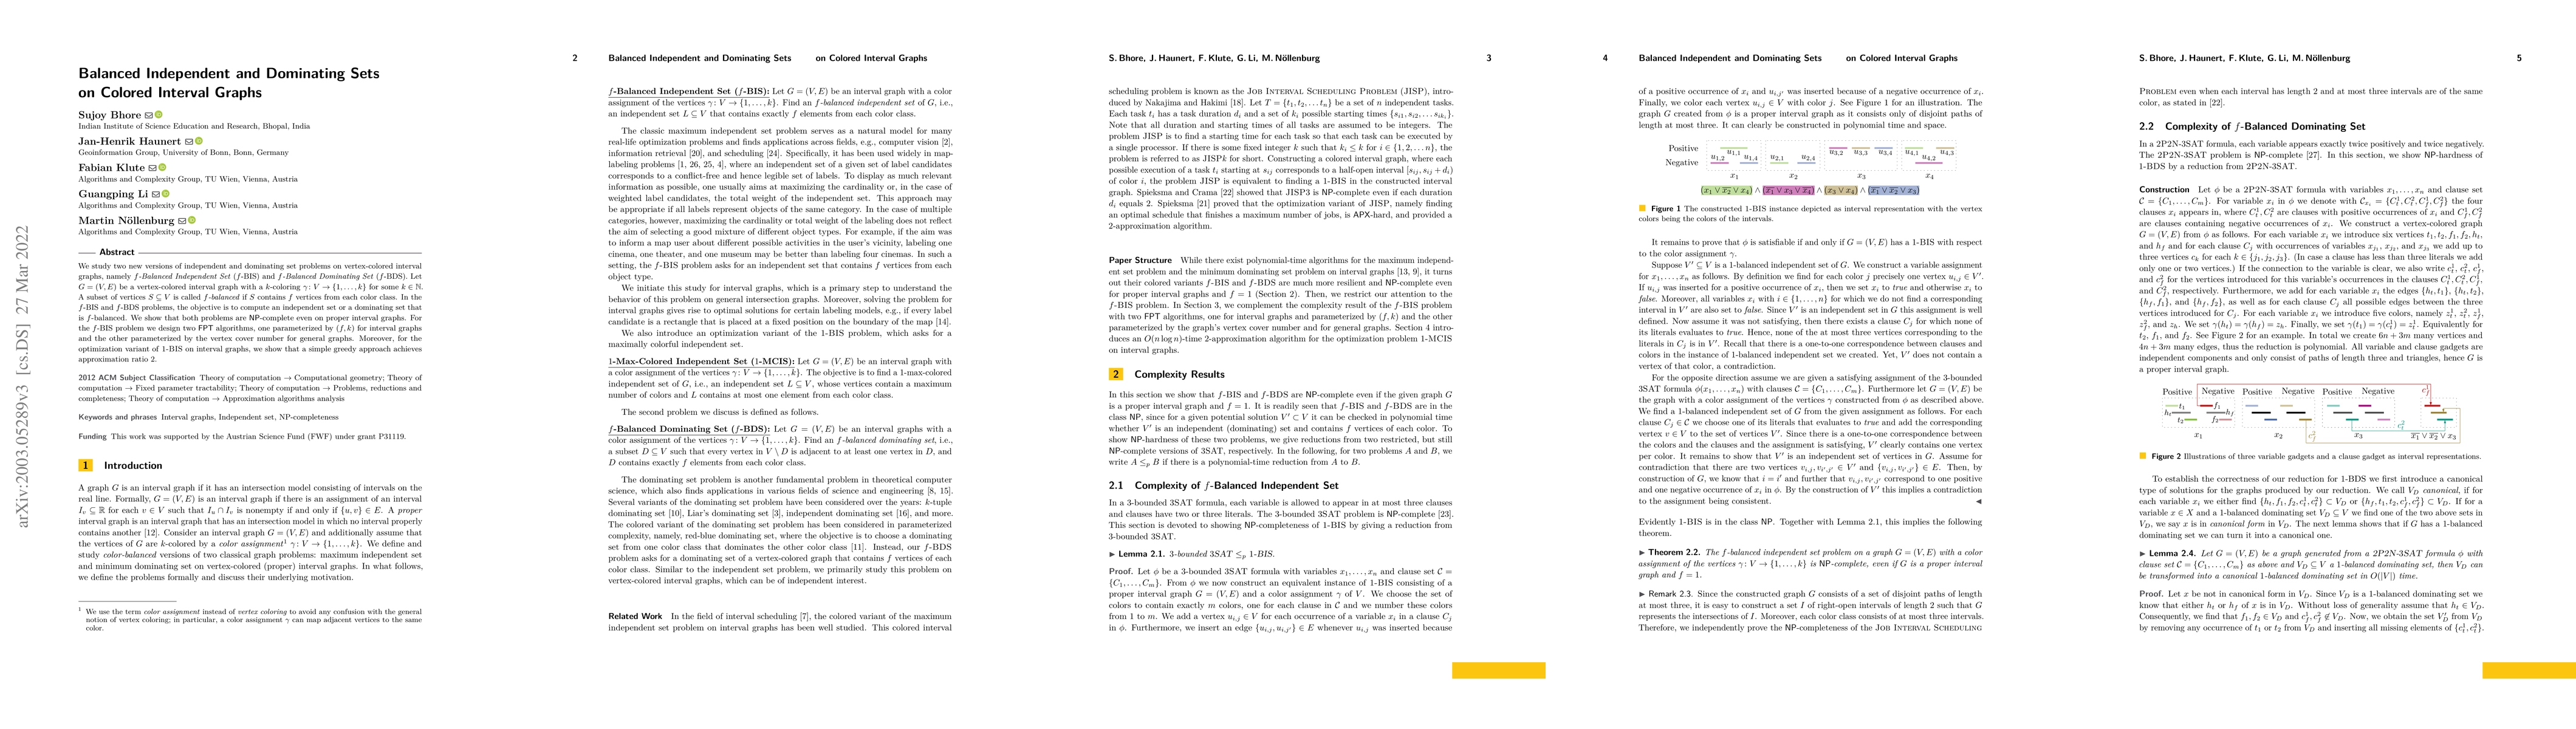
We study two new versions of independent and dominating set problems on vertex-colored interval graphs, namely $f$-Balanced Independent Set ($f$-BIS) and $f$-Balanced Dominating Set ($f$-BDS). Let $...
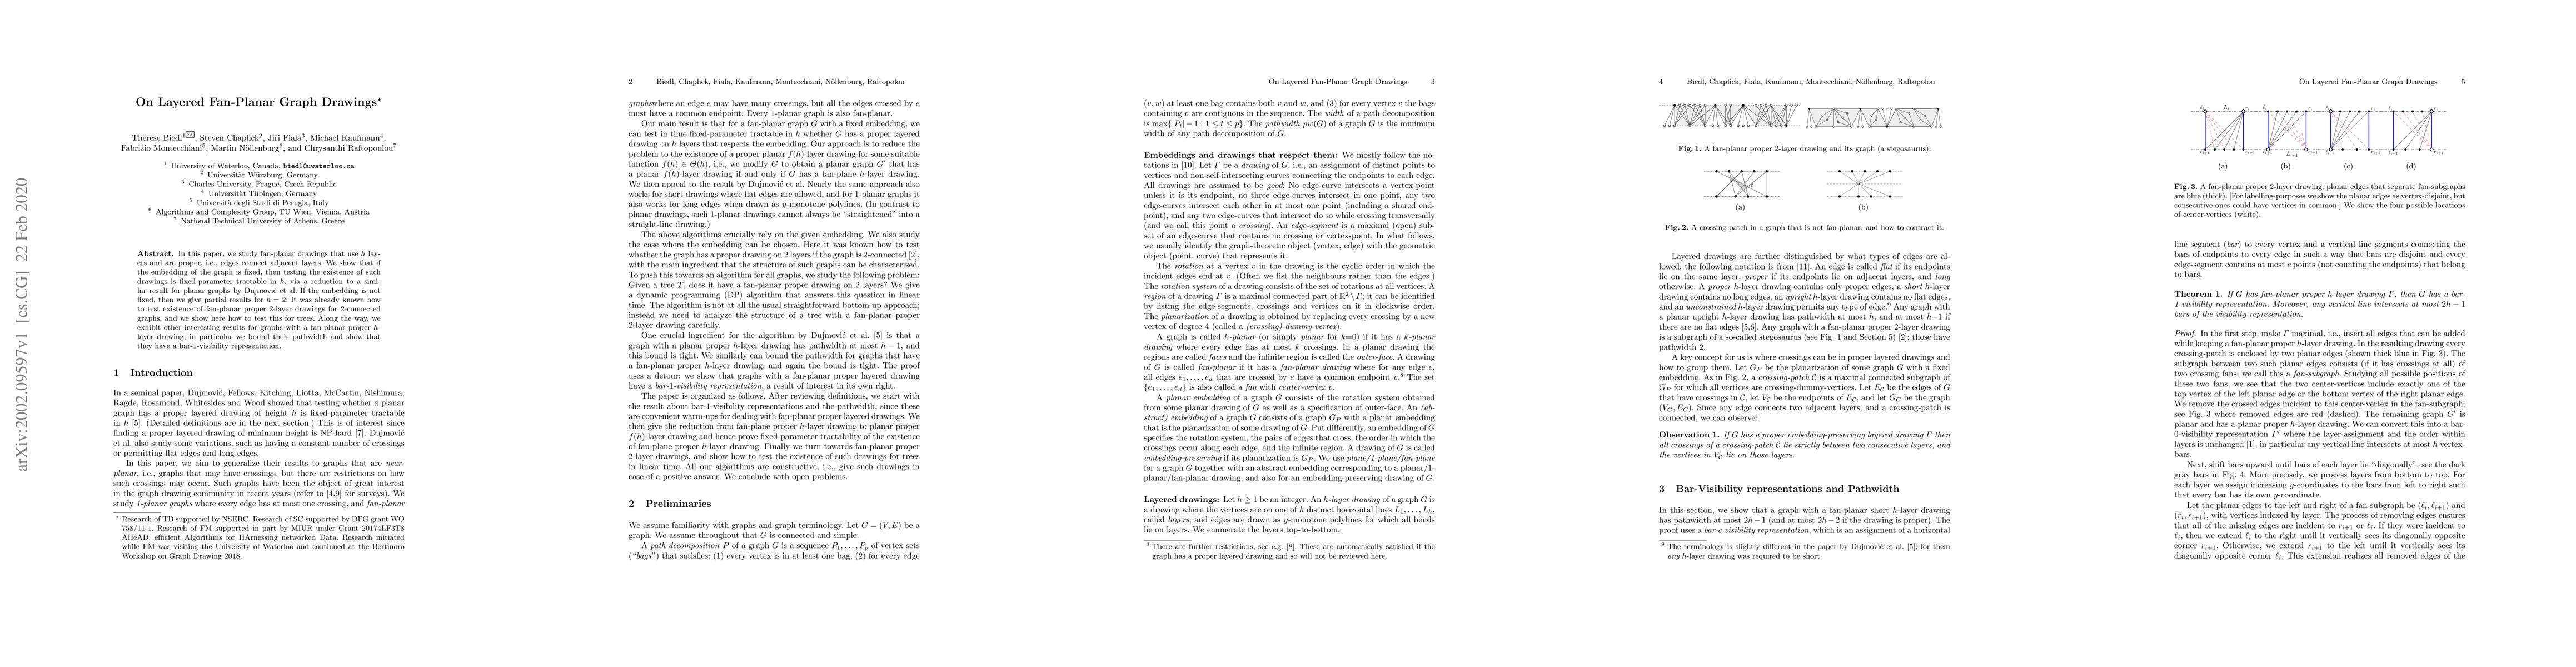
In this paper, we study fan-planar drawings that use $h$ layers and are proper, i.e., edges connect adjacent layers. We show that if the embedding of the graph is fixed, then testing the existence o...
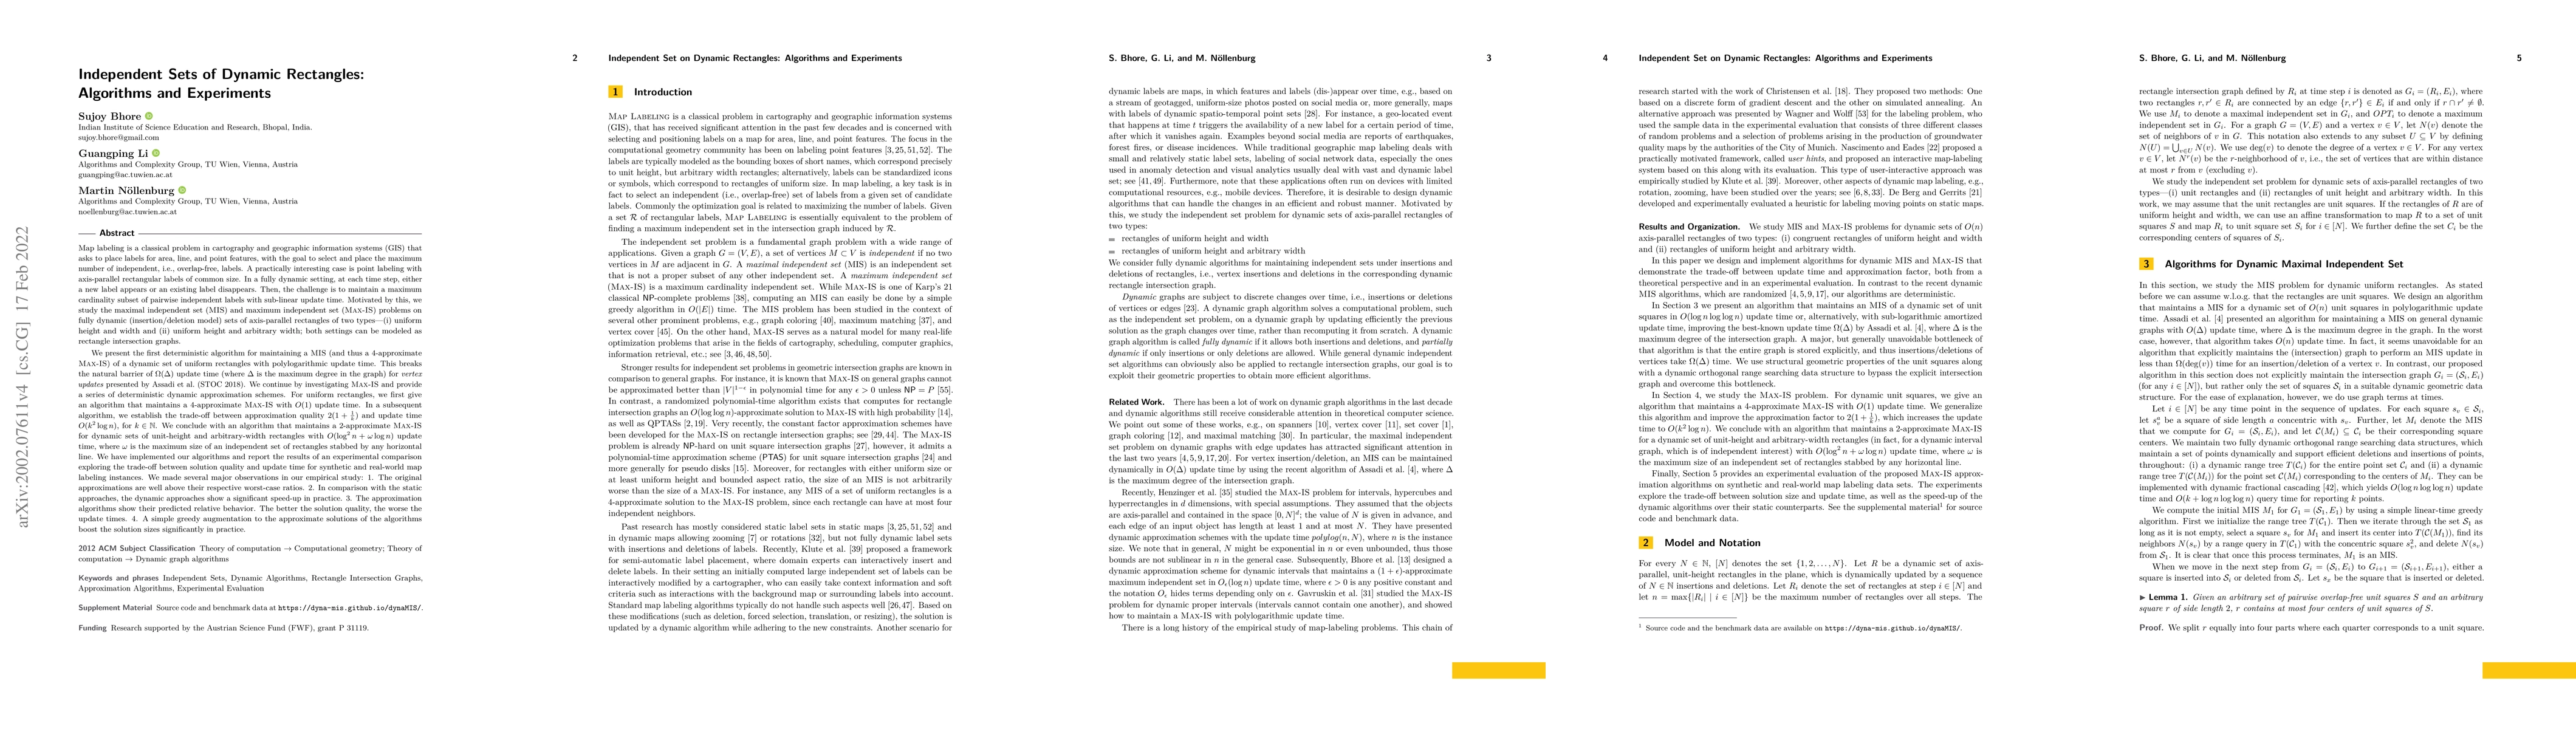
Map labeling is a classical problem in cartography and geographic information systems (GIS) that asks to place labels for area, line, and point features, with the goal to select and place the maximu...
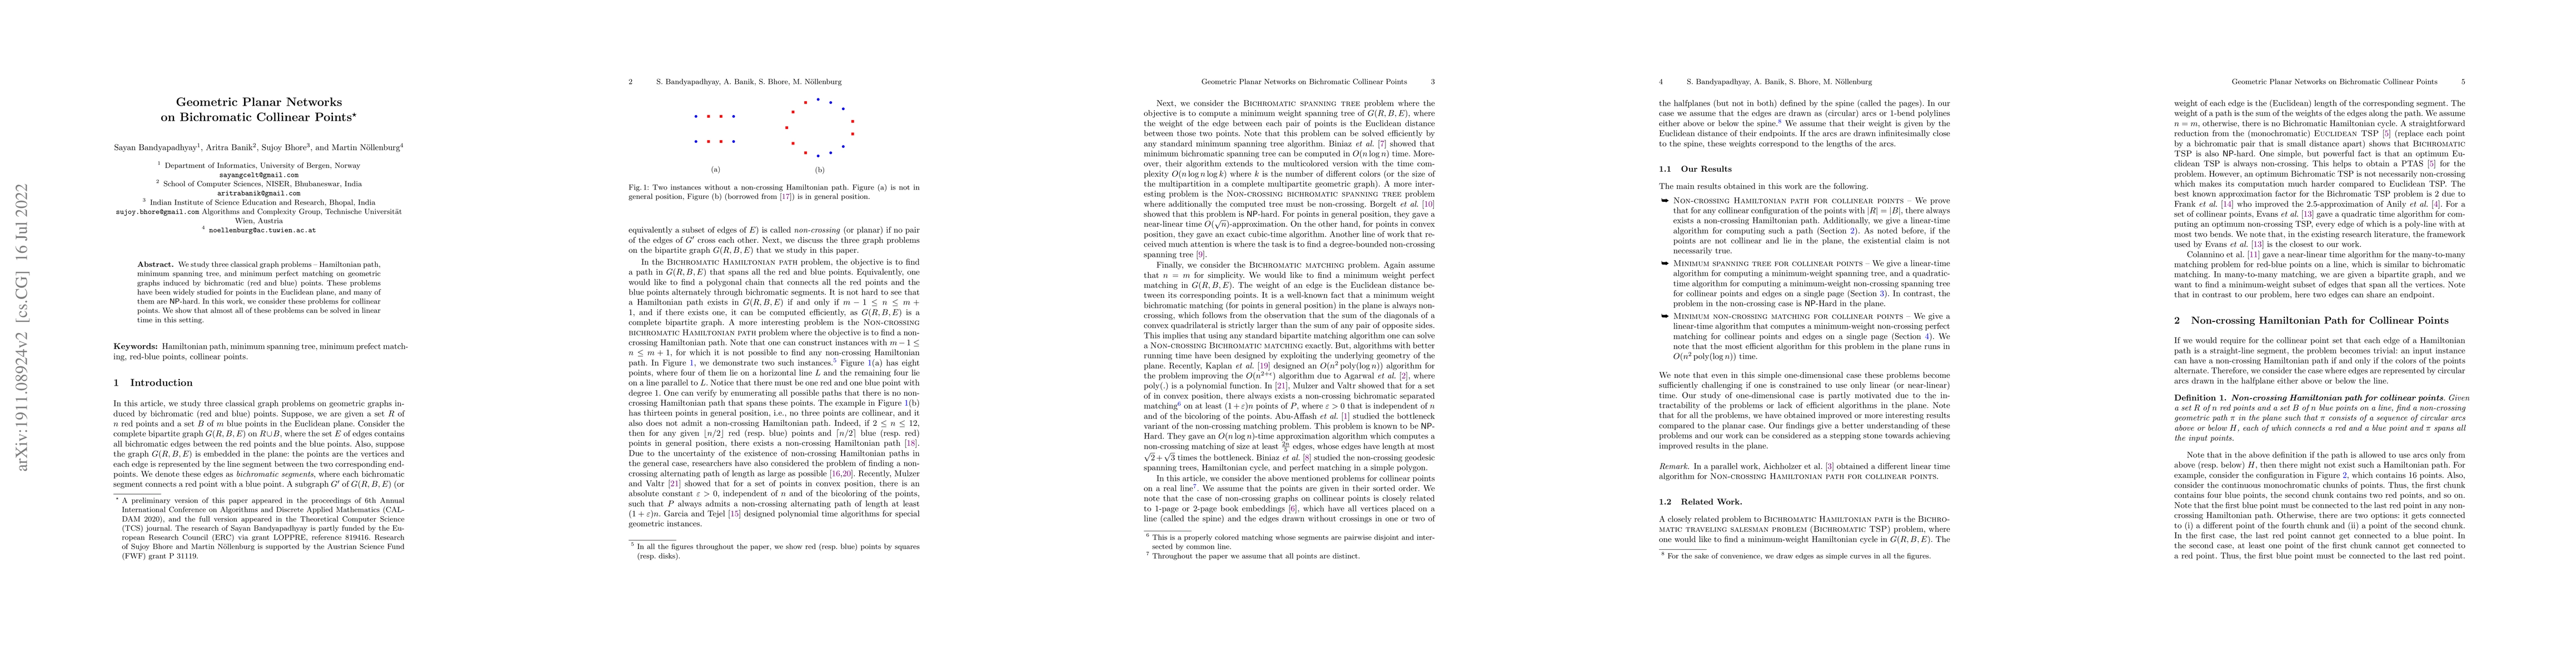
We study three classical graph problems - Hamiltonian path, minimum spanning tree, and minimum perfect matching on geometric graphs induced by bichromatic (red and blue) points. These problems have ...
Label placement in maps is a very challenging task that is critical for the overall map quality. Most previous work focused on designing and implementing fully automatic solutions, but the resulting...
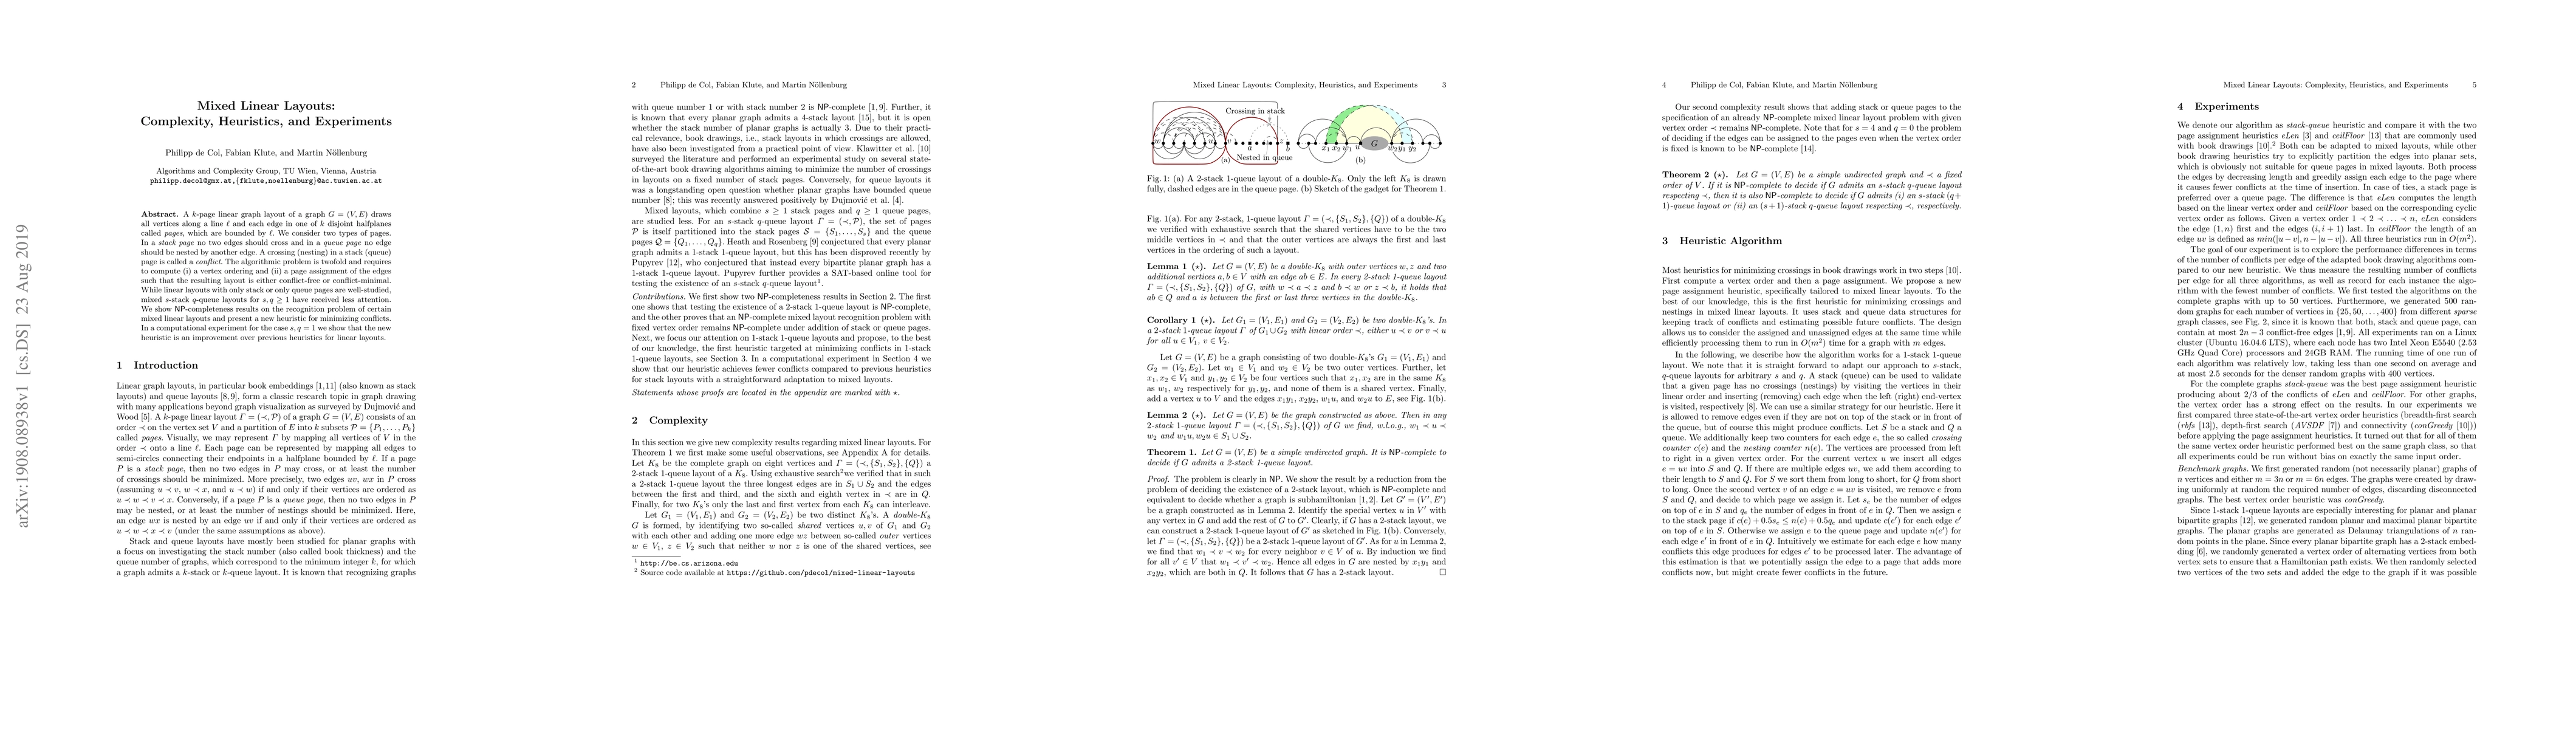
A $k$-page linear graph layout of a graph $G = (V,E)$ draws all vertices along a line $\ell$ and each edge in one of $k$ disjoint halfplanes called pages, which are bounded by $\ell$. We consider tw...
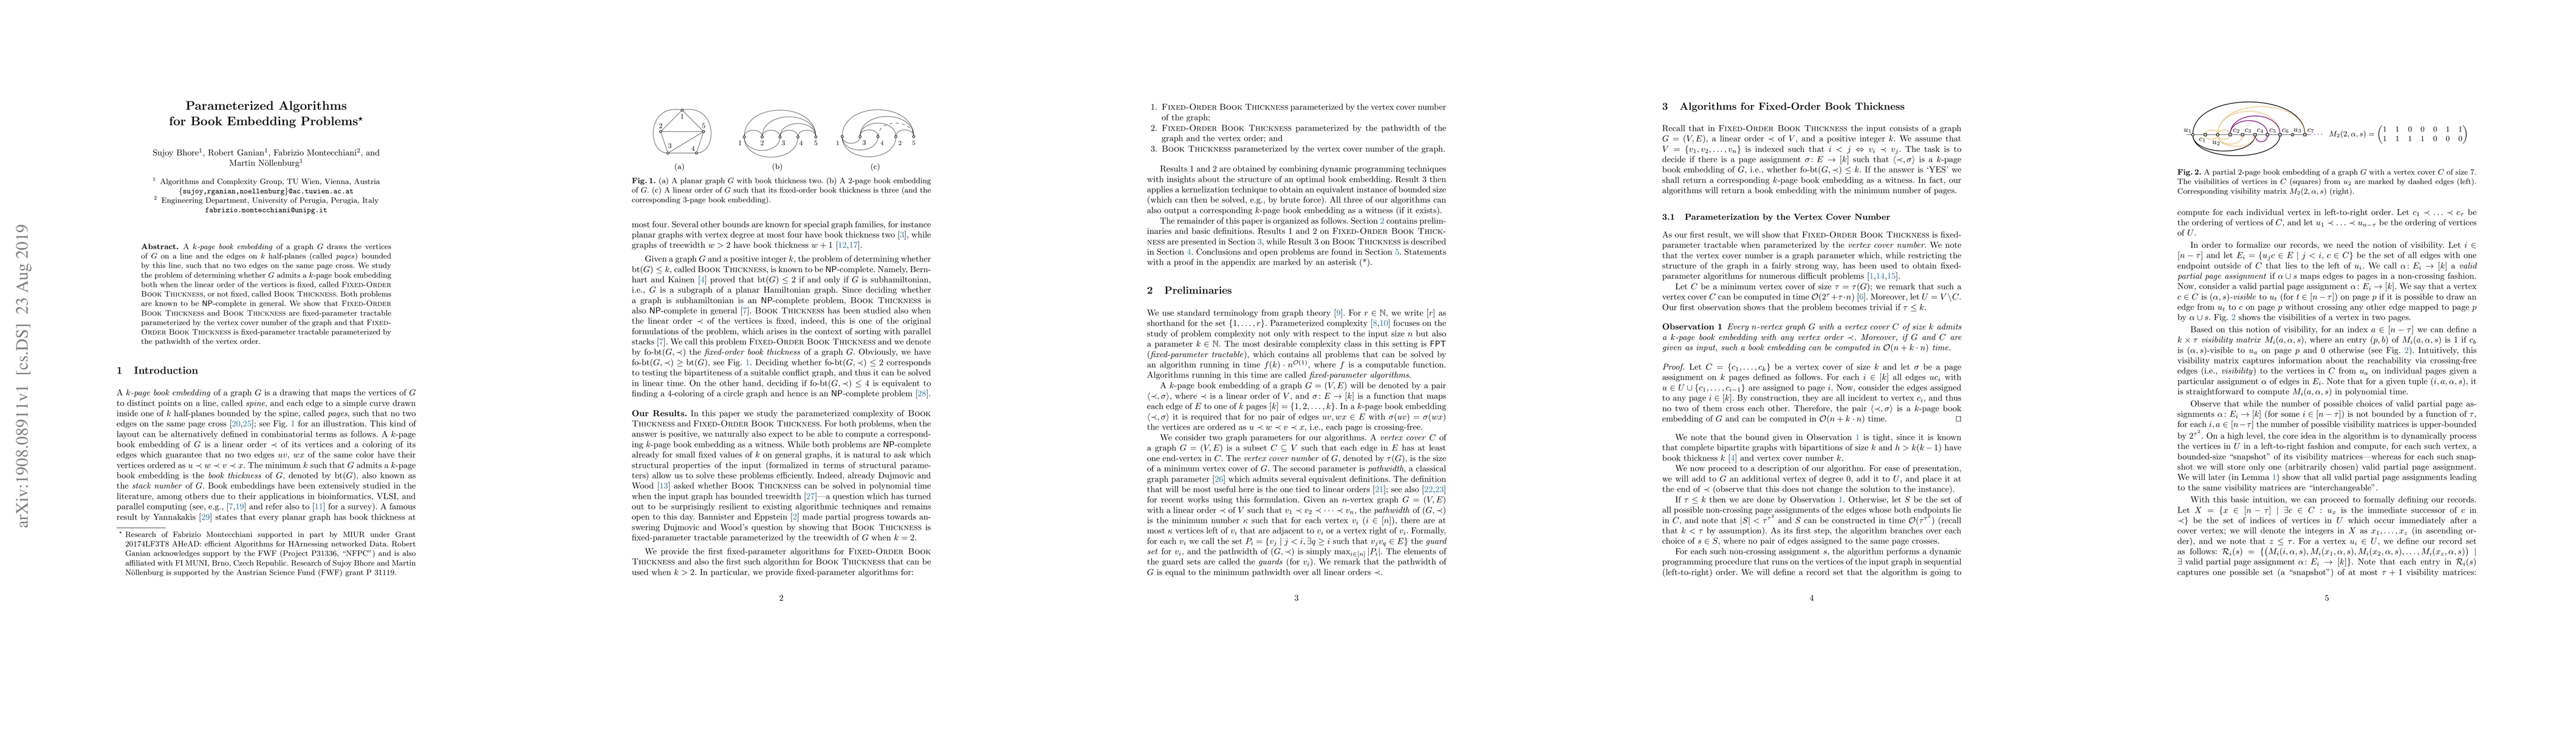
A k-page book embedding of a graph G draws the vertices of G on a line and the edges on k half-planes (called pages) bounded by this line, such that no two edges on the same page cross. We study the...
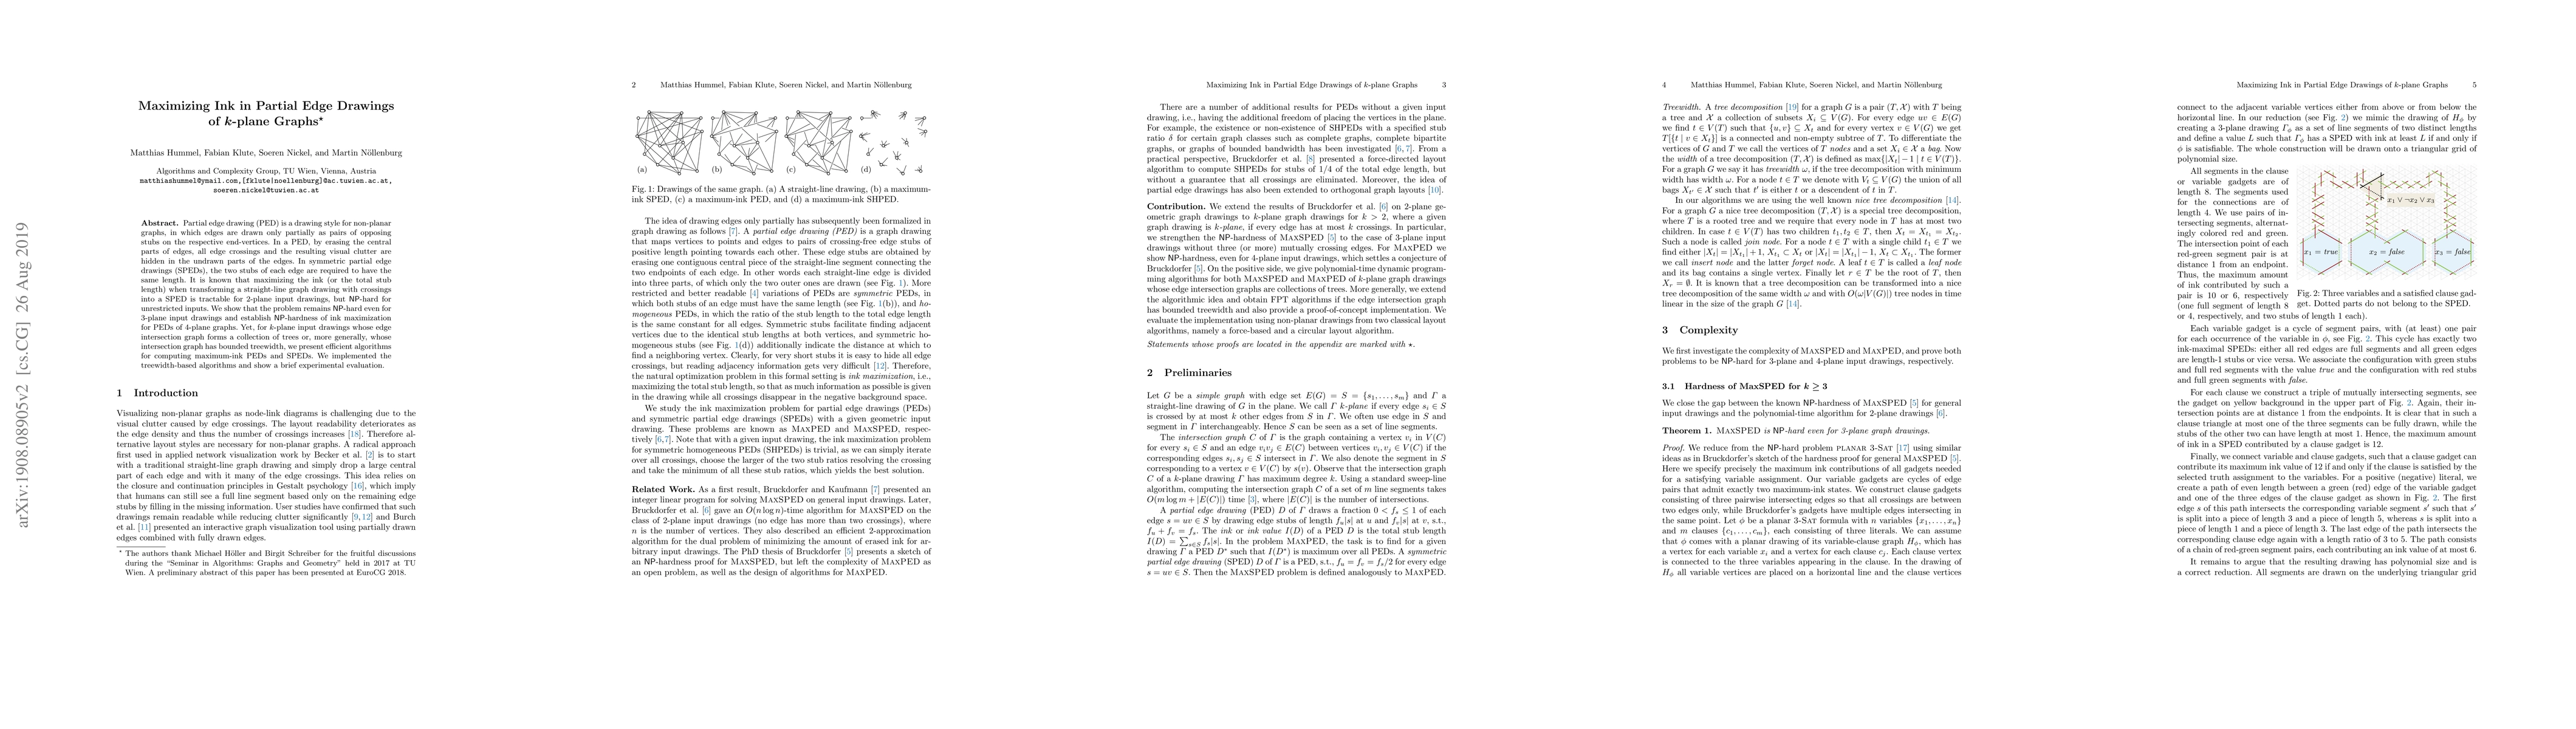
Partial edge drawing (PED) is a drawing style for non-planar graphs, in which edges are drawn only partially as pairs of opposing stubs on the respective end-vertices. In a PED, by erasing the centr...
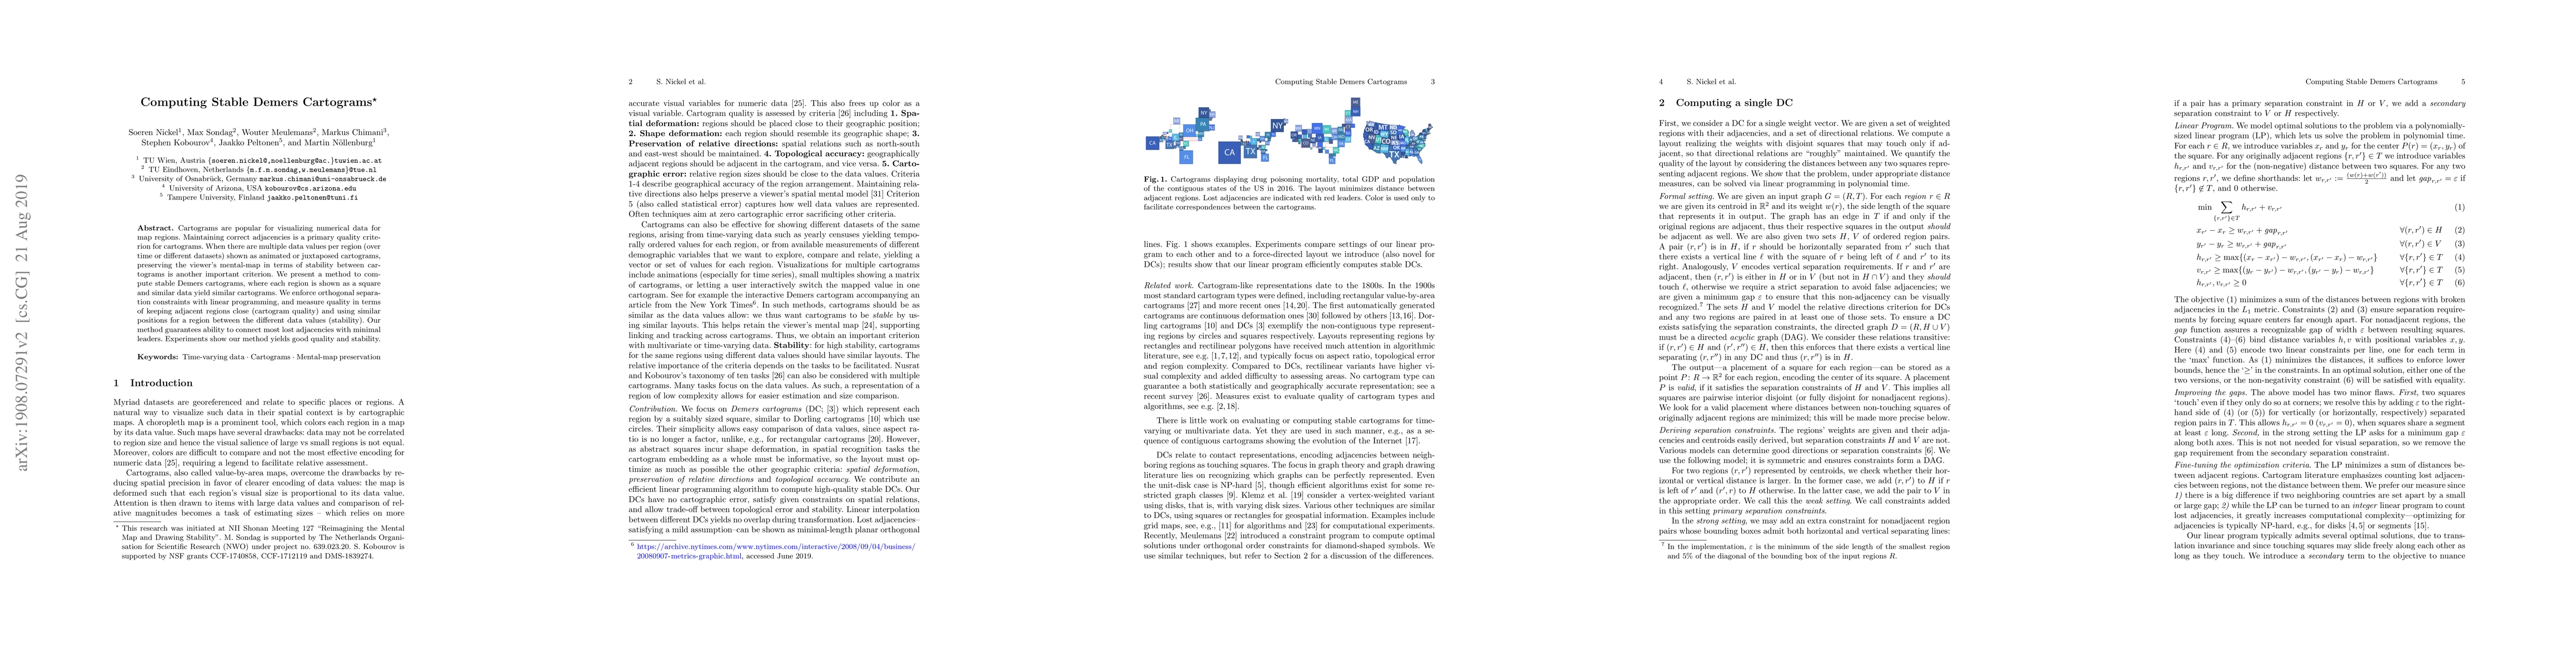
Cartograms are popular for visualizing numerical data for map regions. Maintaining correct adjacencies is a primary quality criterion for cartograms. When there are multiple data values per region (...
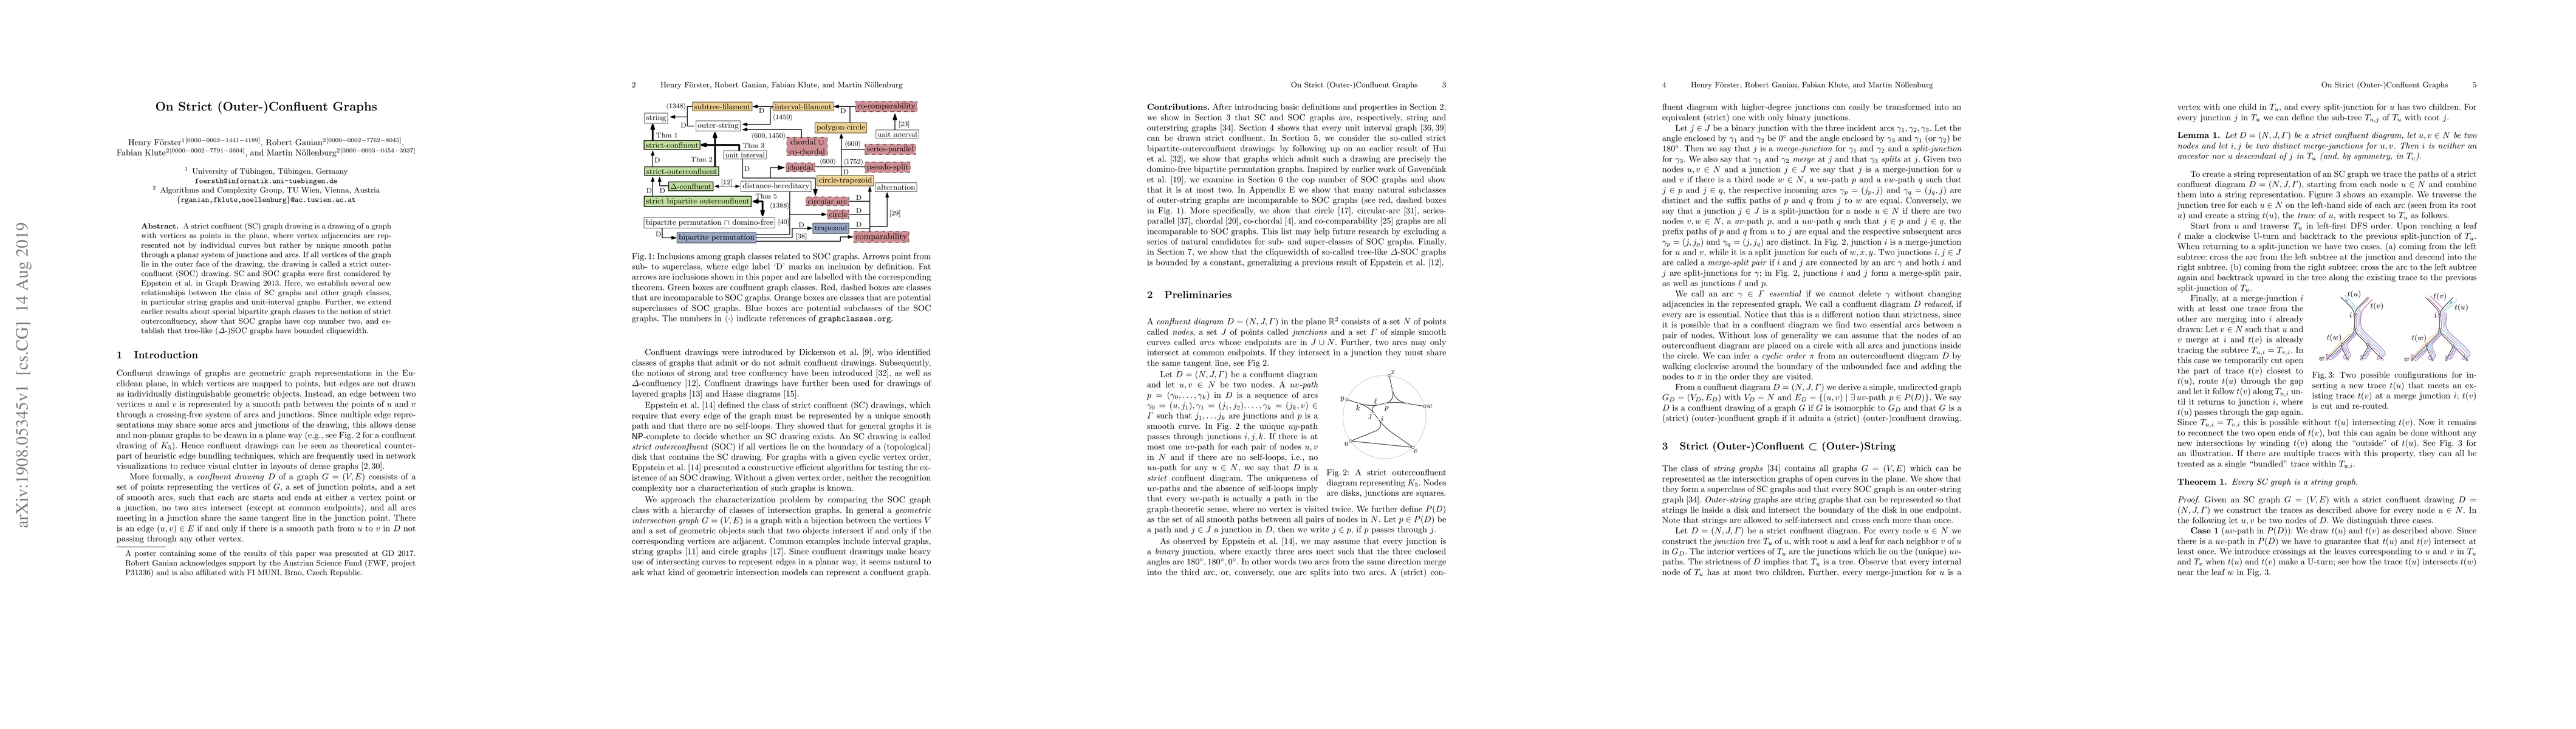
A strict confluent (SC) graph drawing is a drawing of a graph with vertices as points in the plane, where vertex adjacencies are represented not by individual curves but rather by unique smooth path...
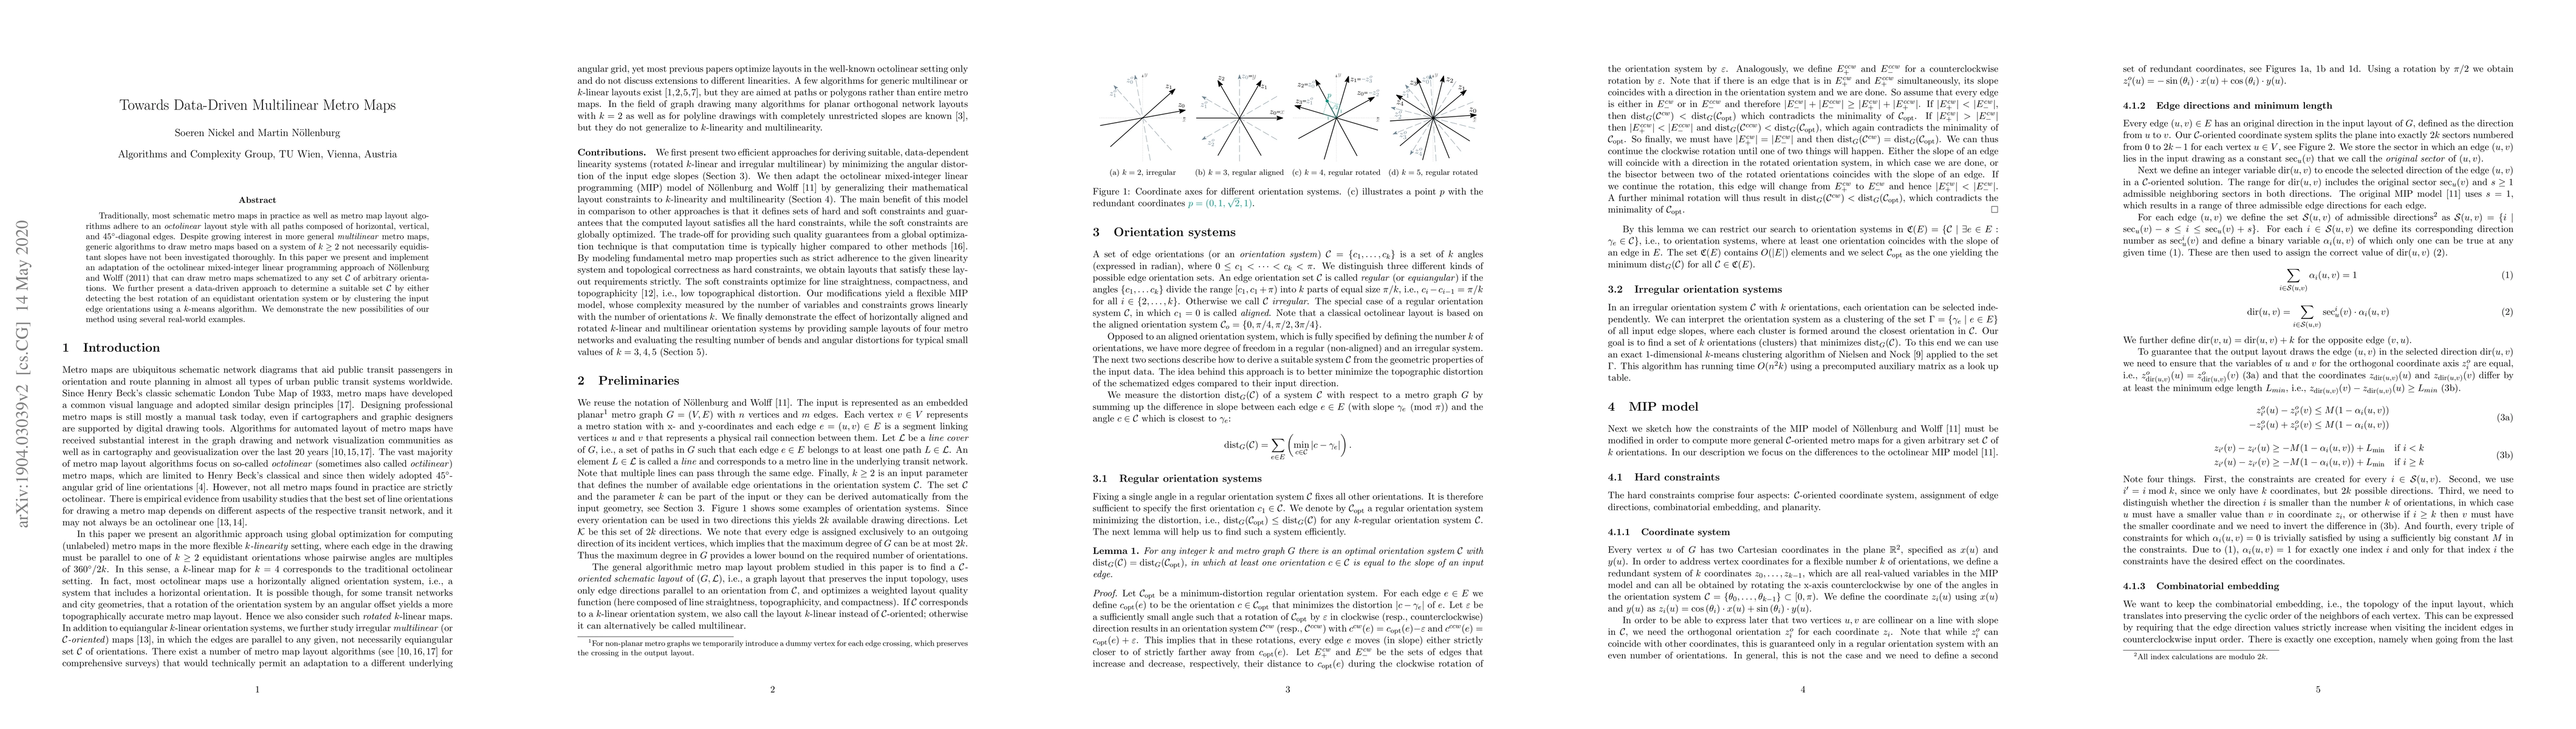
Traditionally, most schematic metro maps in practice as well as metro map layout algorithms adhere to an octolinear layout style with all paths composed of horizontal, vertical, and 45{\deg}-diagona...
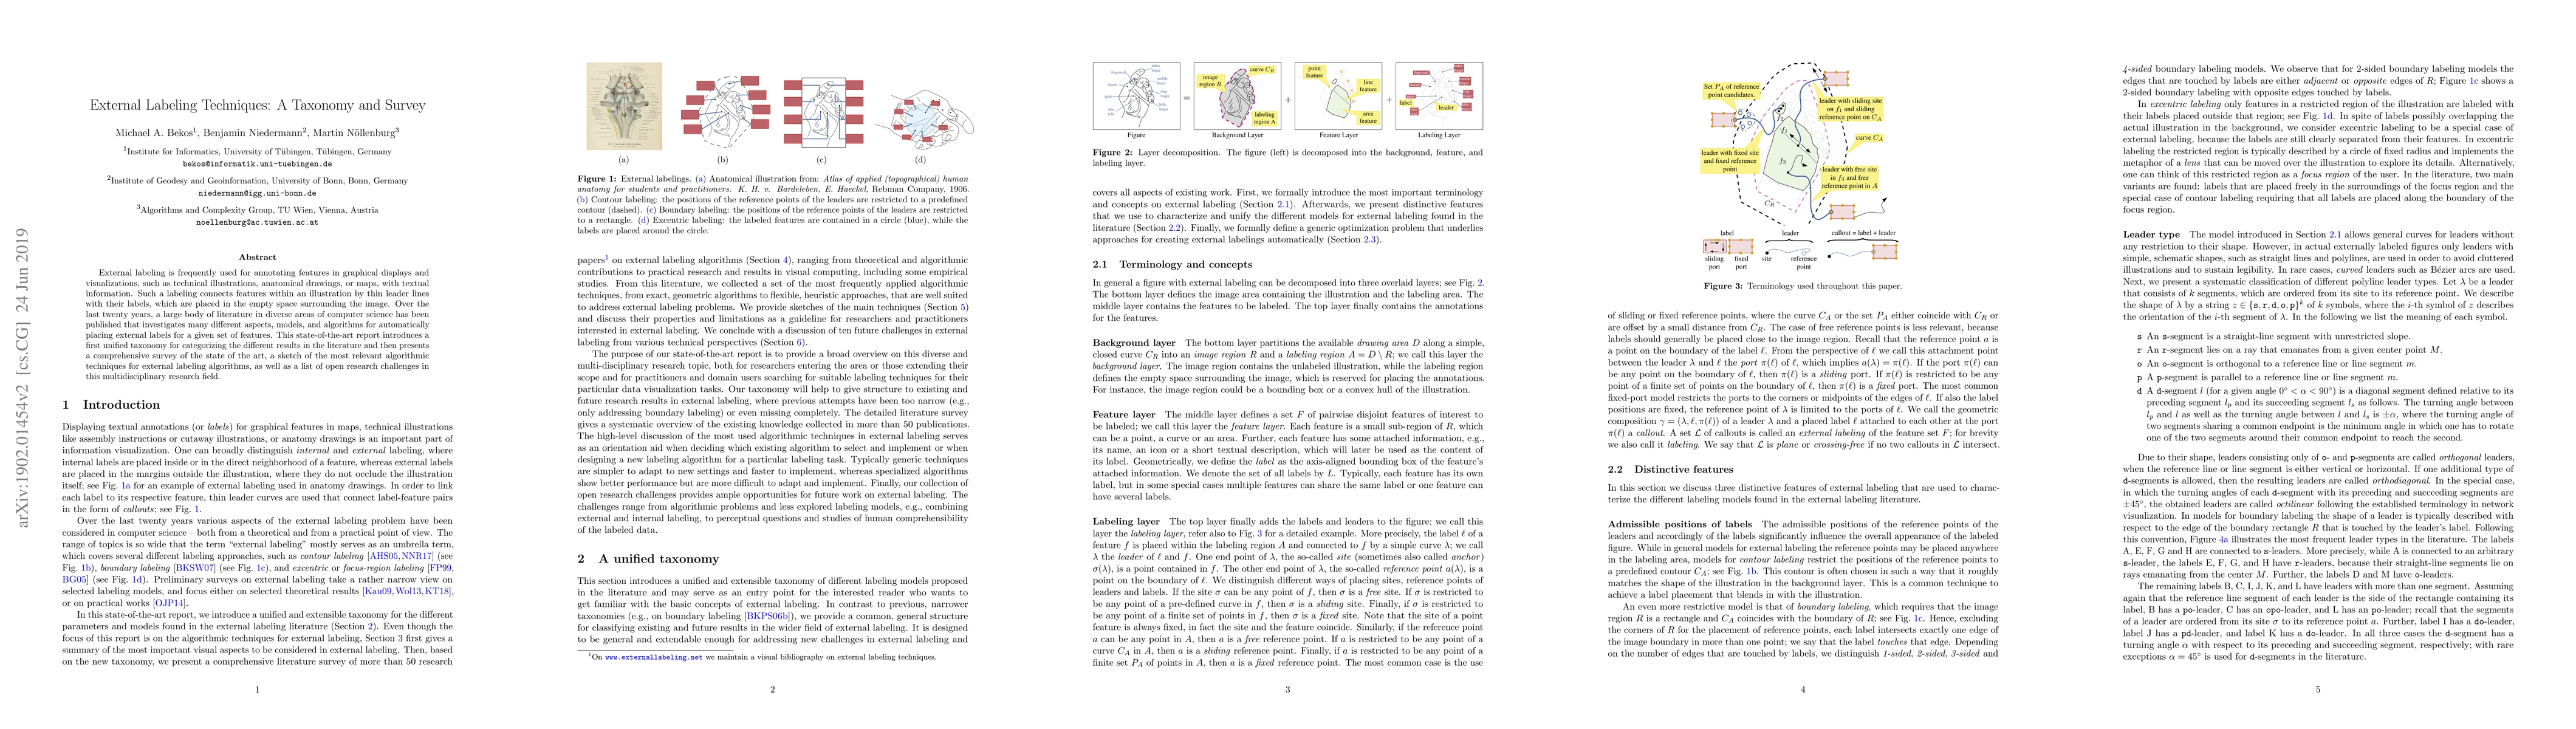
External labeling is frequently used for annotating features in graphical displays and visualizations, such as technical illustrations, anatomical drawings, or maps, with textual information. Such a...
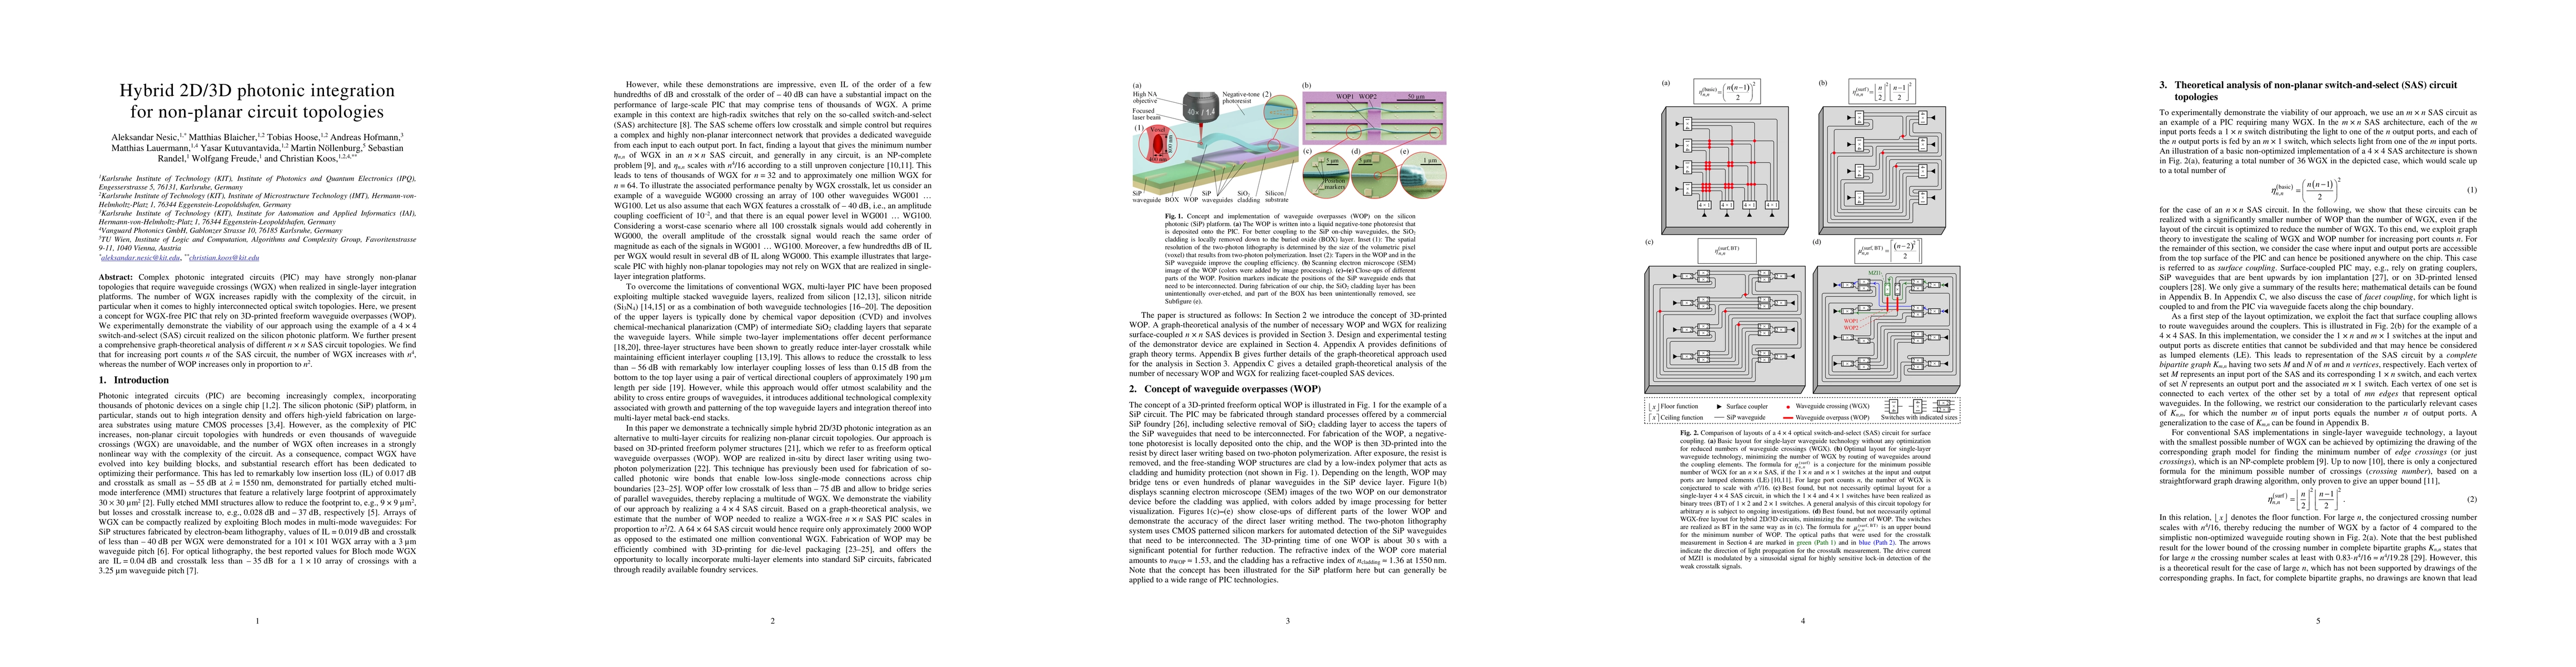
Complex photonic integrated circuits (PIC) may have strongly non-planar topologies that require waveguide crossings (WGX) when realized in single-layer integration platforms. The number of WGX incre...
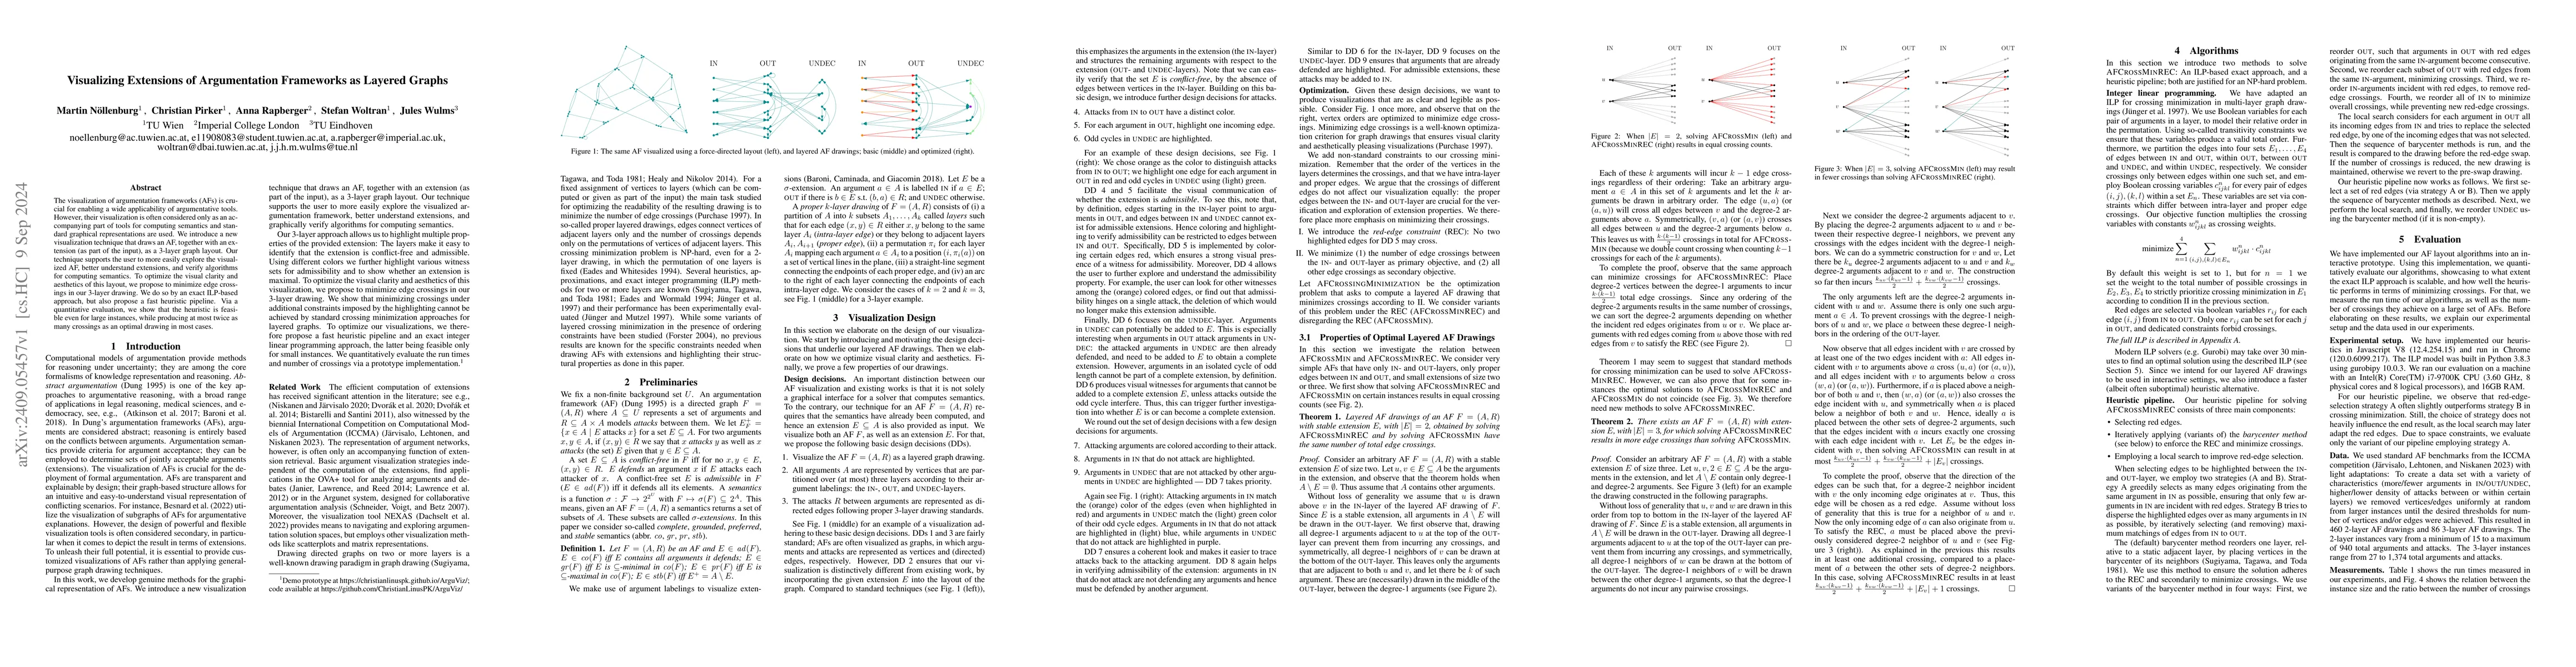
The visualization of argumentation frameworks (AFs) is crucial for enabling a wide applicability of argumentative tools. However, their visualization is often considered only as an accompanying part o...
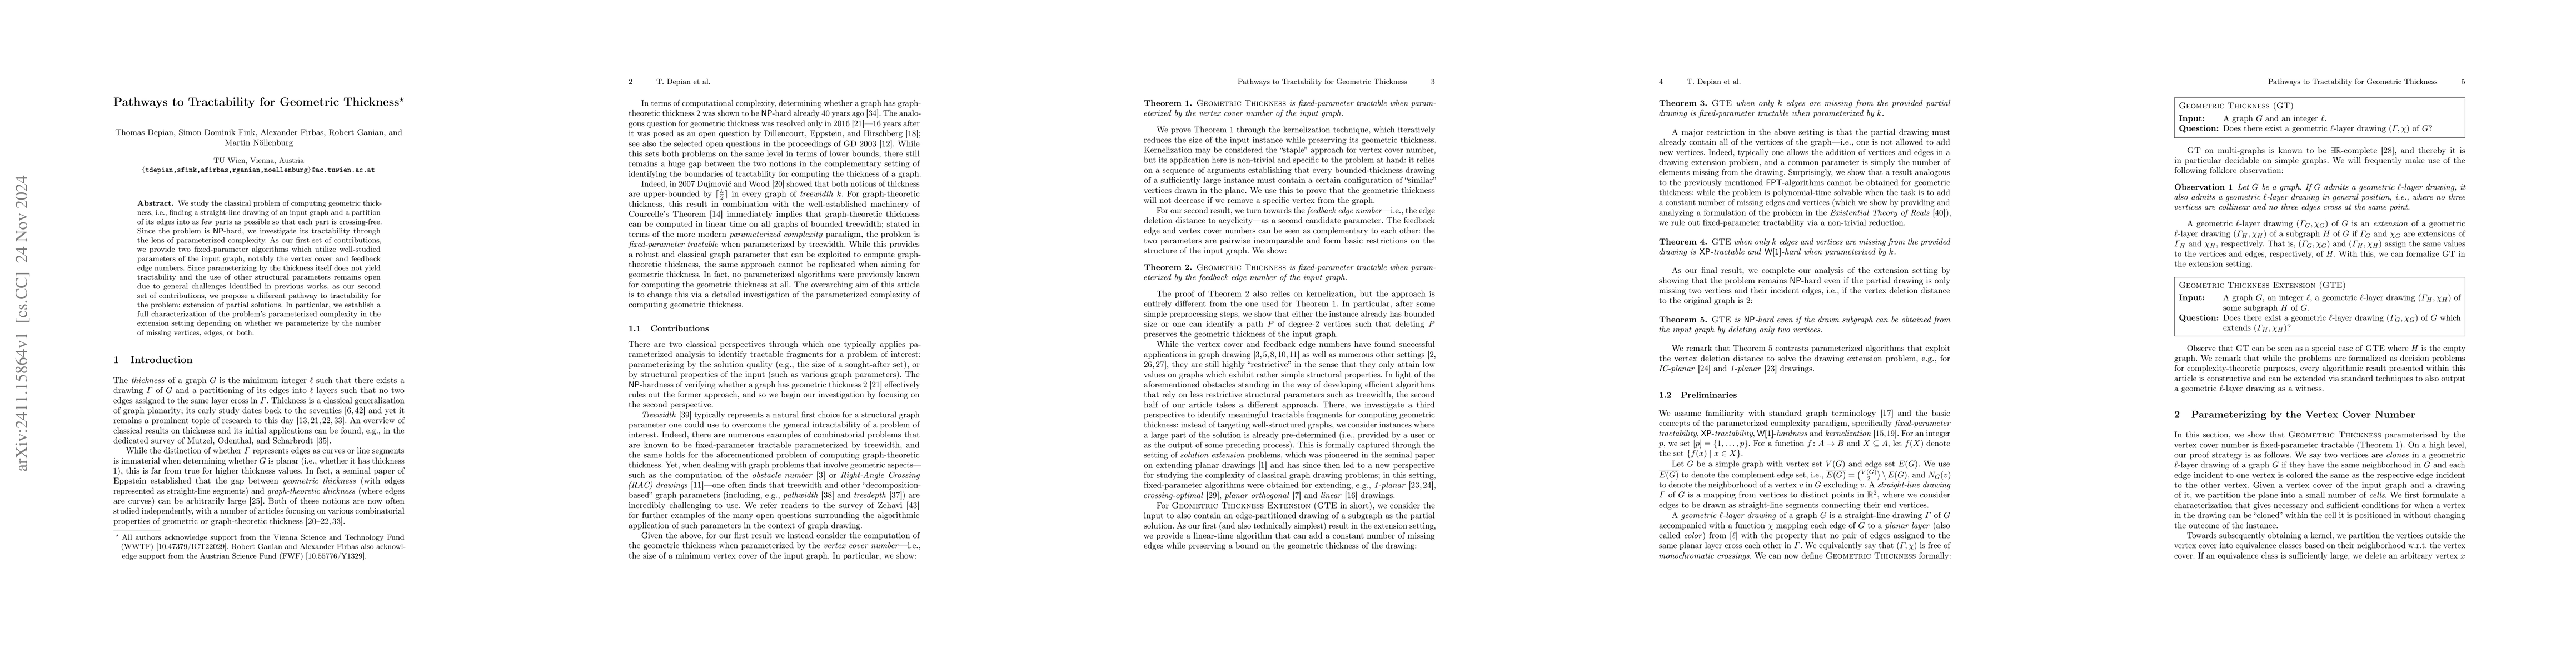
We study the classical problem of computing geometric thickness, i.e., finding a straight-line drawing of an input graph and a partition of its edges into as few parts as possible so that each part is...
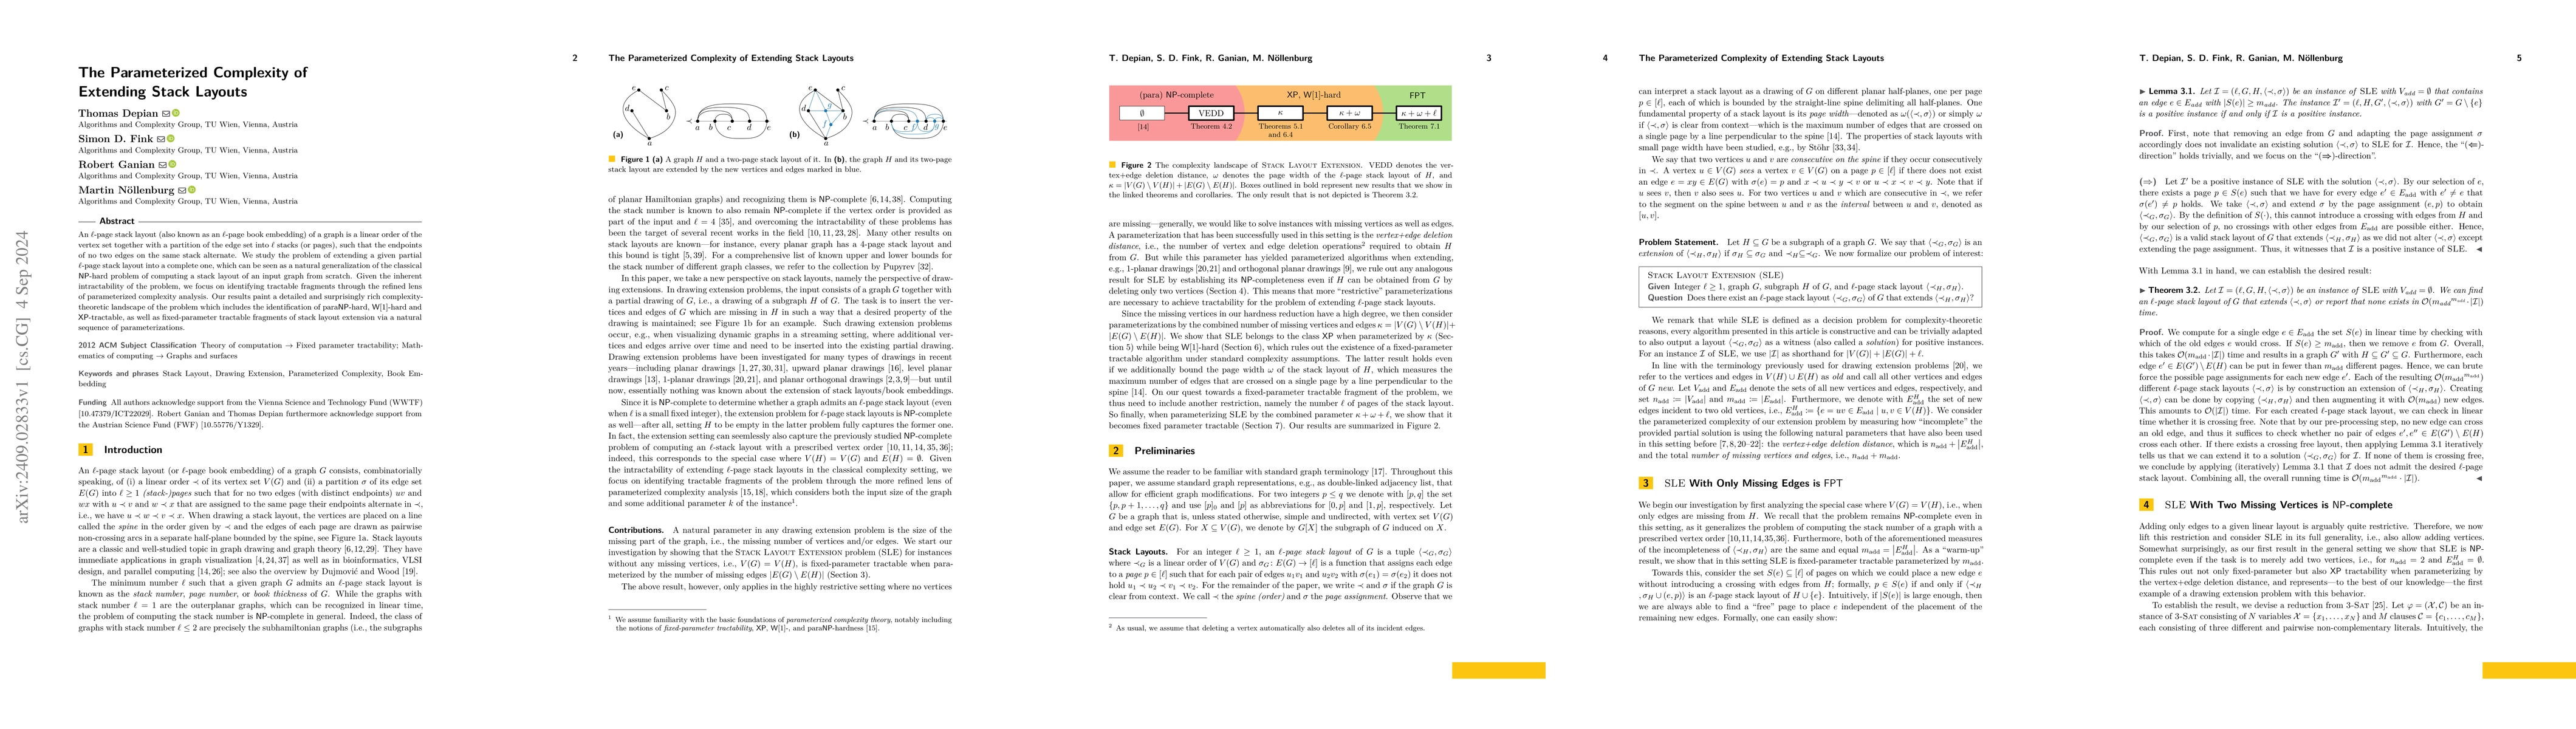
An $\ell$-page stack layout (also known as an $\ell$-page book embedding) of a graph is a linear order of the vertex set together with a partition of the edge set into $\ell$ stacks (or pages), such t...
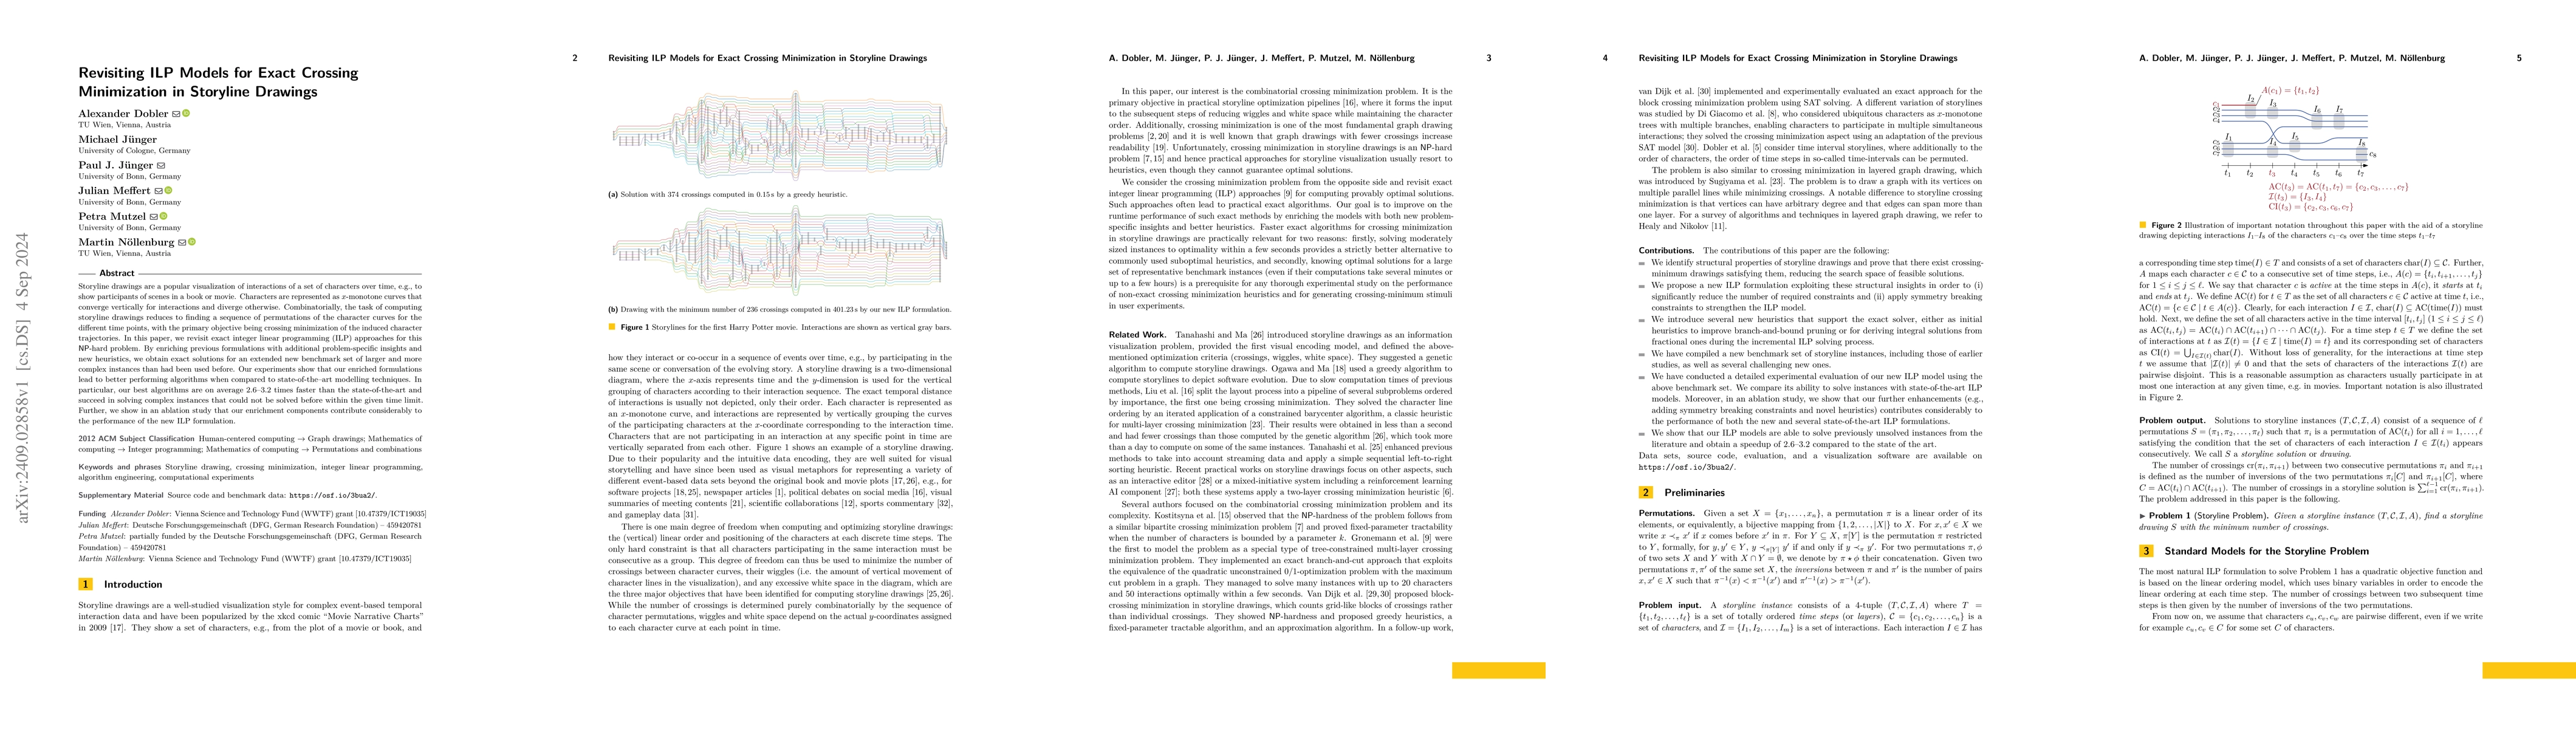
Storyline drawings are a popular visualization of interactions of a set of characters over time, e.g., to show participants of scenes in a book or movie. Characters are represented as $x$-monotone cur...
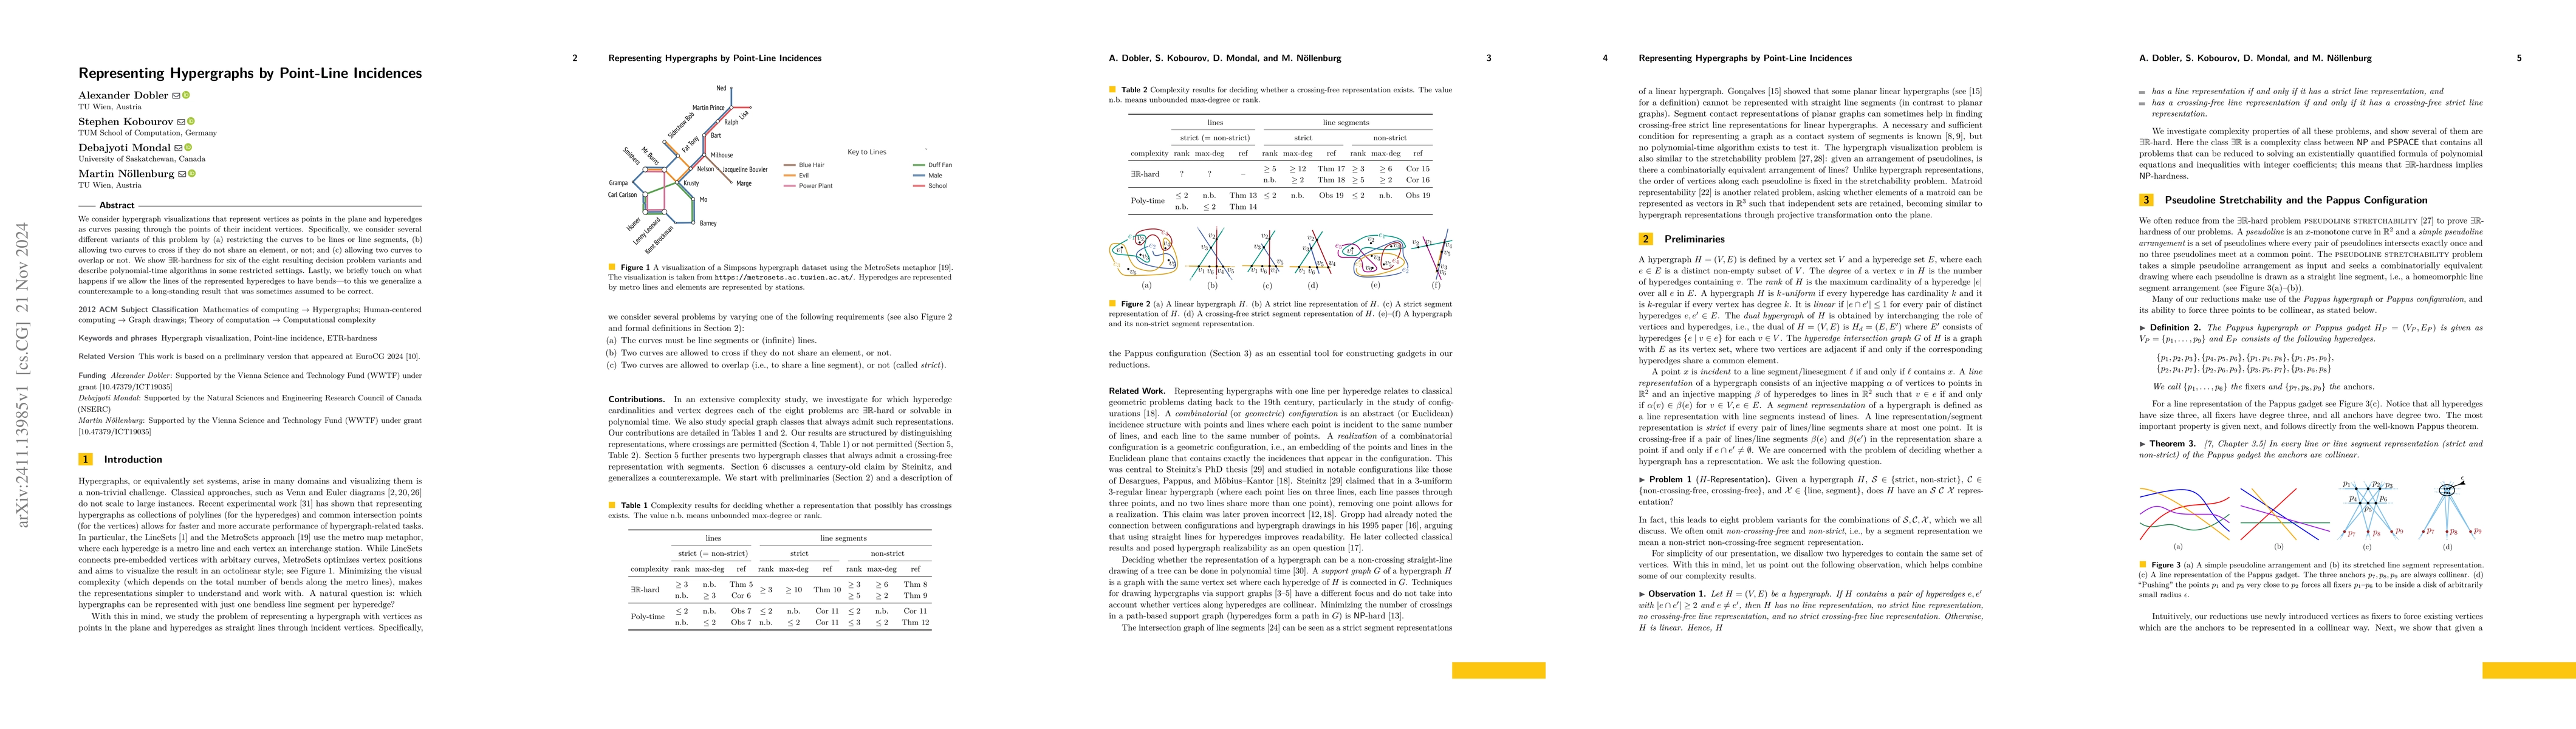
We consider hypergraph visualizations that represent vertices as points in the plane and hyperedges as curves passing through the points of their incident vertices. Specifically, we consider several d...
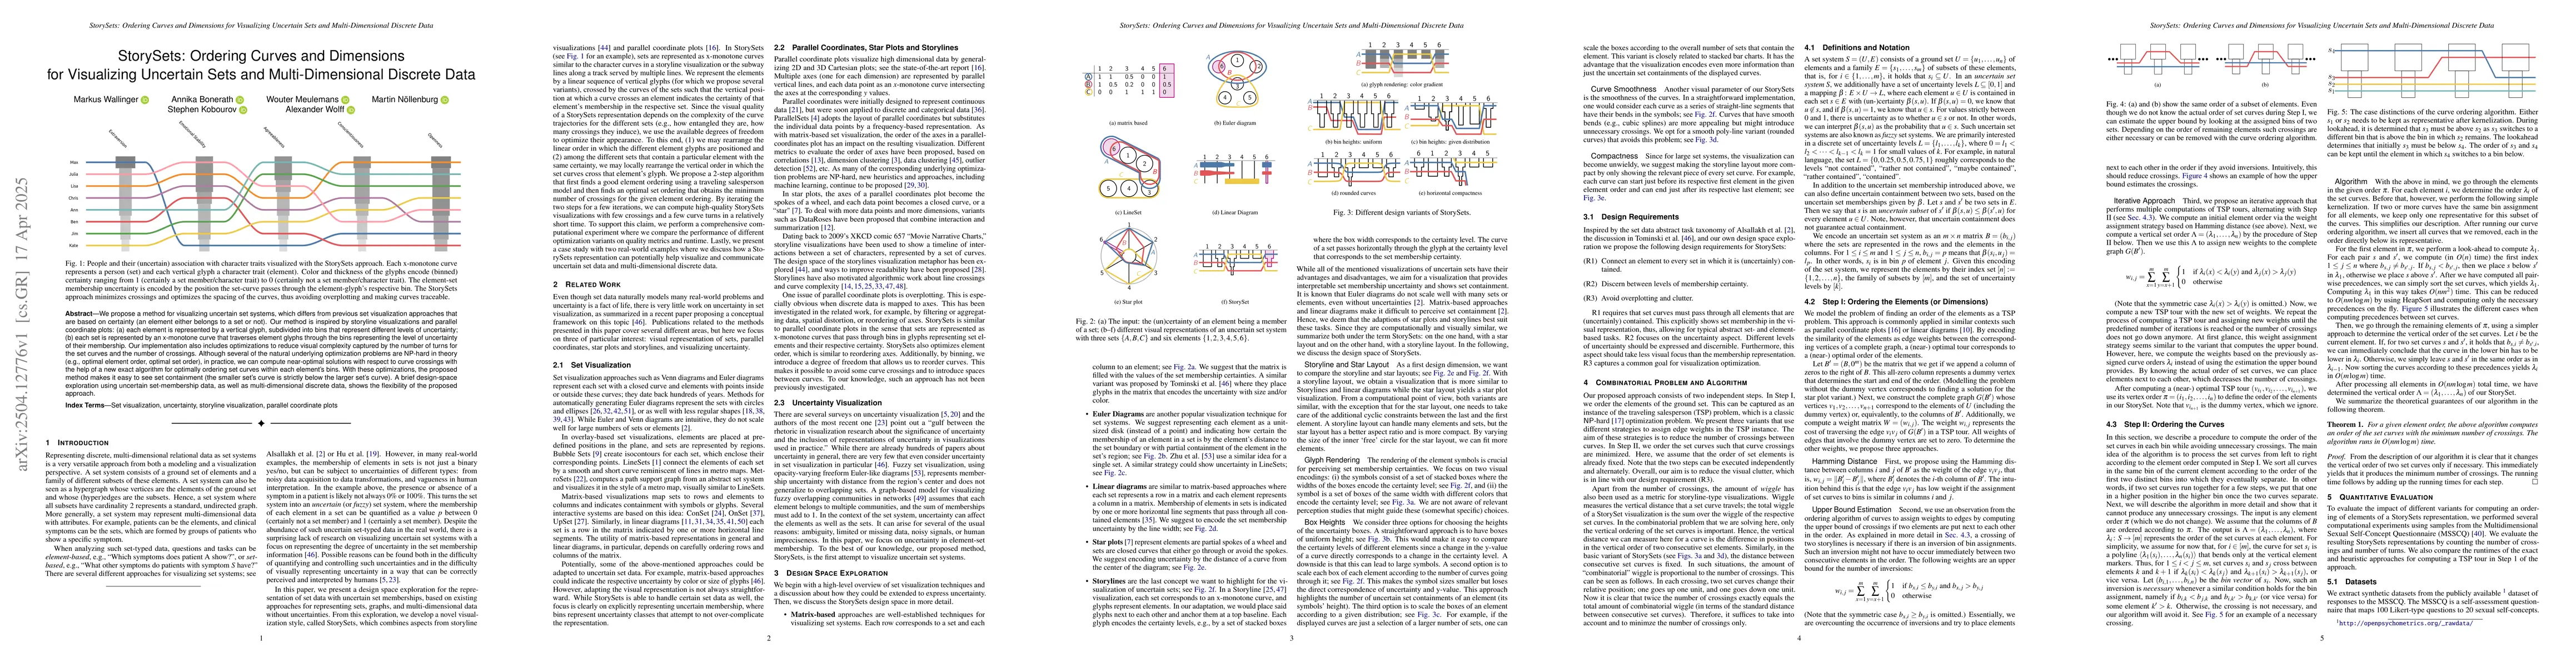
We propose a method for visualizing uncertain set systems, which differs from previous set visualization approaches that are based on certainty (an element either belongs to a set or not). Our method ...
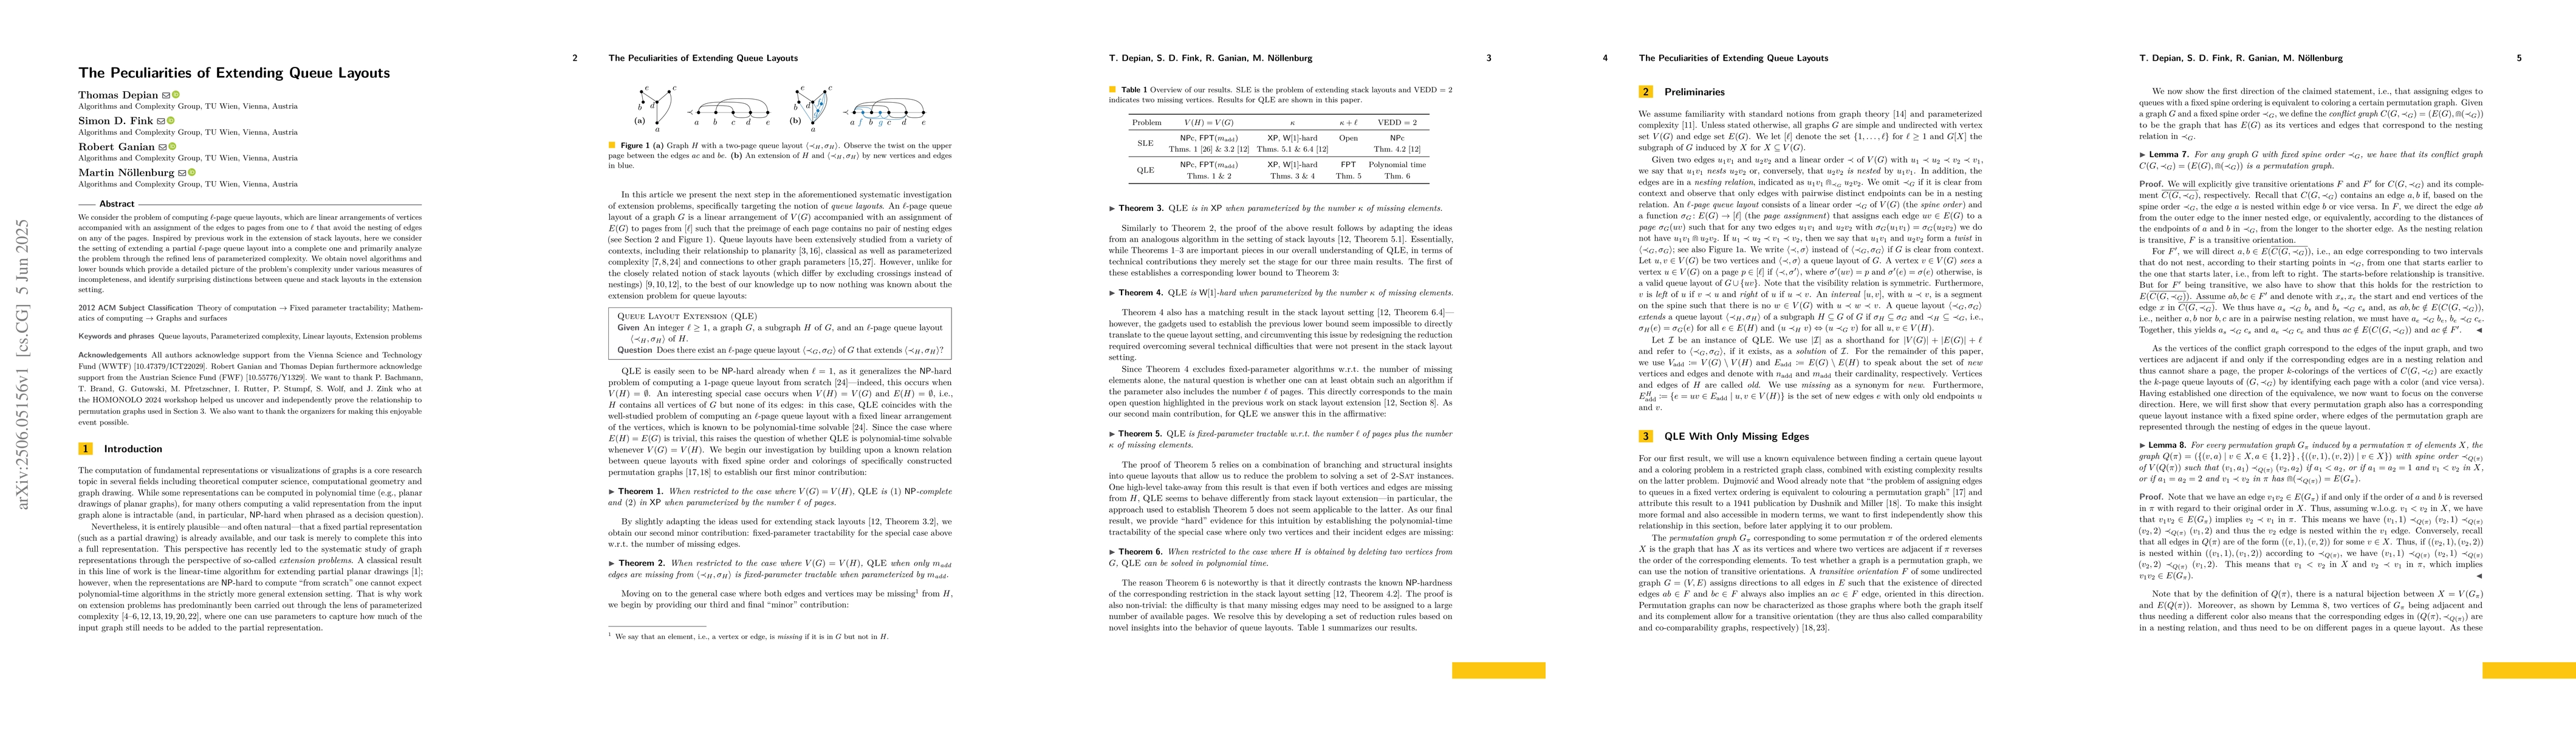
We consider the problem of computing $\ell$-page queue layouts, which are linear arrangements of vertices accompanied with an assignment of the edges to pages from one to $\ell$ that avoid the nesting...
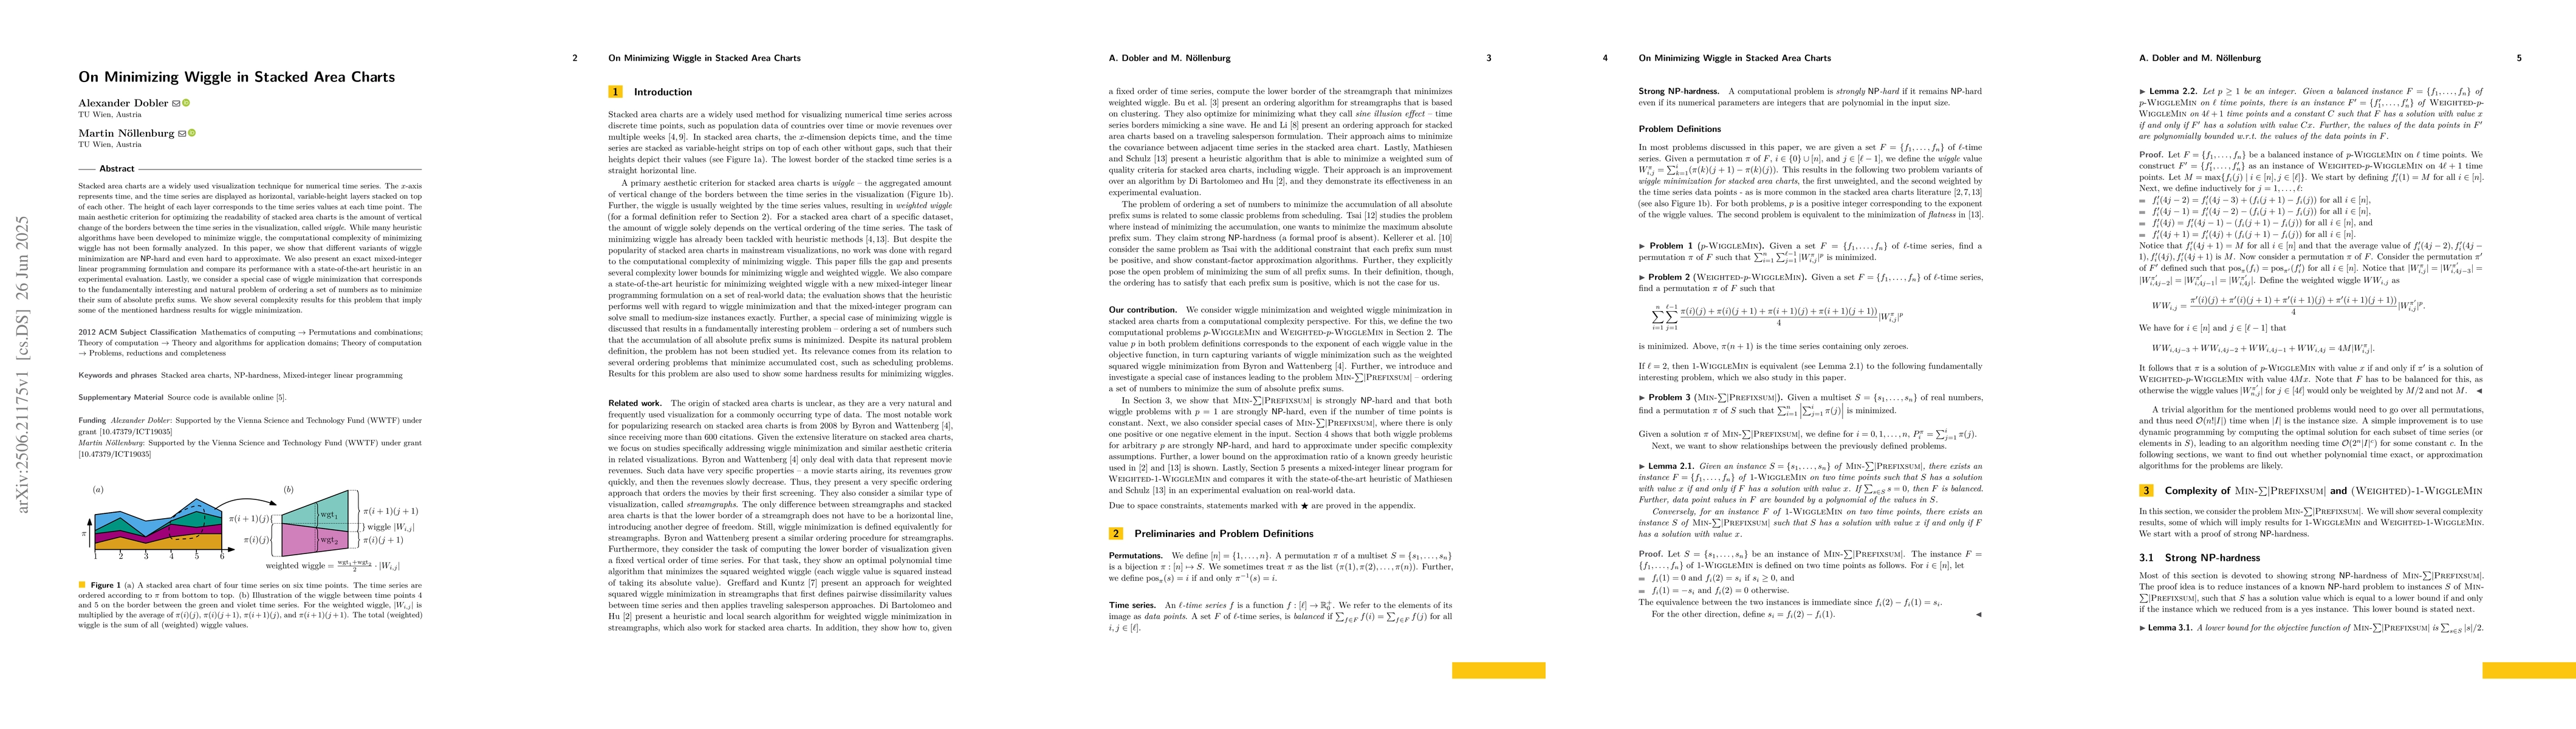
Stacked area charts are a widely used visualization technique for numerical time series. The x-axis represents time, and the time series are displayed as horizontal, variable-height layers stacked on ...
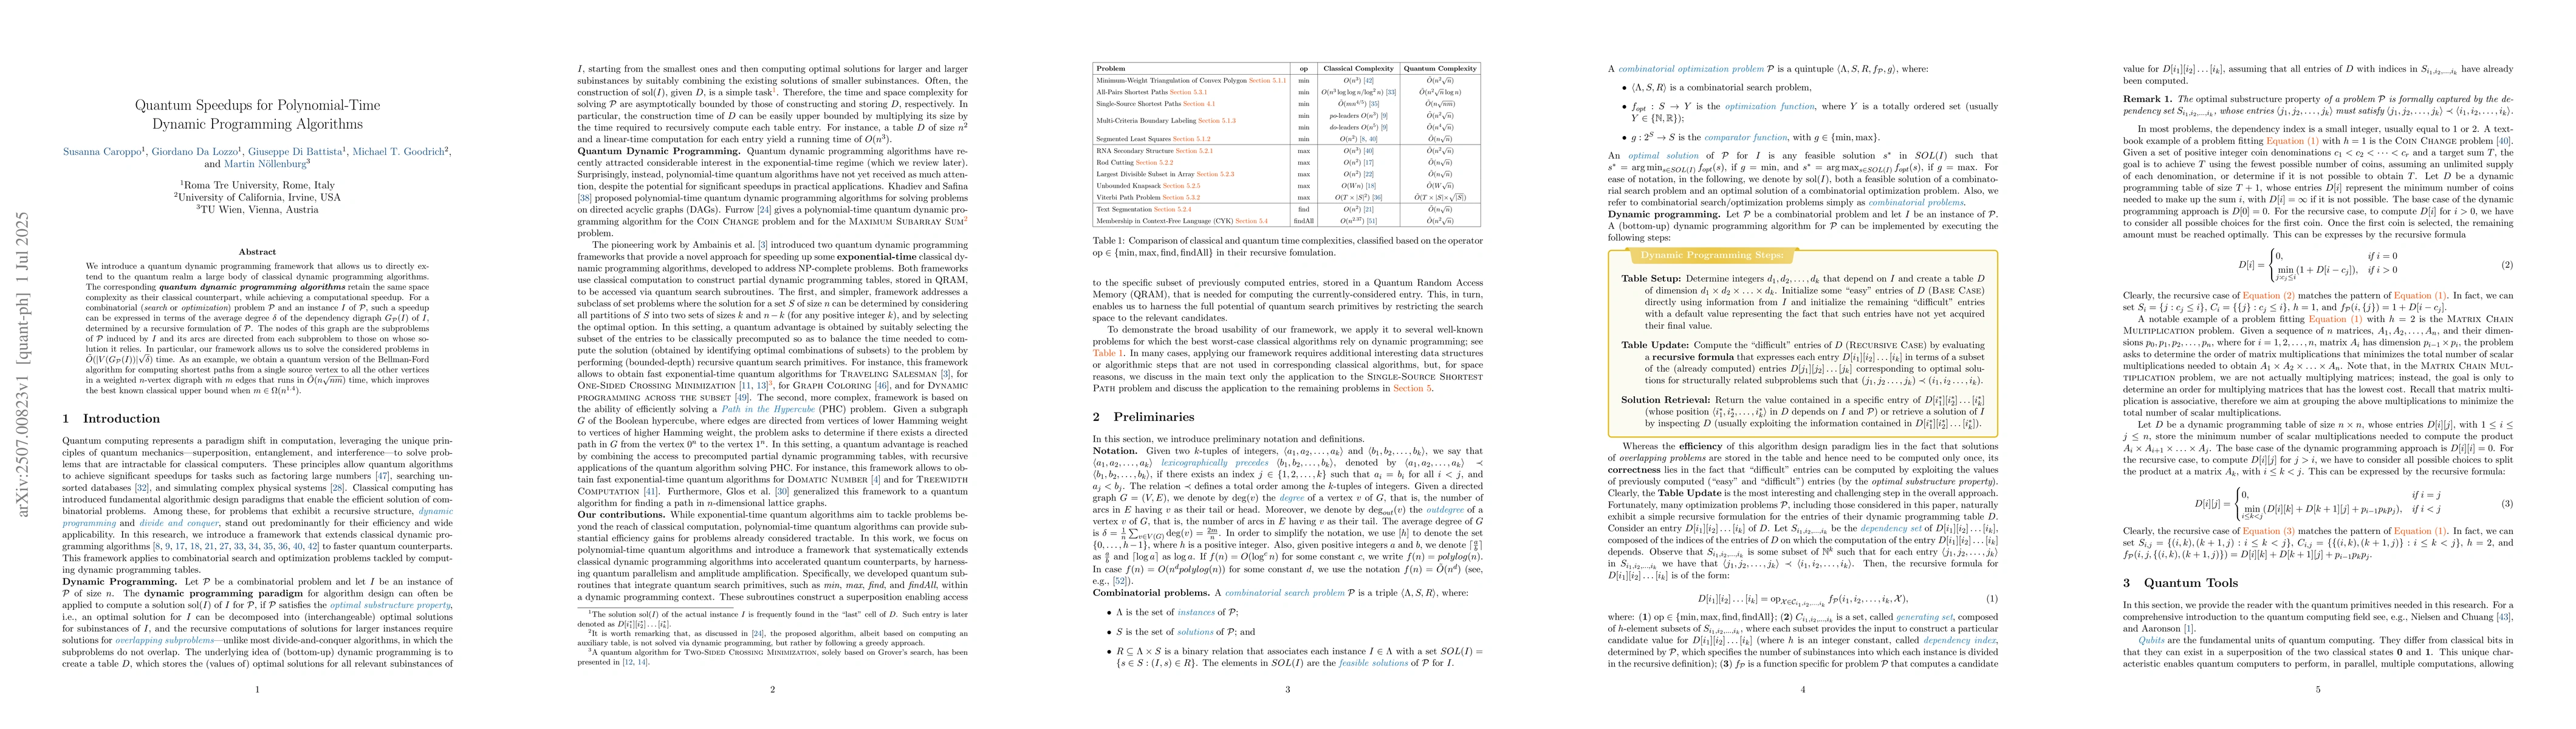
We introduce a quantum dynamic programming framework that allows us to directly extend to the quantum realm a large body of classical dynamic programming algorithms. The corresponding quantum dynamic ...
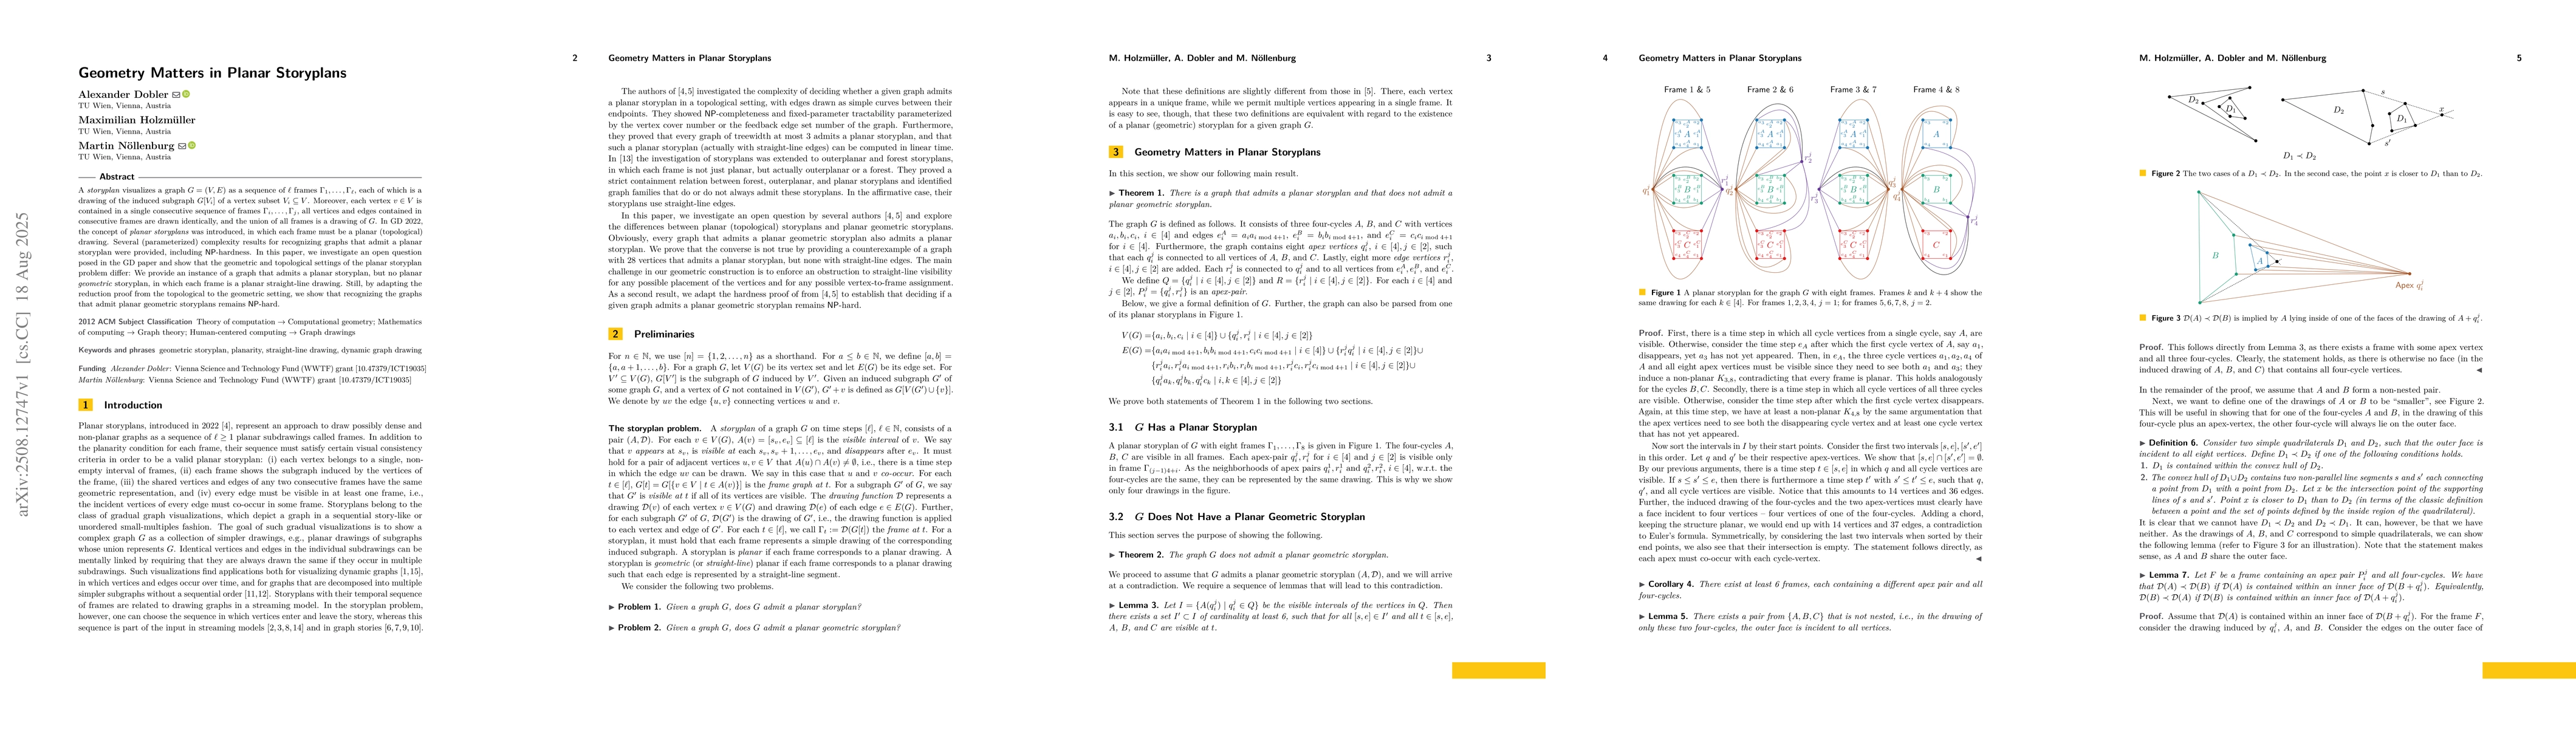
A storyplan visualizes a graph $G=(V,E)$ as a sequence of $\ell$ frames $\Gamma_1, \dots, \Gamma_\ell$, each of which is a drawing of the induced subgraph $G[V_i]$ of a vertex subset $V_i \subseteq V$...
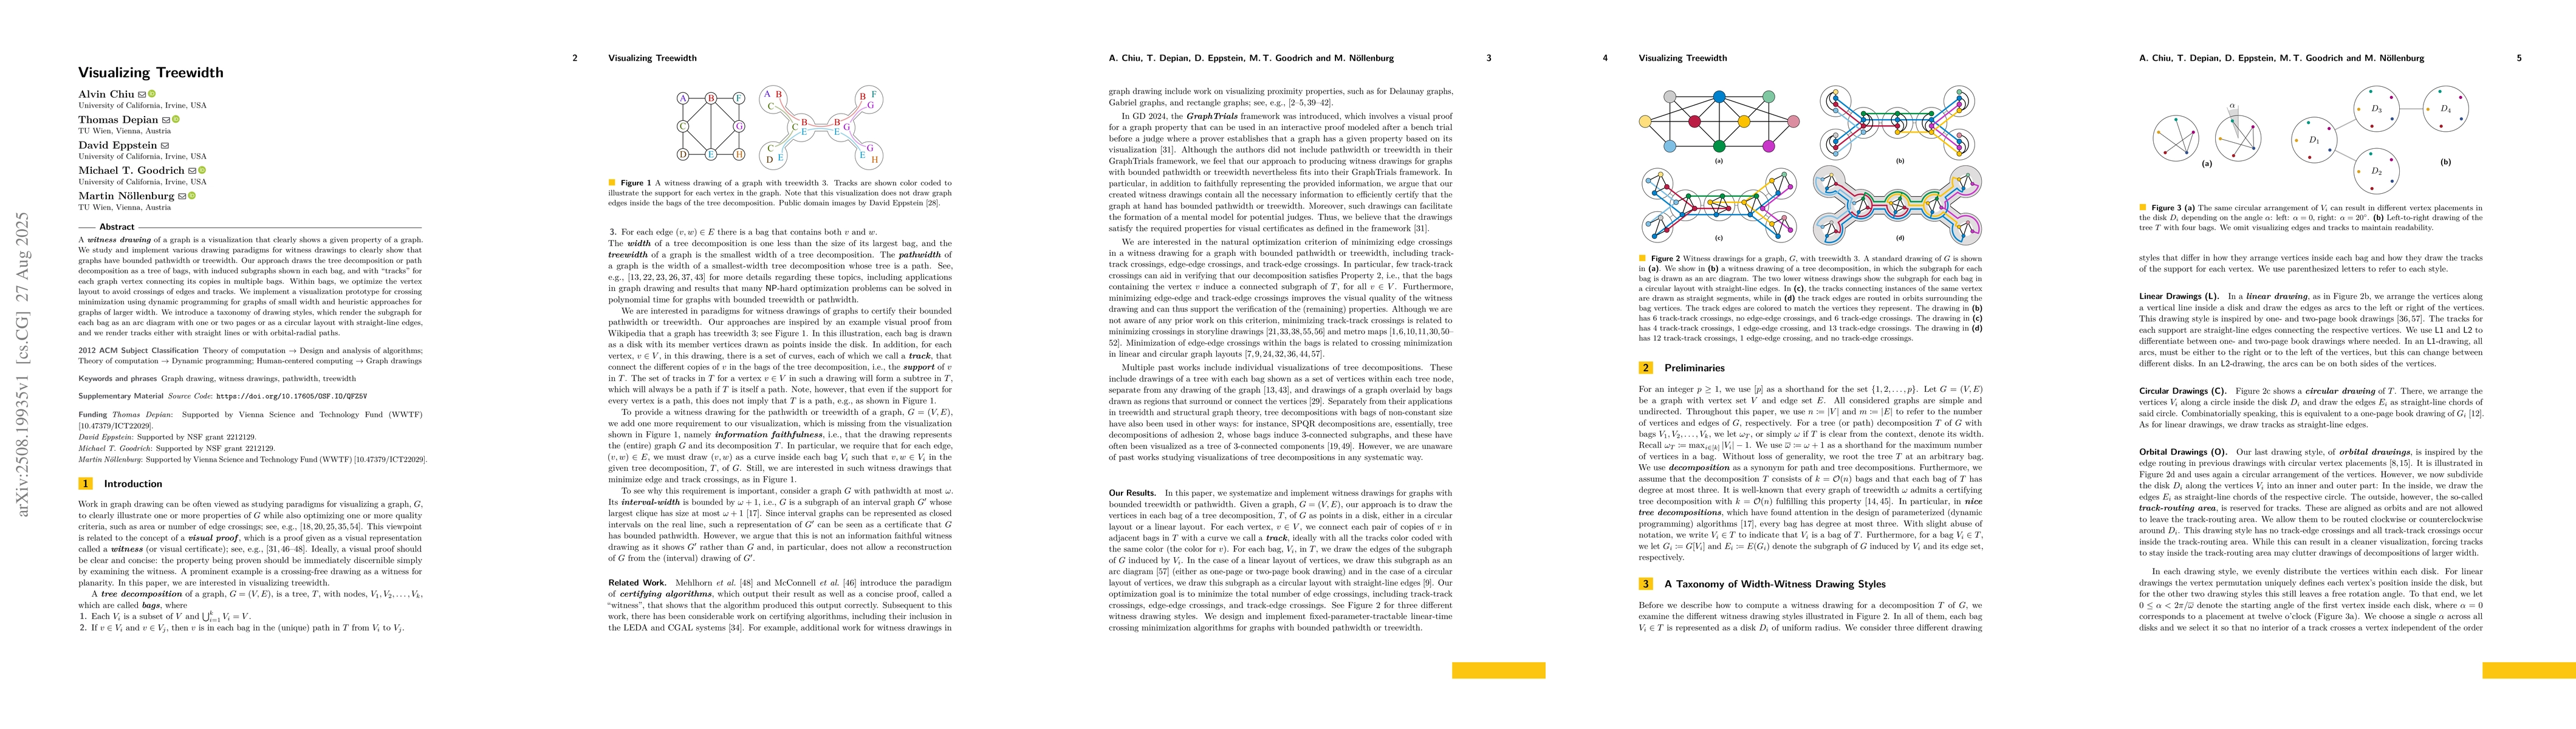
A witness drawing of a graph is a visualization that clearly shows a given property of a graph. We study and implement various drawing paradigms for witness drawings to clearly show that graphs have b...
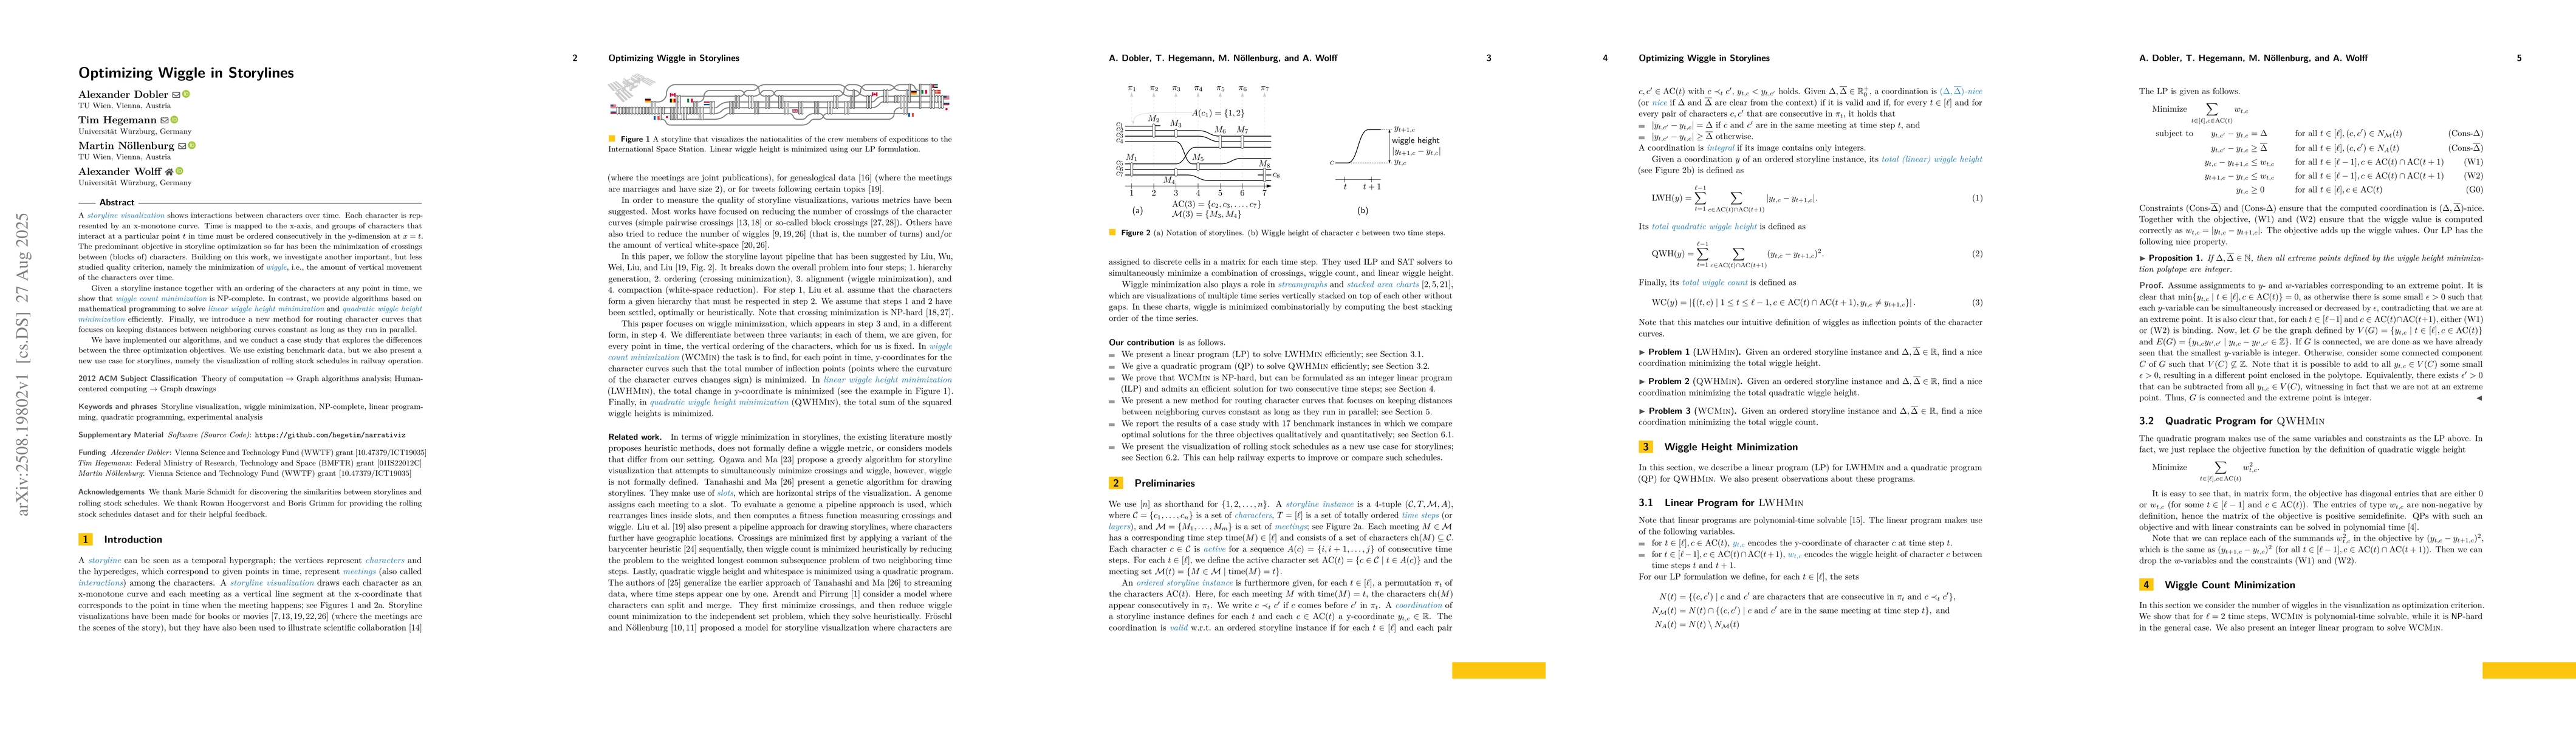
A storyline visualization shows interactions between characters over time. Each character is represented by an x-monotone curve. Time is mapped to the x-axis, and groups of characters that interact at...
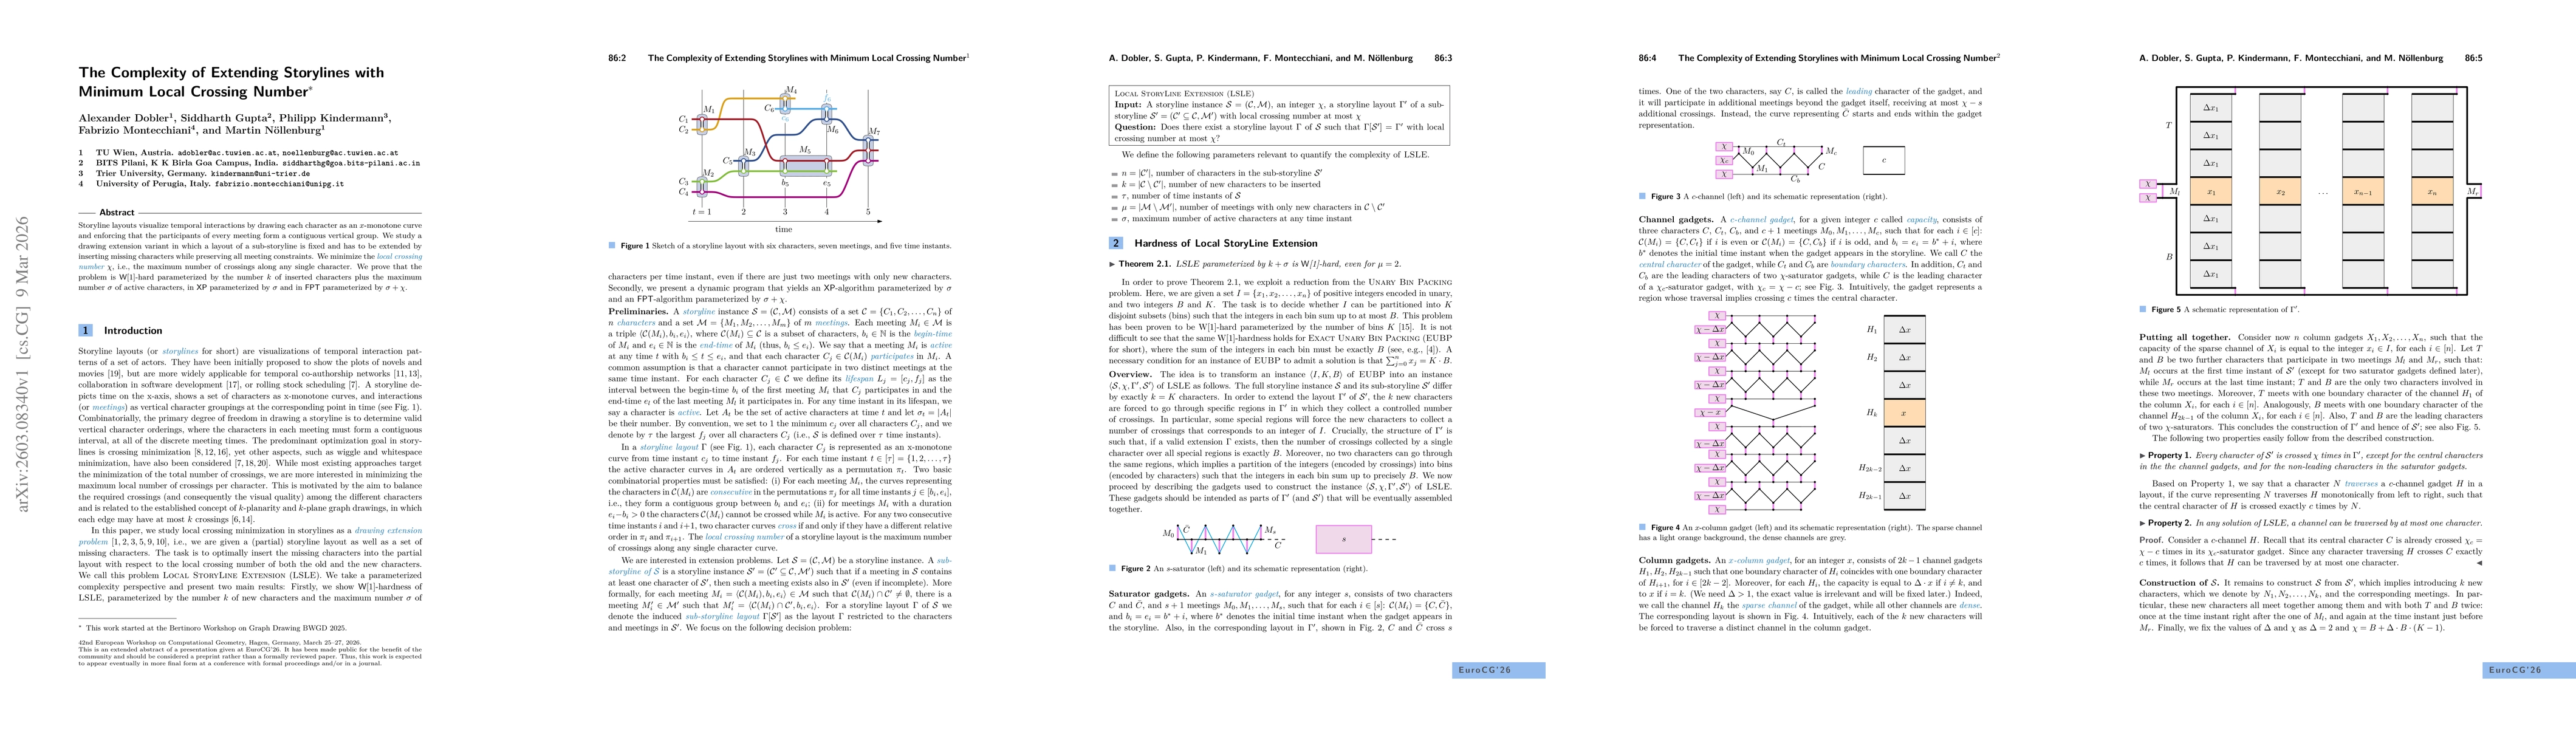
Storyline layouts visualize temporal interactions by drawing each character as an $x$-monotone curve and enforcing that the participants of every meeting form a contiguous vertical group. We study a d...
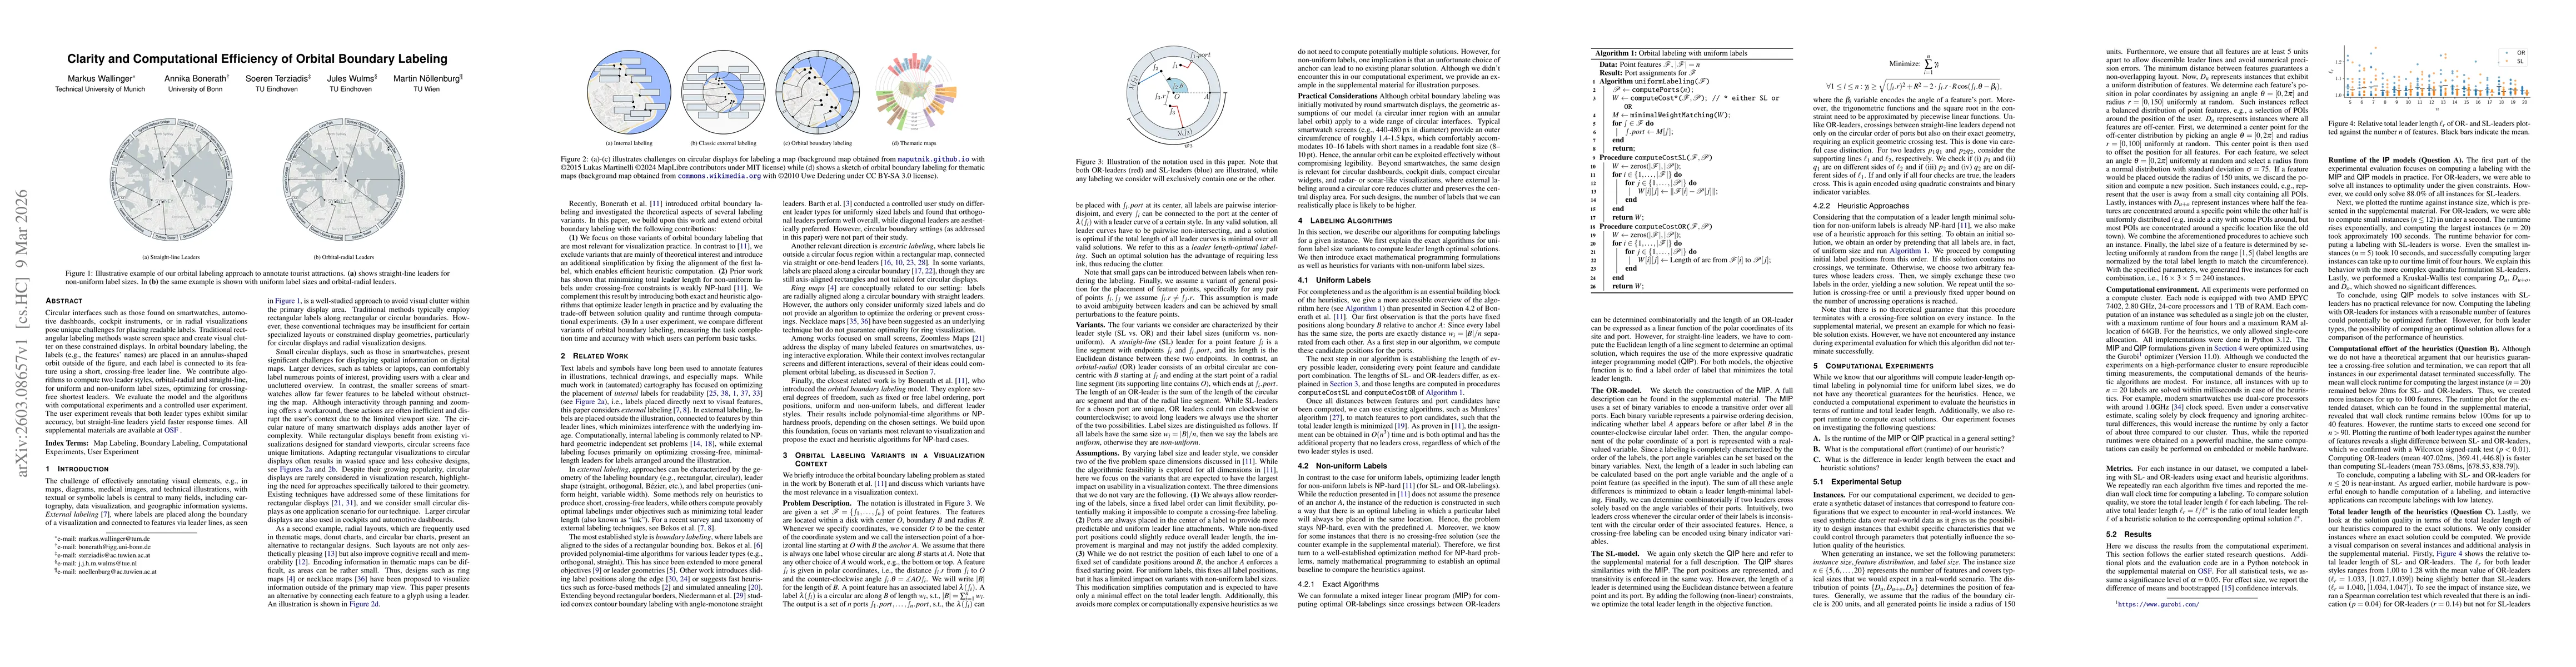
Circular interfaces such as those found on smartwatches, automotive dashboards, cockpit instruments, or in radial visualizations pose unique challenges for placing readable labels. Traditional rectang...
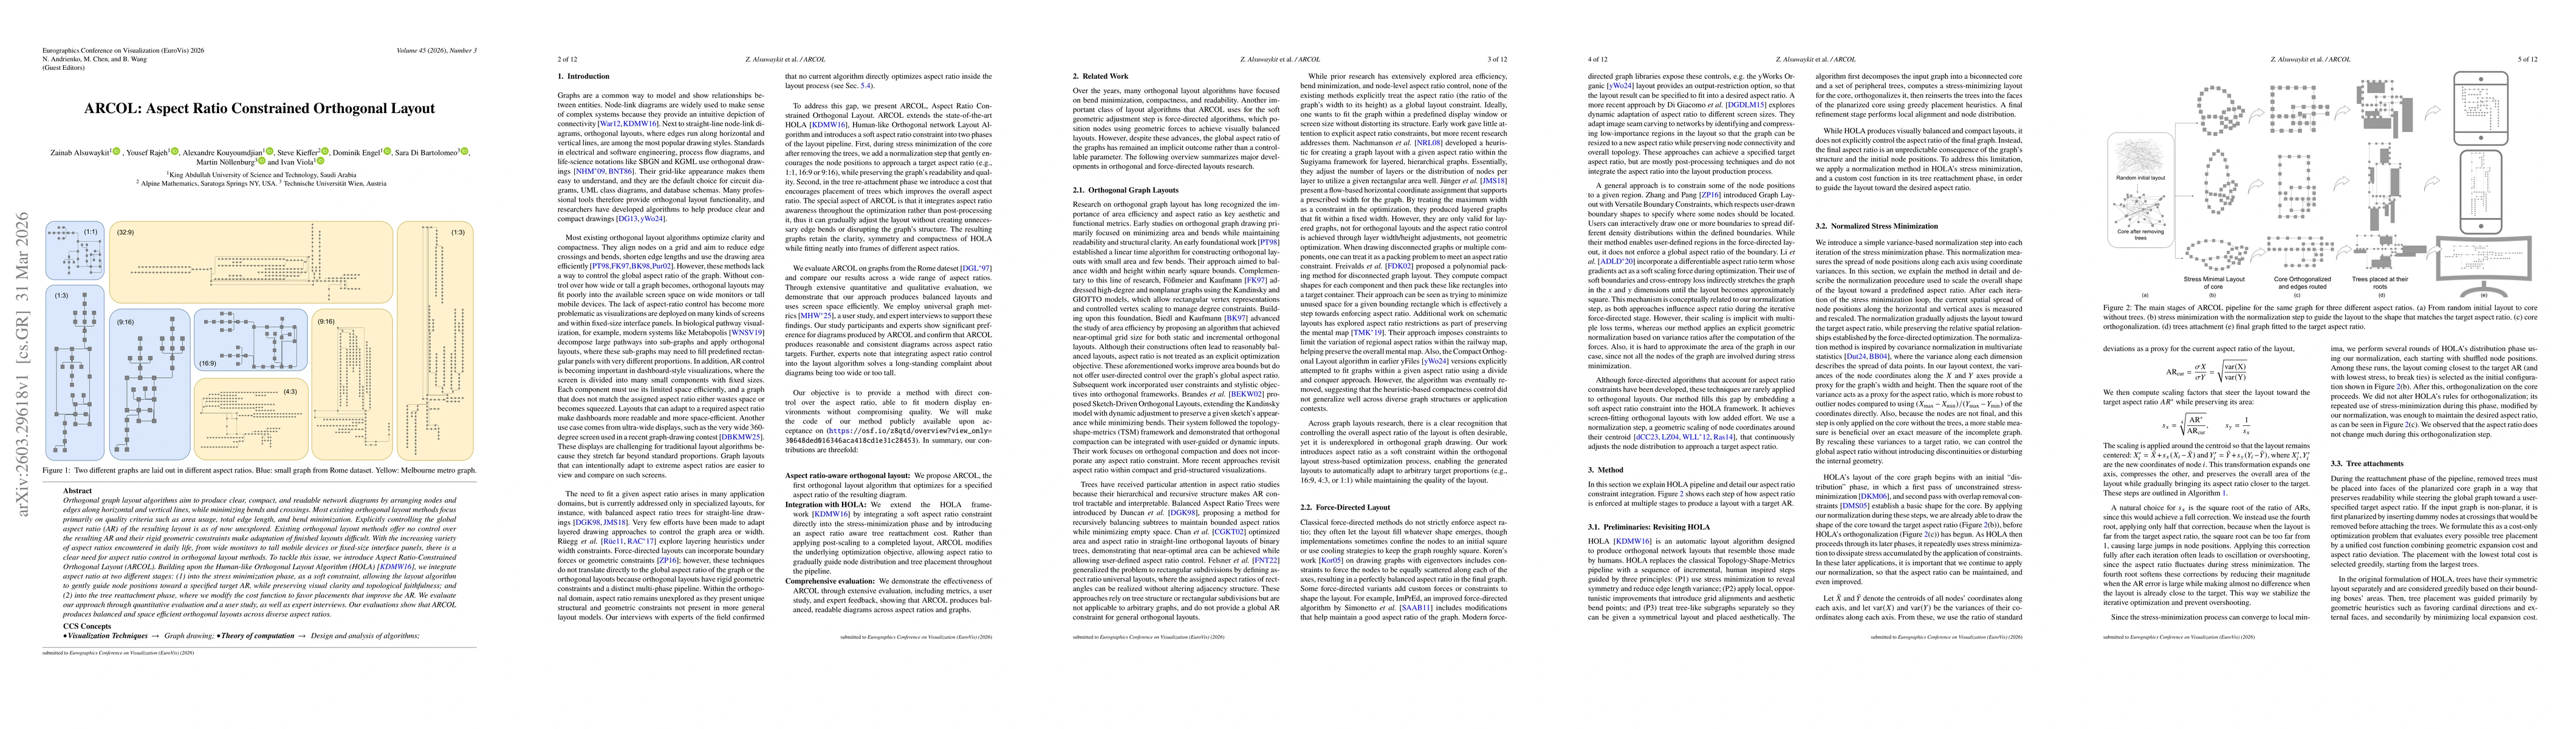
Orthogonal graph layout algorithms aim to produce clear, compact, and readable network diagrams by arranging nodes and edges along horizontal and vertical lines, while minimizing bends and crossings. ...
A linkage $\mathcal{L}$ consists of a graph $G=(V,E)$ and an edge-length function $\ell$. Deciding whether $\mathcal{L}$ can be realized as a planar straight-line embedding in $\mathbb{R}^2$ with edge...