Quick Summary:

This paper surveys current algorithmic methods for computing schematic network maps, emphasizing the trade-offs between computational complexity and interactivity. It analyzes how algorithmic choices impact running time and suitability for different applications, and explores future opportunities for schematic maps in data visualization.

Summary

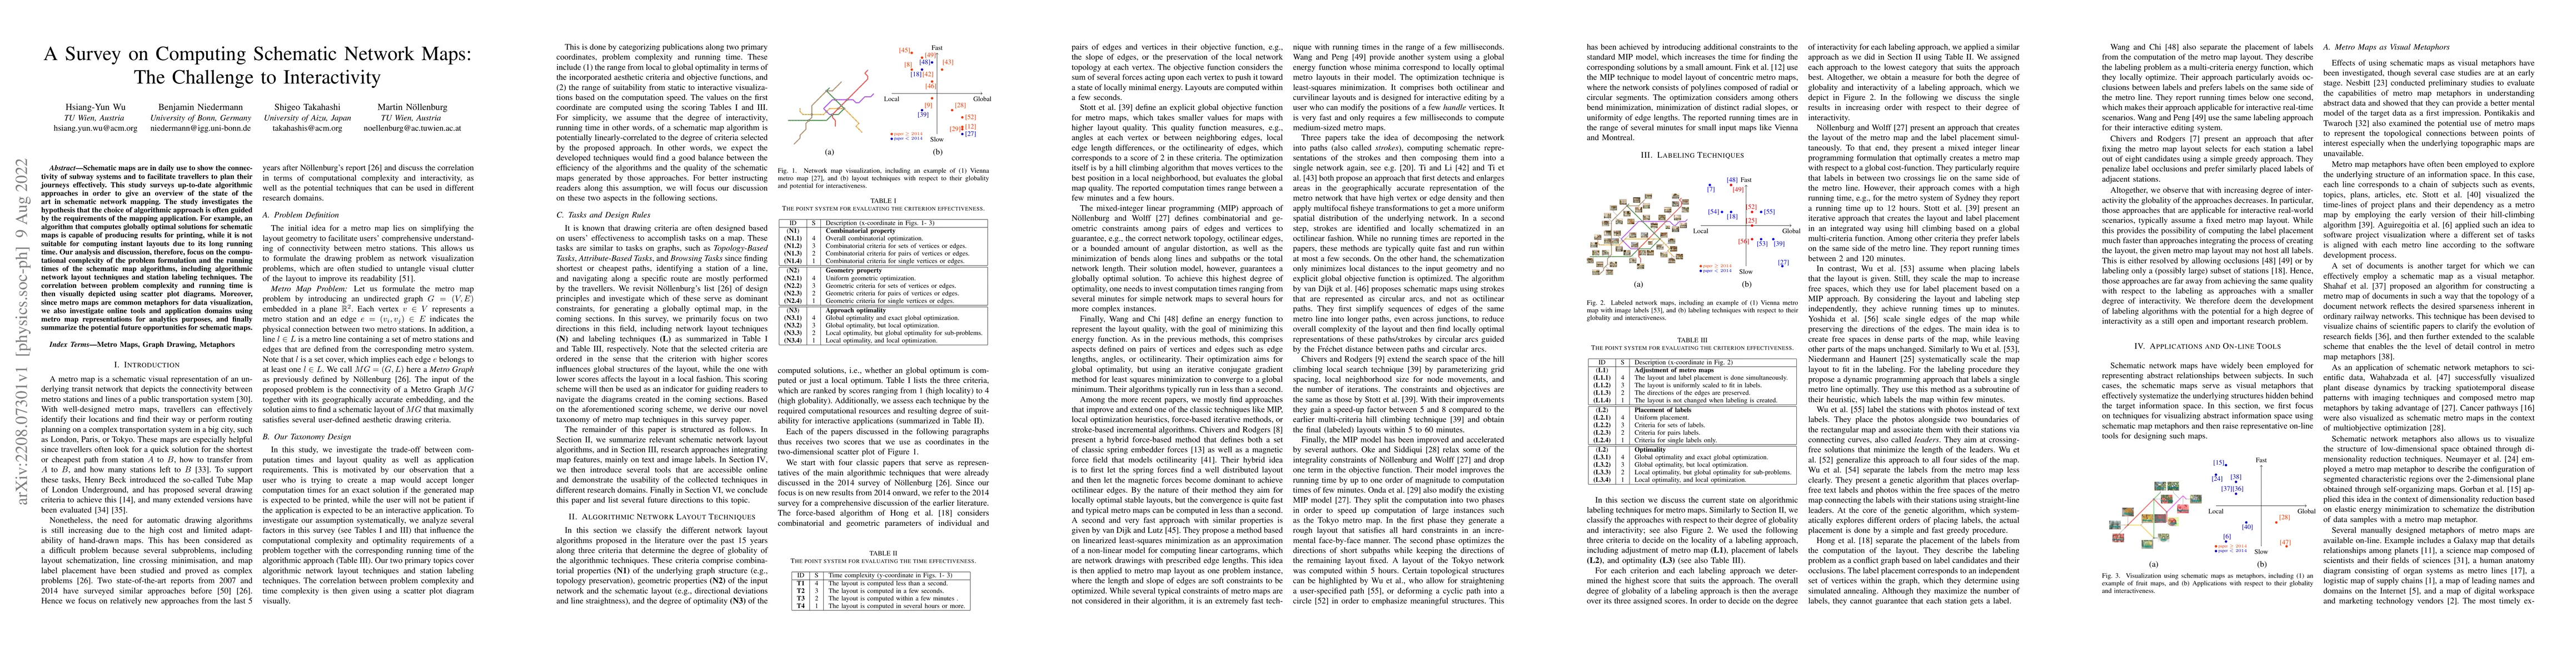
Schematic maps are in daily use to show the connectivity of subway systems and to facilitate travellers to plan their journeys effectively. This study surveys up-to-date algorithmic approaches in order to give an overview of the state of the art in schematic network mapping. The study investigates the hypothesis that the choice of algorithmic approach is often guided by the requirements of the mapping application. For example, an algorithm that computes globally optimal solutions for schematic maps is capable of producing results for printing, while it is not suitable for computing instant layouts due to its long running time. Our analysis and discussion, therefore, focus on the computational complexity of the problem formulation and the running times of the schematic map algorithms, including algorithmic network layout techniques and station labeling techniques. The correlation between problem complexity and running time is then visually depicted using scatter plot diagrams. Moreover, since metro maps are common metaphors for data visualization, we also investigate online tools and application domains using metro map representations for analytics purposes, and finally summarize the potential future opportunities for schematic maps.

AI Key Findings

Get AI-generated insights about this paper's methodology, results, and significance.

Paper Details

PDF Preview

Download PDF

Key Terms

algorithmic (0.272)
algorithmic (0.261)
running (0.256)
running (0.252)
maps (0.246)
maps (0.242)
mapping (0.188)
mapping (0.183)
map (0.168)
map (0.168)
complexity (0.157)
complexity (0.154)
layout (0.145)
techniques (0.144)
application (0.143)
plan (0.143)
daily (0.142)
labeling (0.141)
plan (0.140)
application (0.140)

Citation Network

Current paper (gray), citations (green), references (blue)

Current Paper
Citations
References
Click to view

Similar Papers

Found 4 papers
Title Authors Year Actions
UnDRground Tubes: Exploring Spatial Data with Multidimensional Projections and Set Visualization
Nikolaus Piccolotto, Mark Wallinger, S. Miksch, M. Bögl
2024
View Paper
Catchment Cell Visualization for Multi-Modal Public Transportation Networks
Lukas Arzoumanidis, Axel Forsch, J. Haunert, Youness Dehbi
2023
View Paper
Computing Data-driven Multilinear Metro Maps
Martin Nöllenburg, Soeren Terziadis
2023
View Paper
Revealing Schematic Map Designs with Preservation of Relativity in Node Position and Segment Length in Existing Official Maps
Peng Ti, Hao Wu, Zhilin Li, Mingyao Li, Ruyu Dai, Tao Xiong
2023
View Paper
Algorithmically-assisted interactive metro map design (demo paper): "it looks like you're designing a metro map. would you like help?"
Thomas C. van Dijk, Tim Janiak
2022
View Paper
Shape‐Guided Mixed Metro Map Layout
Tobias Batik, Soeren Terziadis, Yu-Shuen Wang, M. Nöllenburg, Hsiang-Yun Wu
2022
View Paper
Multimodal travel‐time maps with formally correct and schematic isochrones
Axel Forsch, Youness Dehbi, Benjamin Niedermann, Johannes Oehrlein, P. Rottmann, J. Haunert
2021
View Paper
A Survey on Transit Map Layout – from Design, Machine, and Human Perspectives
Hsiang-Yun Wu, Benjamin Niedermann, Shigeo Takahashi, M. Roberts, M. Nöllenburg
2020
View Paper
Towards Data-Driven Multilinear Metro Maps
S. Nickel, M. Nöllenburg
2019
View Paper
Coordinated Schematization for Visualizing Mobility Patterns on Networks
B. Custers, Wouter Meulemans, B. Speckmann, Kevin Verbeek
2021
View Paper
Interactive Design of Metro Maps
Tim Janiak
2021
View Paper
Formal Techniques for Safety-Critical Systems: 7th International Workshop, FTSCS 2019, Shenzhen, China, November 9, 2019, Revised Selected Papers
Simone Diniz Junqueira Barbosa, Phoebe Chen, A. Cuzzocrea, Xiaoyong Du, Orhun Kara, Ting Liu, K. Sivalingam, D. Ślęzak, T. Washio, Xiaokang Yang, Junsong Yuan, R. Prates, O. Hasan, F. Mallet
2020
View Paper
Diagrammatic Representation and Inference: 11th International Conference, Diagrams 2020, Tallinn, Estonia, August 24–28, 2020, Proceedings
P. Chapman, L. B. Smet, Valeria Giardino, J. Corter, Sven Linker
2020
View Paper

Comments (0)

This website uses cookies to ensure you get the best experience. Learn more