Publication
Metrics
AI Quick Summary
LinSets.zip introduces a method to compress linear set diagrams by minimizing gaps and allowing multiple non-intersecting sets to share the same row, thereby reducing the height of the visualization. The approach uses integer-linear programming and heuristics for efficient computation and was evaluated both quantitatively and through user experiments.
Paper Preview
Abstract
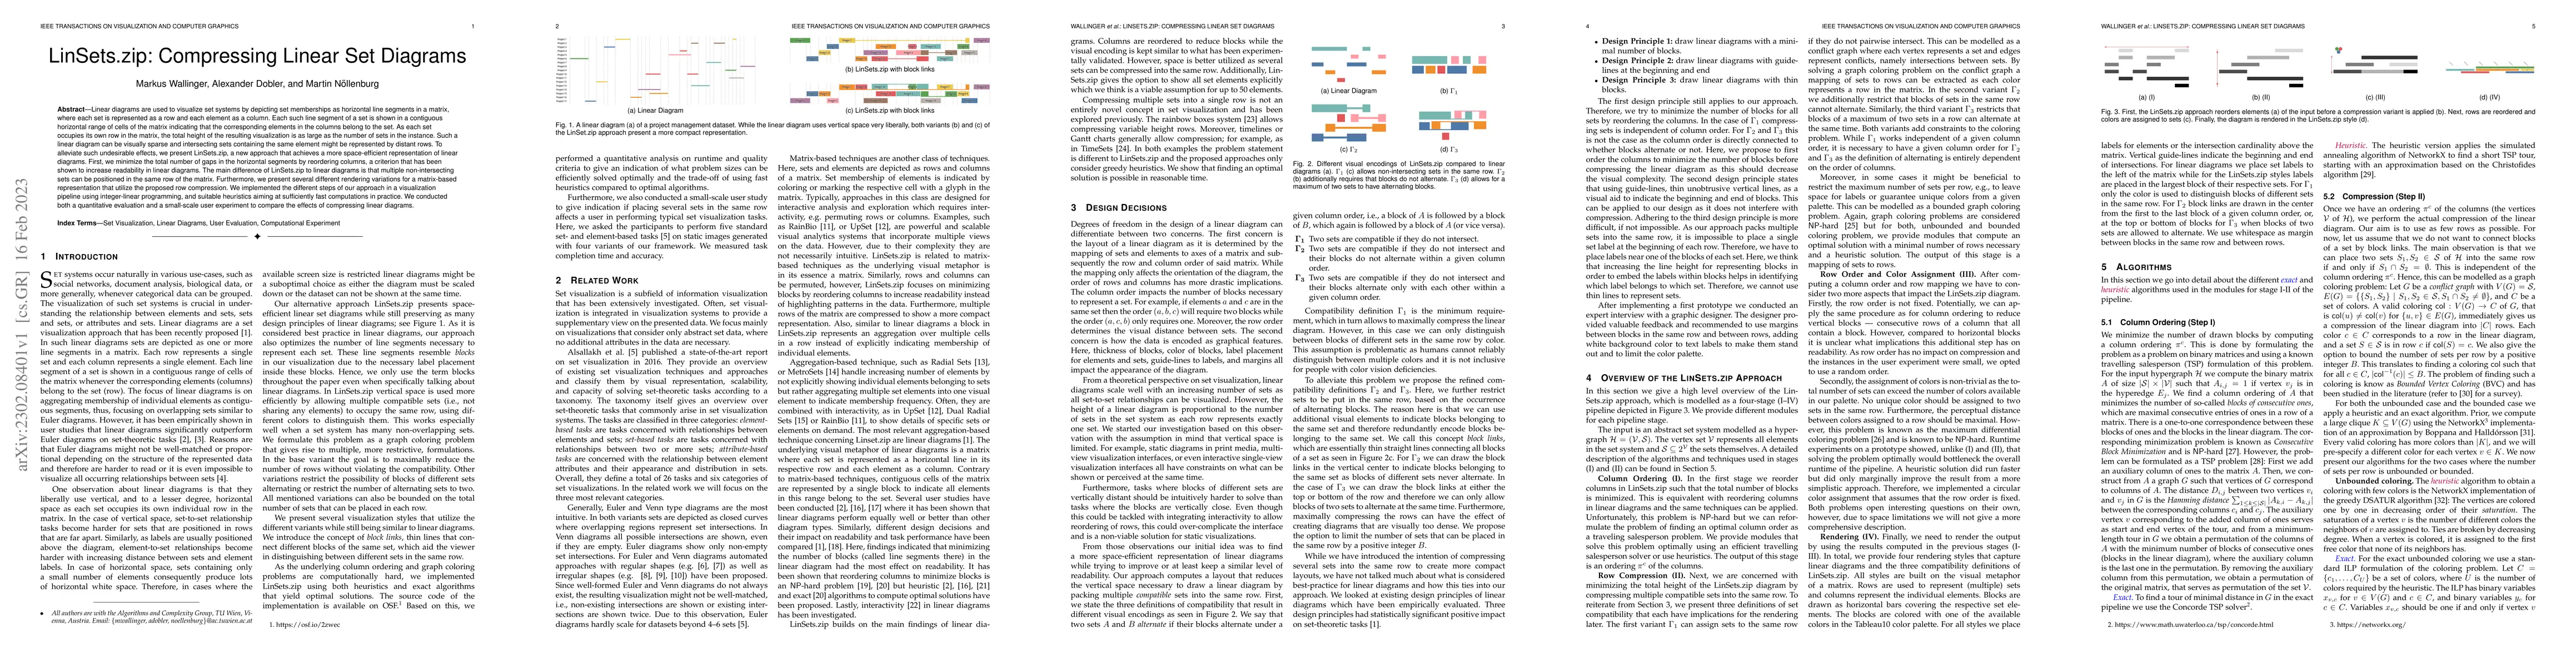
Linear diagrams are used to visualize set systems by depicting set memberships as horizontal line segments in a matrix, where each set is represented as a row and each element as a column. Each such line segment of a set is shown in a contiguous horizontal range of cells of the matrix indicating that the corresponding elements in the columns belong to the set. As each set occupies its own row in the matrix, the total height of the resulting visualization is as large as the number of sets in the instance. Such a linear diagram can be visually sparse and intersecting sets containing the same element might be represented by distant rows. To alleviate such undesirable effects, we present LinSets.zip, a new approach that achieves a more space-efficient representation of linear diagrams. First, we minimize the total number of gaps in the horizontal segments by reordering columns, a criterion that has been shown to increase readability in linear diagrams. The main difference of LinSets.zip to linear diagrams is that multiple non-intersecting sets can be positioned in the same row of the matrix. Furthermore, we present several different rendering variations for a matrix-based representation that utilize the proposed row compression. We implemented the different steps of our approach in a visualization pipeline using integer-linear programming, and suitable heuristics aiming at sufficiently fast computations in practice. We conducted both a quantitative evaluation and a small-scale user experiment to compare the effects of compressing linear diagrams.
AI Key Findings
Get AI-generated insights about this paper's methodology, results, significance, and more — seven facets brought into focus.
Impact
Paper Details
Authors
PDF Preview
Key Terms
Citation Network
Current paper (gray), citations (green), references (blue)
Display is limited for performance on very large graphs.
Discussion 0