Academic Profile
Statistics
Similar Authors
Papers on arXiv
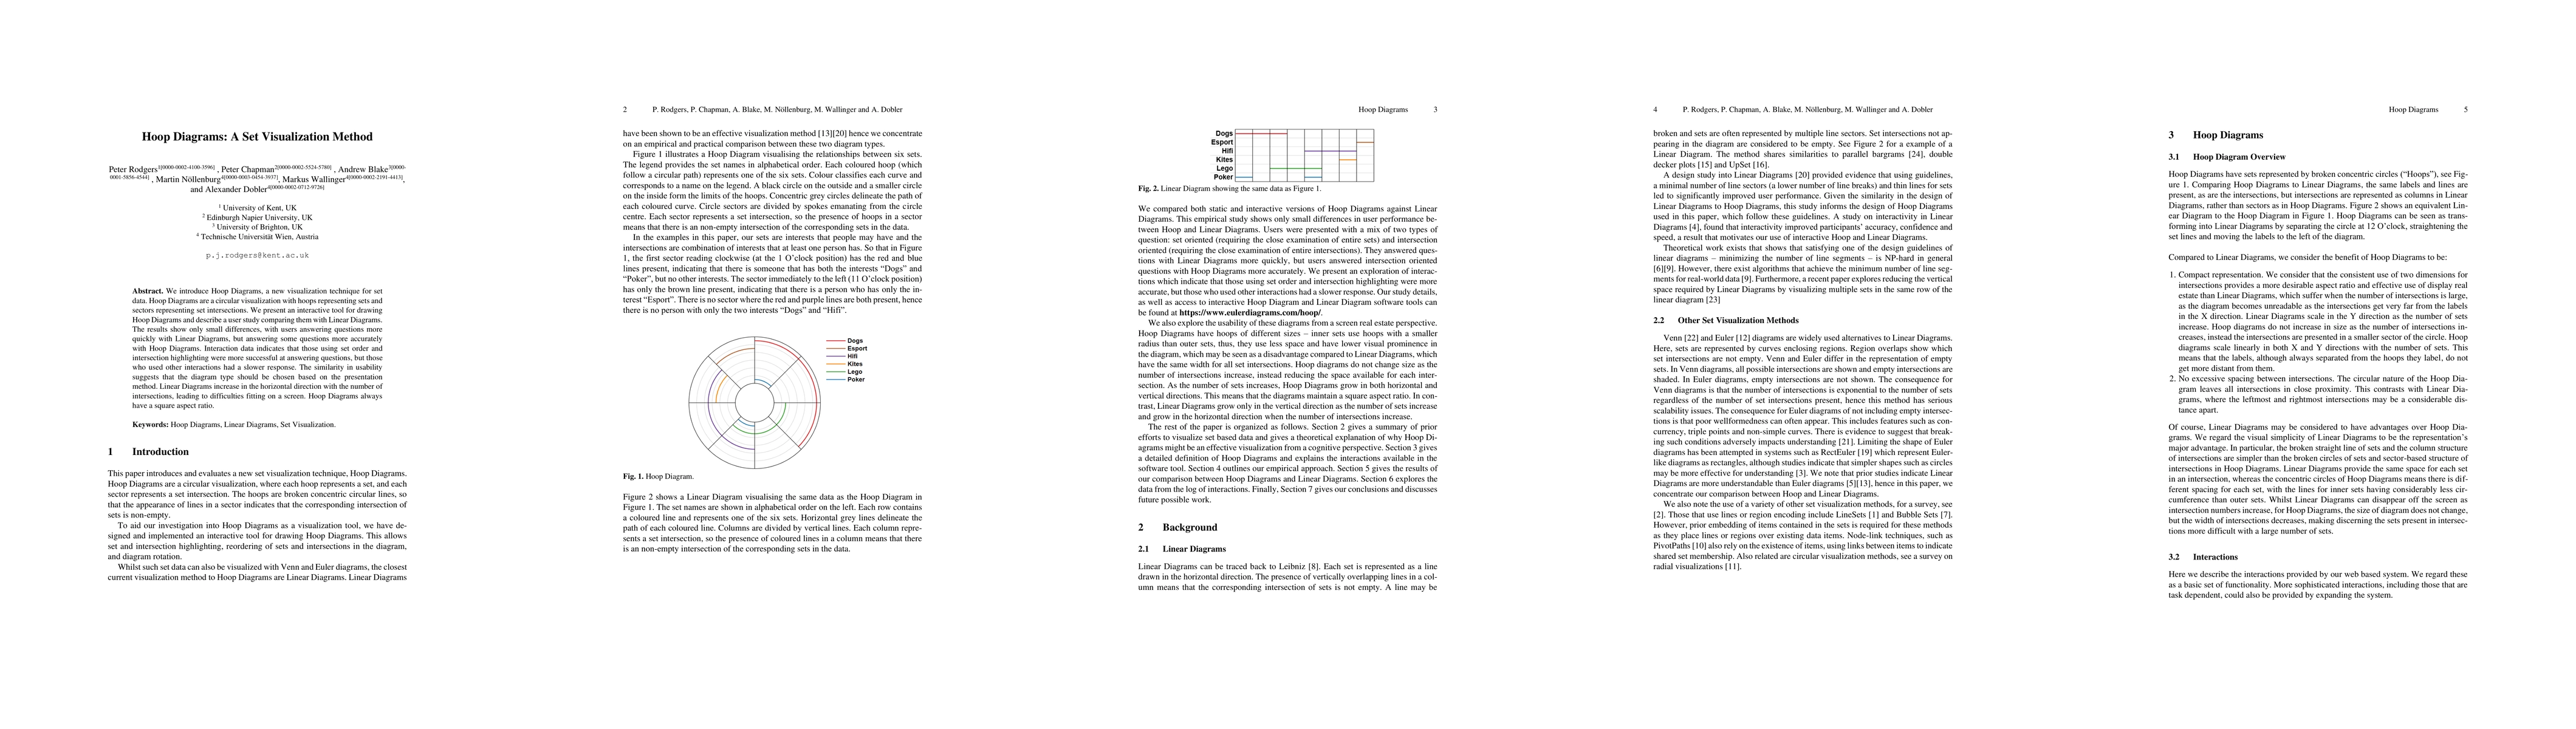
We introduce Hoop Diagrams, a new visualization technique for set data. Hoop Diagrams are a circular visualization with hoops representing sets and sectors representing set intersections. We present...
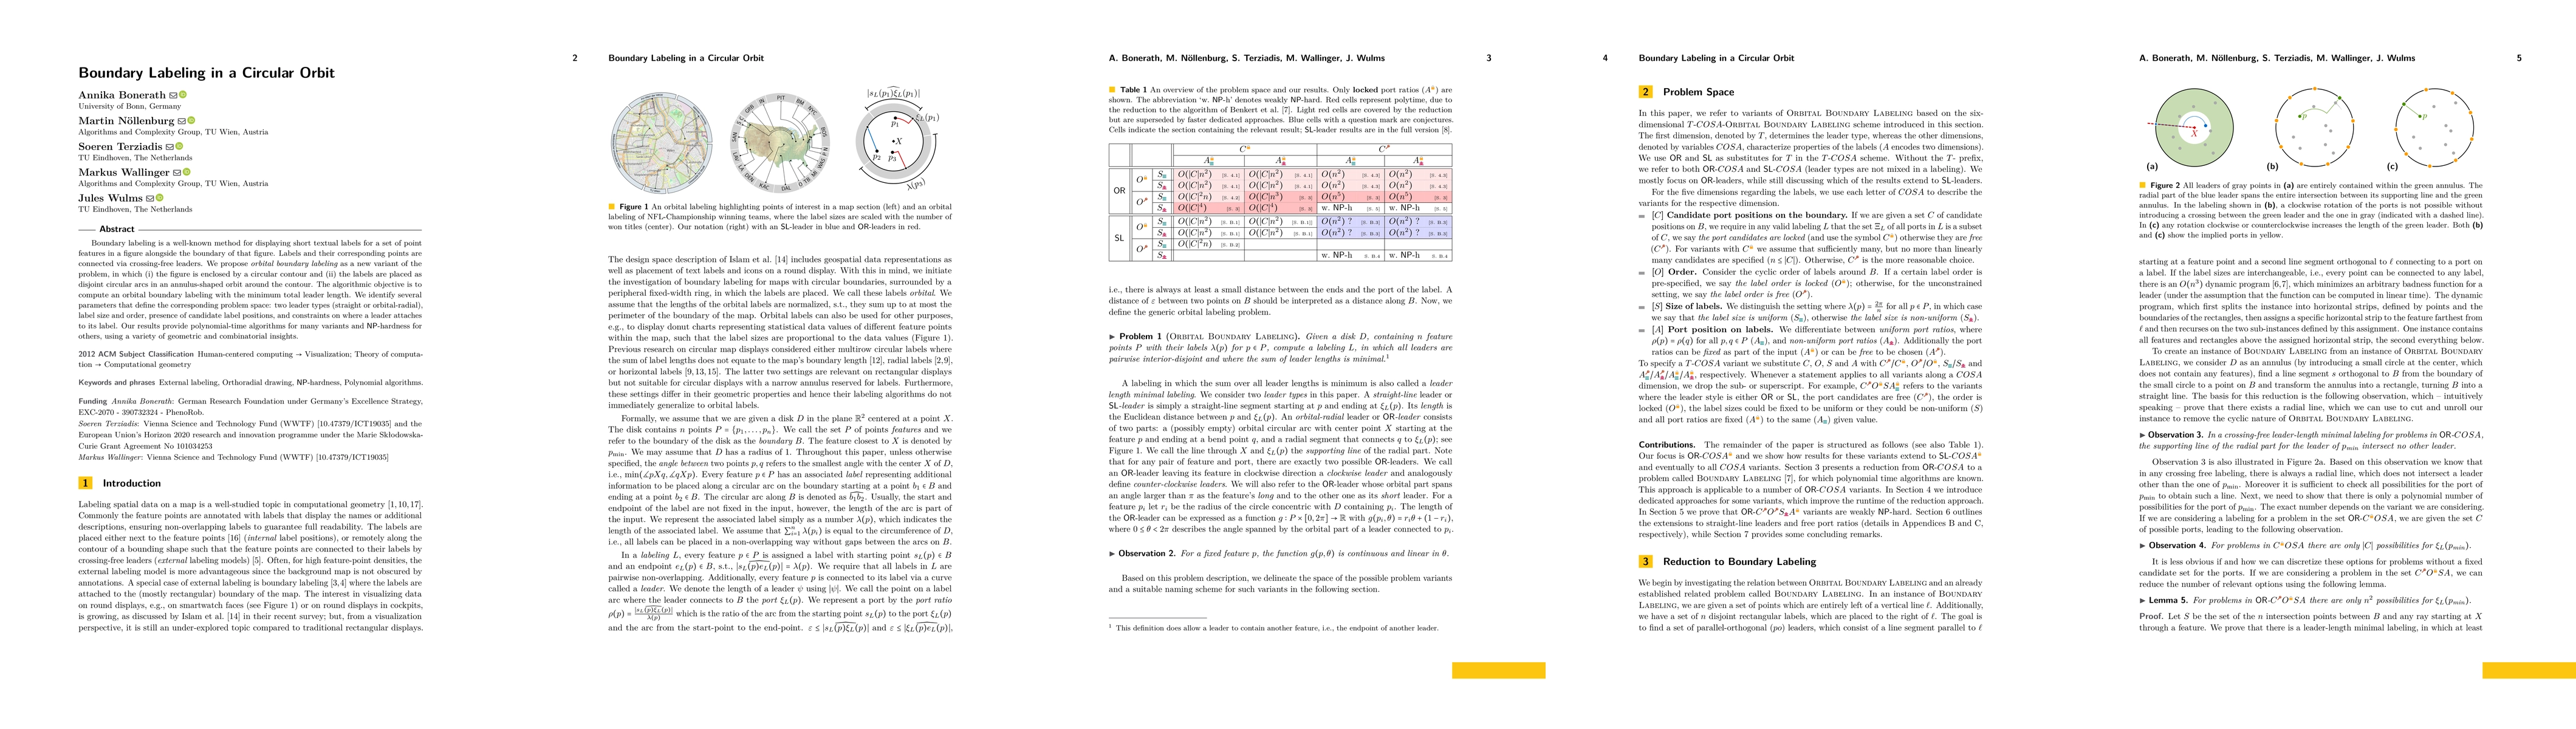
Schematic depictions in text books and maps often need to label specific point features with a text label. We investigate one variant of such a labeling, where the image contour is a circle and the ...
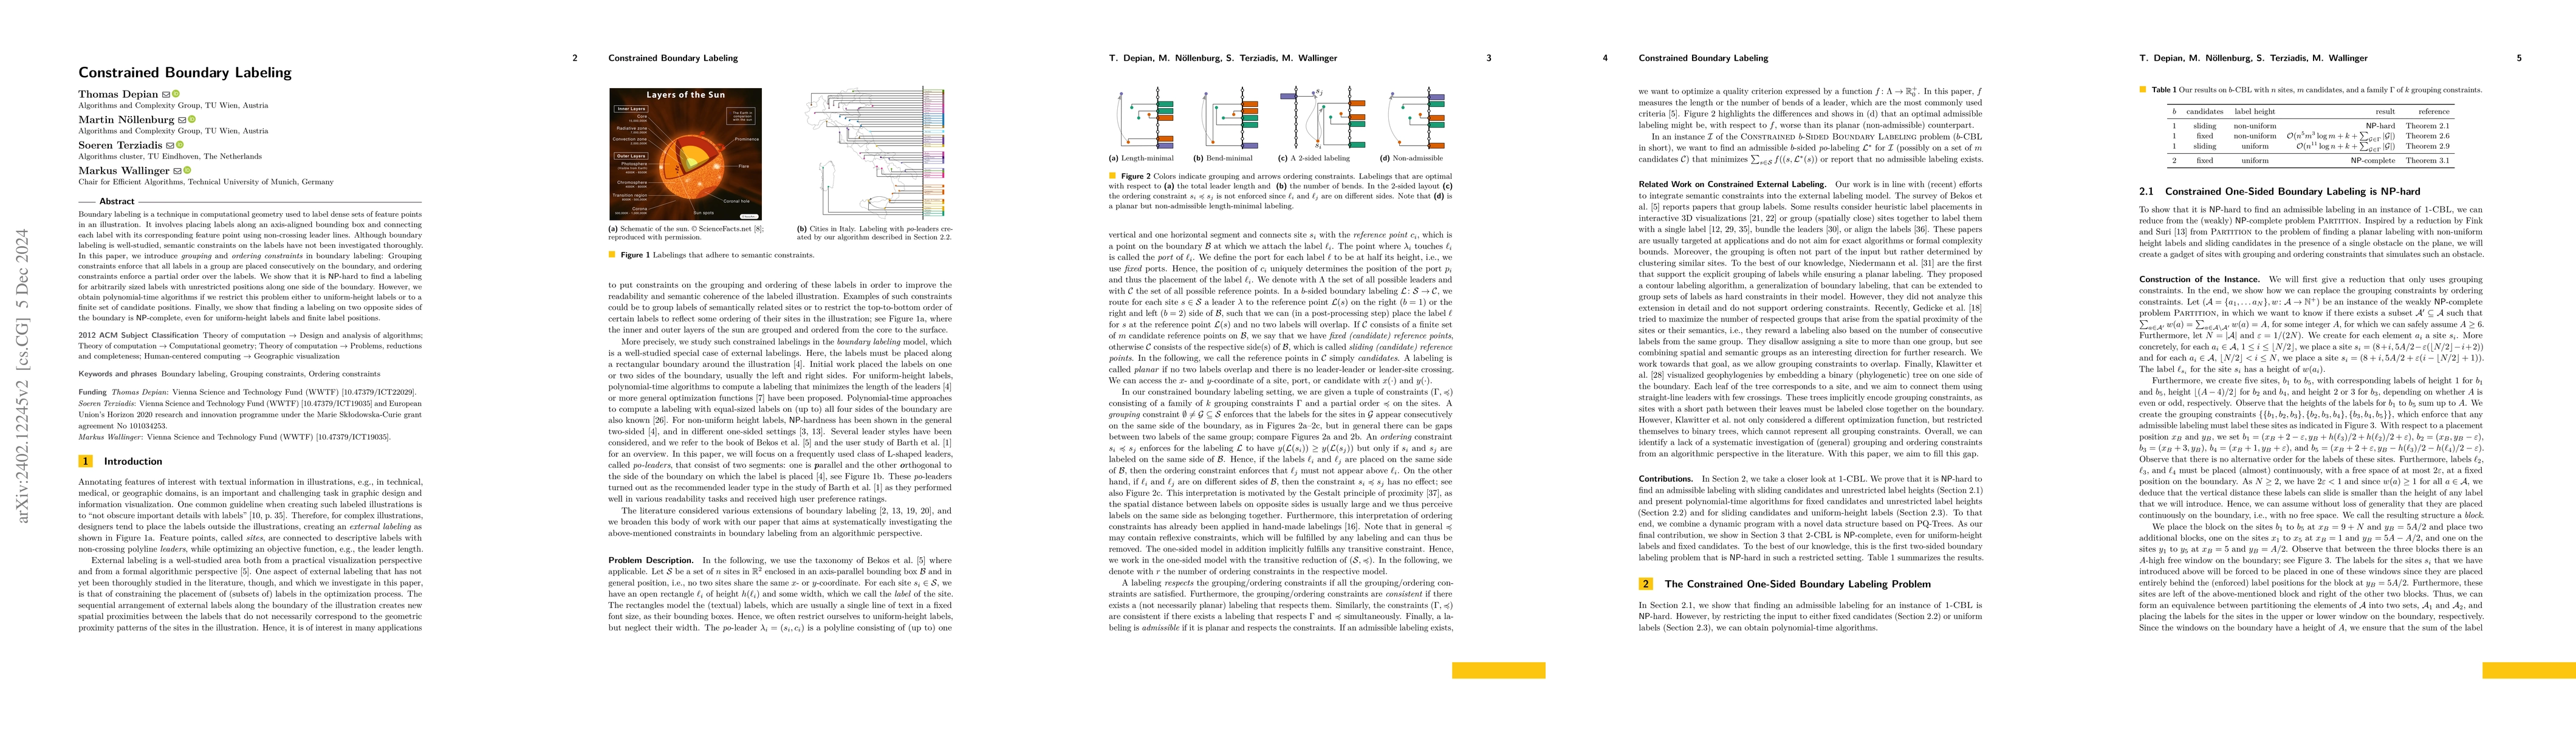
Boundary labeling is a technique used to label dense sets of feature points in an illustration. It involves placing labels along a rectangular boundary box and connecting each label with its corresp...
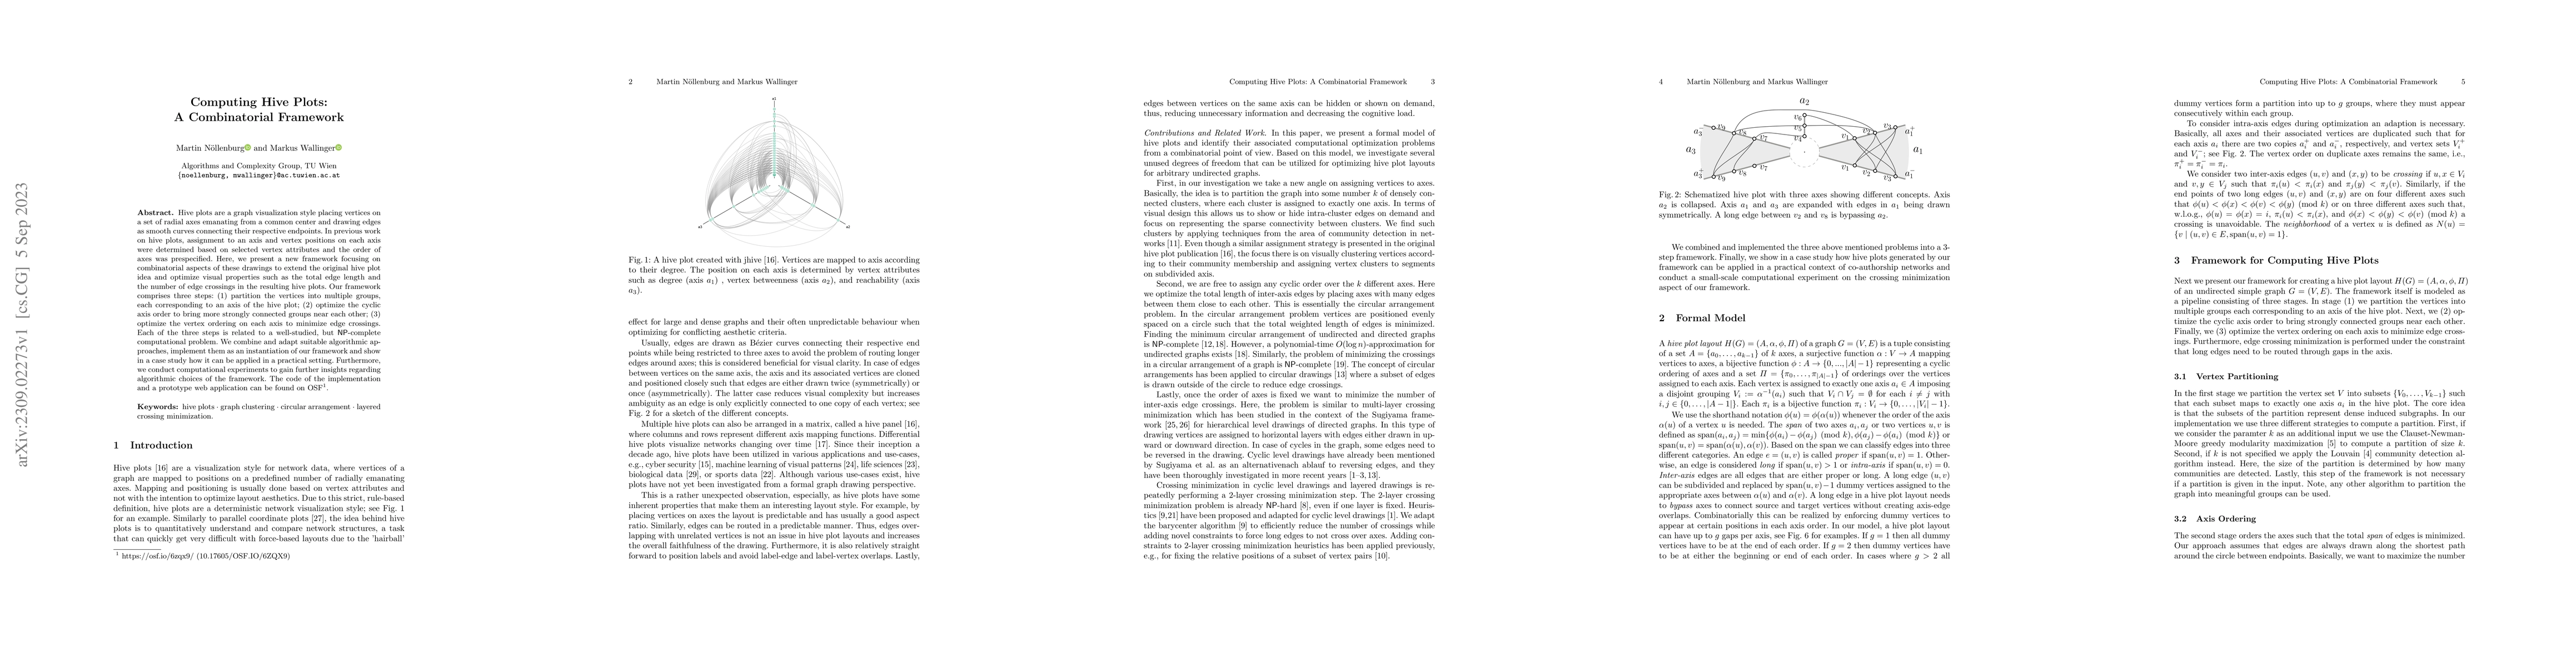
Hive plots are a graph visualization style placing vertices on a set of radial axes emanating from a common center and drawing edges as smooth curves connecting their respective endpoints. In previo...
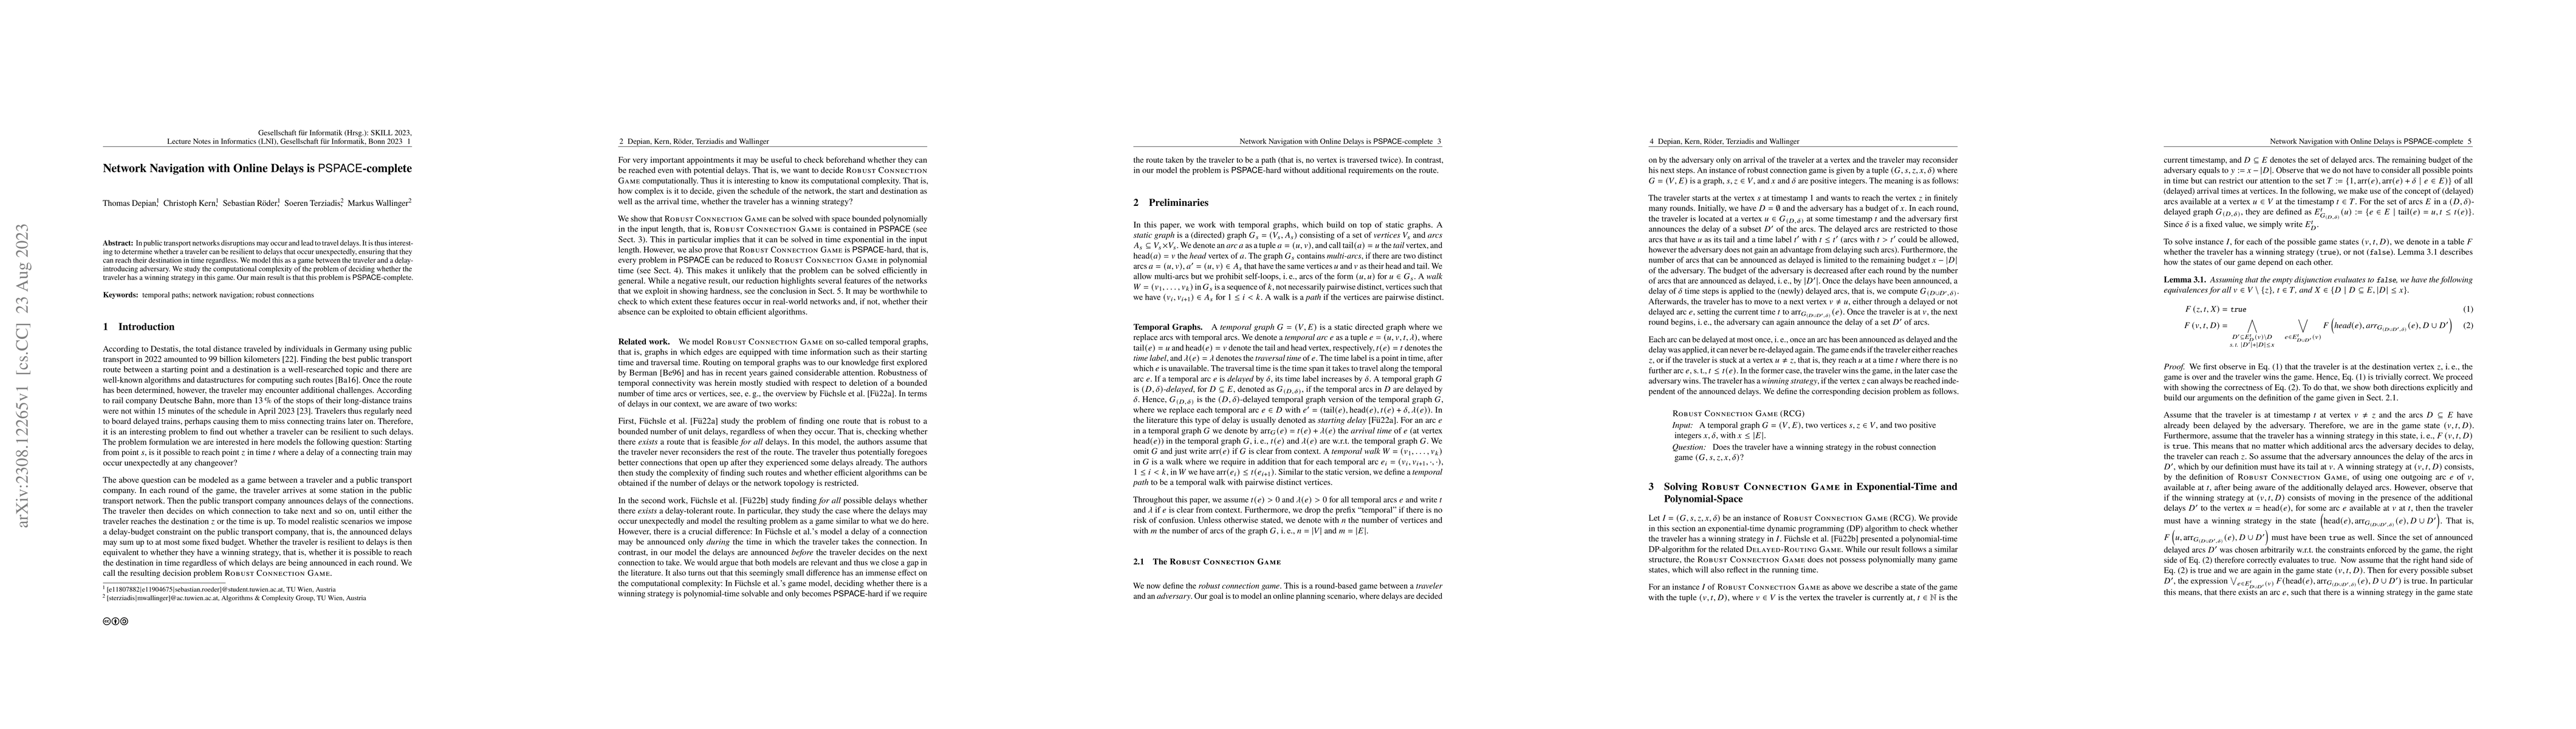
In public transport networks disruptions may occur and lead to travel delays. It is thus interesting to determine whether a traveler can be resilient to delays that occur unexpectedly, ensuring that...
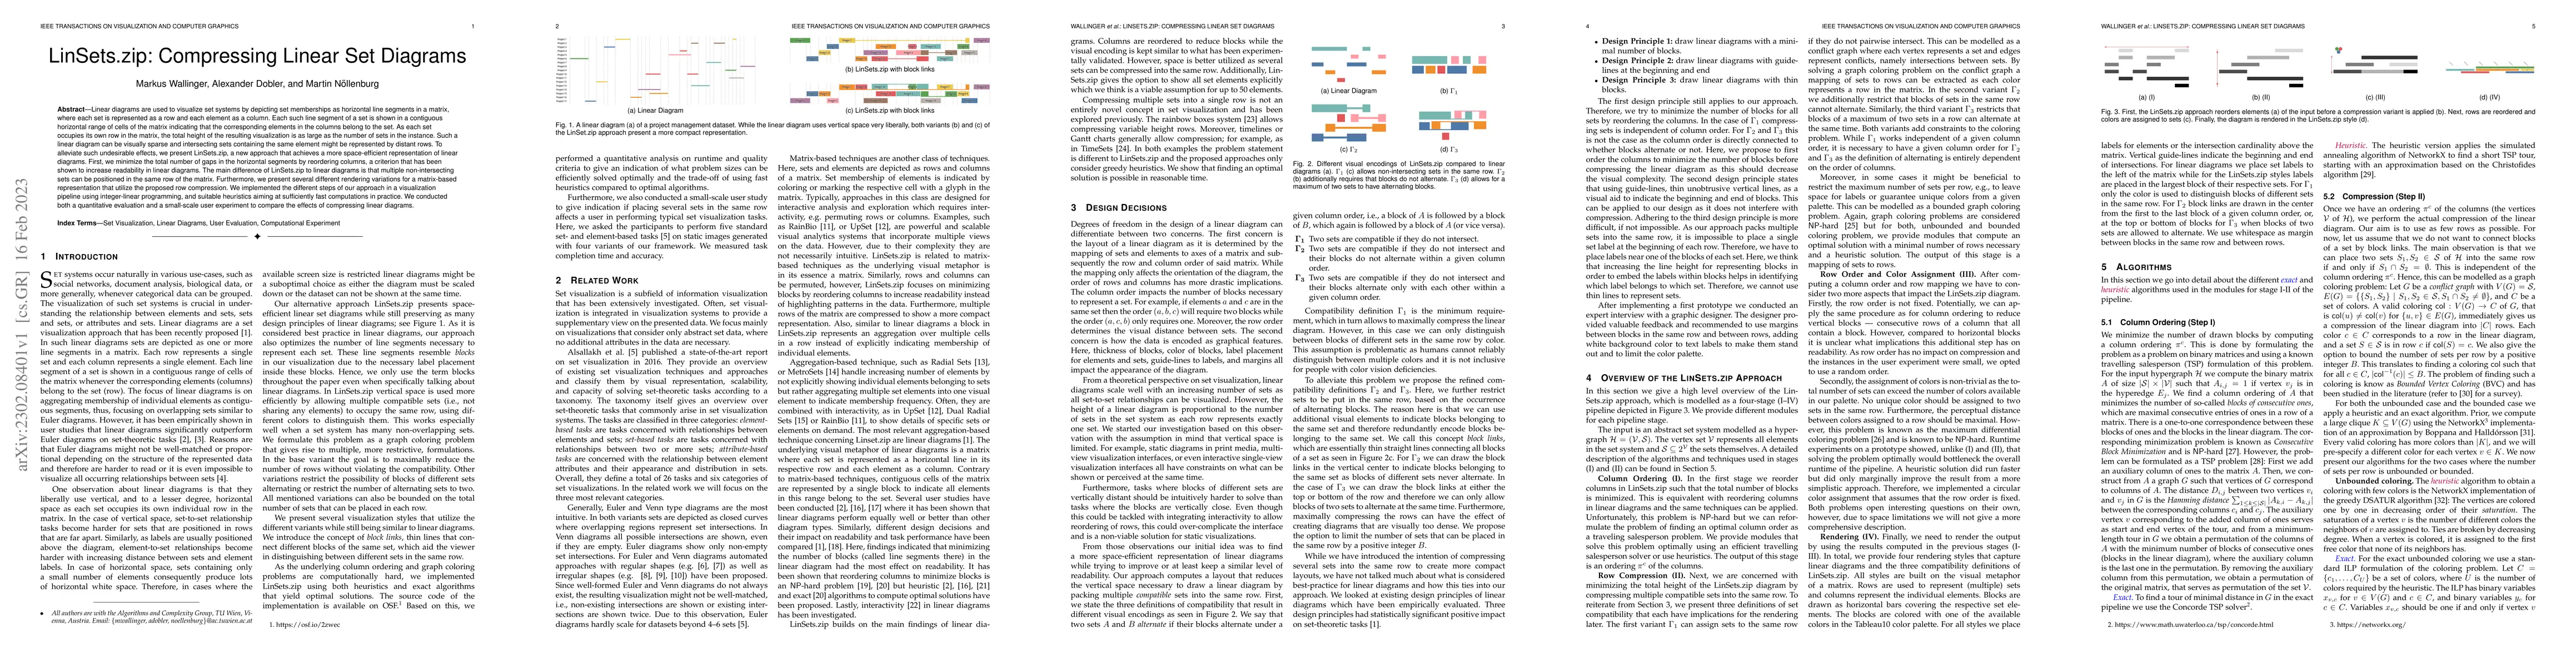
Linear diagrams are used to visualize set systems by depicting set memberships as horizontal line segments in a matrix, where each set is represented as a row and each element as a column. Each such...
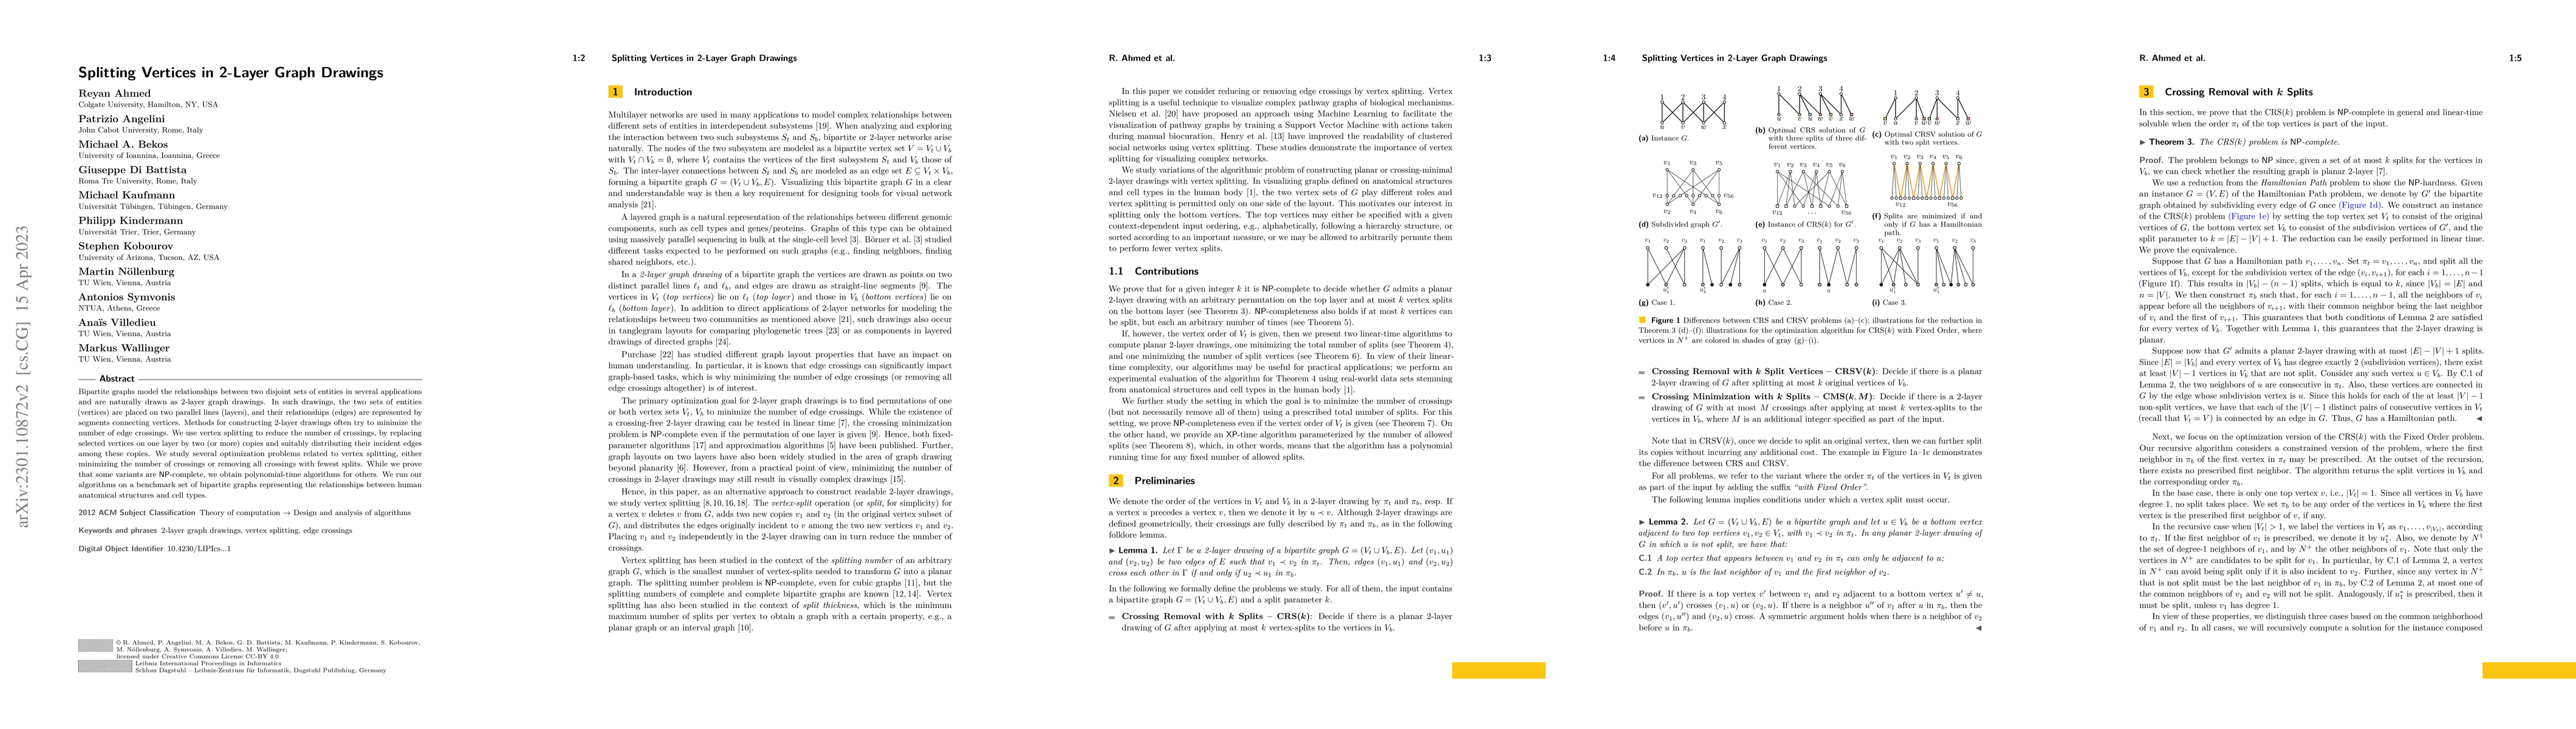
Bipartite graphs model the relationships between two disjoint sets of entities in several applications and are naturally drawn as 2-layer graph drawings. In such drawings, the two sets of entities (...
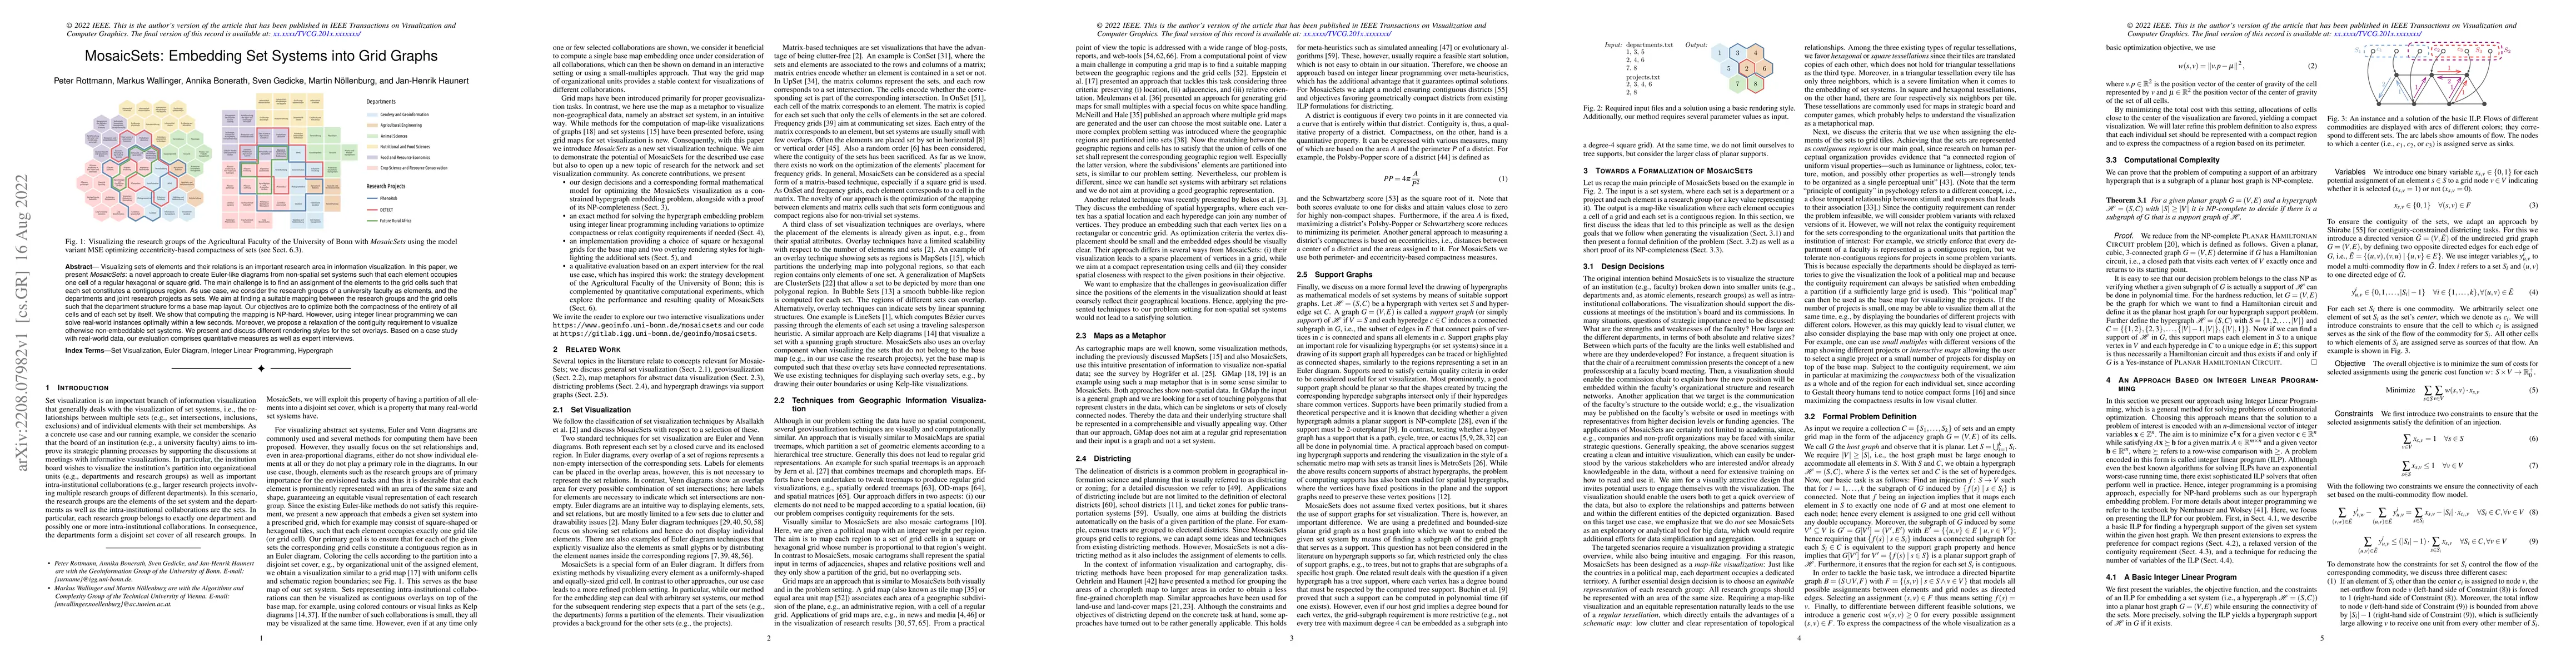
Visualizing sets of elements and their relations is an important research area in information visualization. In this paper, we present MosaicSets: a novel approach to create Euler-like diagrams from...
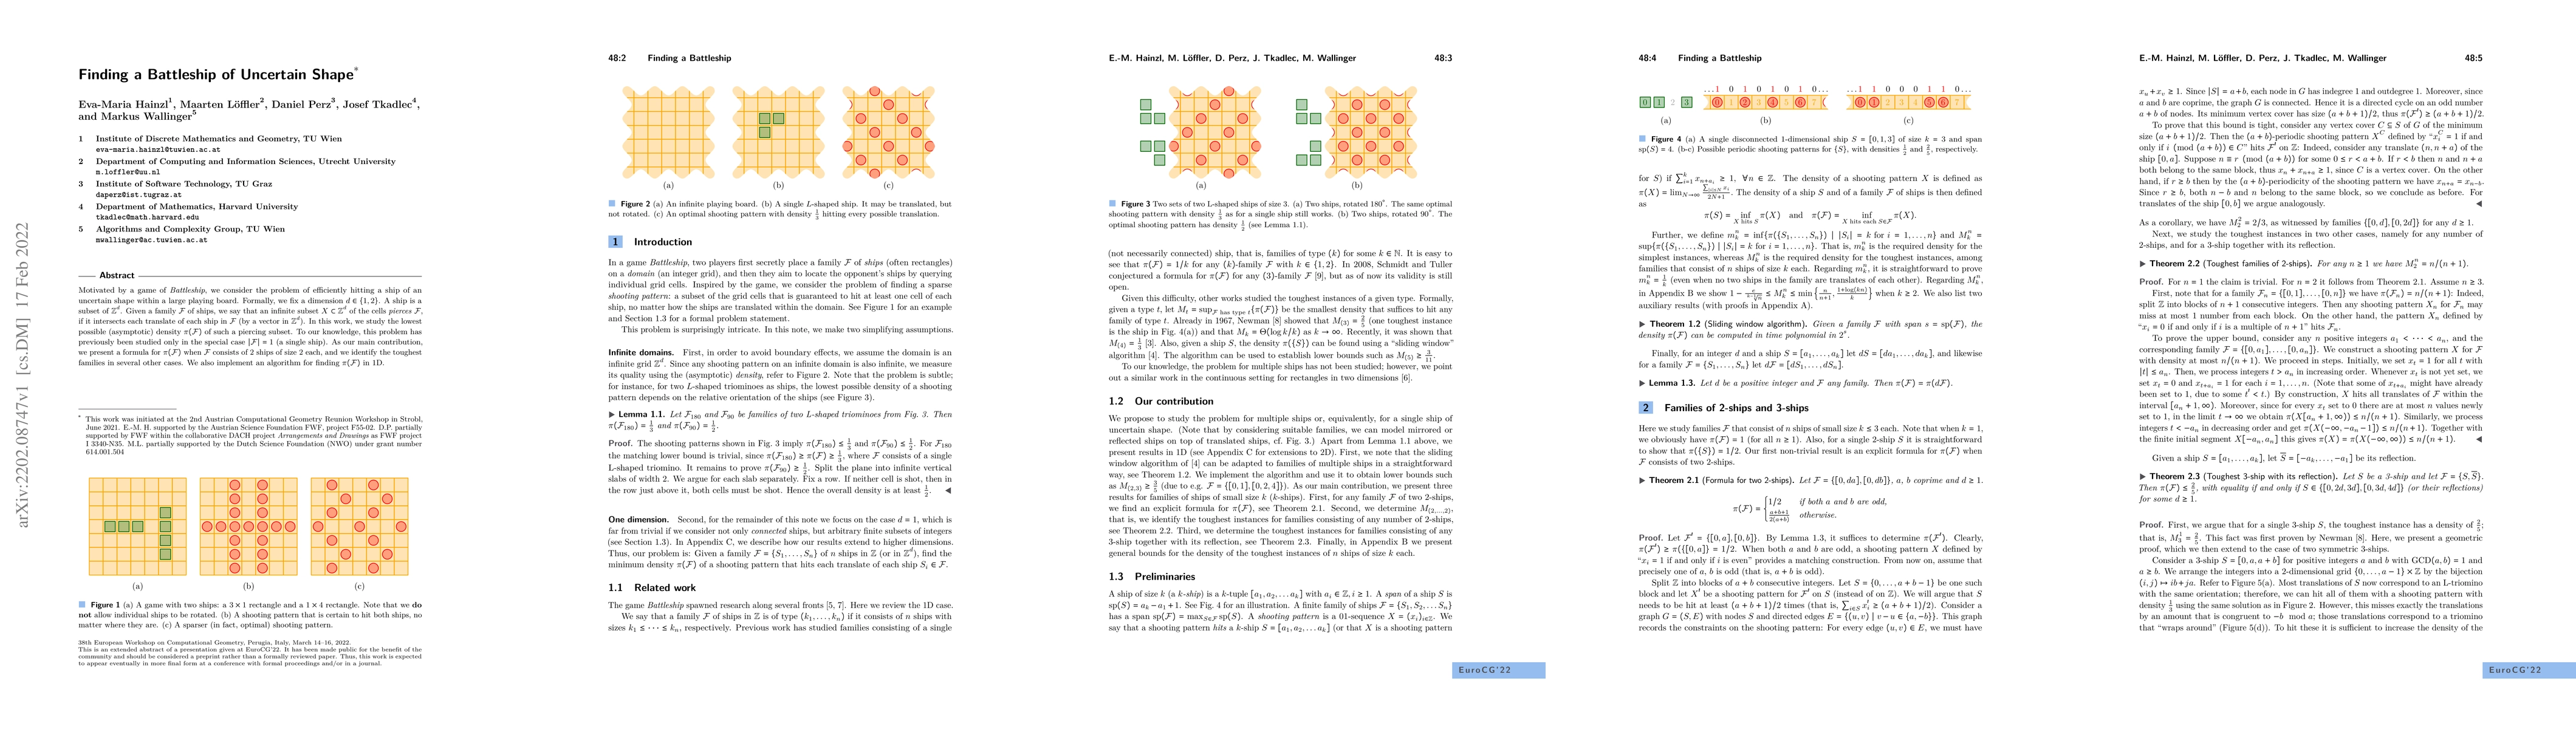
Motivated by a game of Battleship, we consider the problem of efficiently hitting a ship of an uncertain shape within a large playing board. Formally, we fix a dimension $d\in\{1,2\}$. A ship is a s...
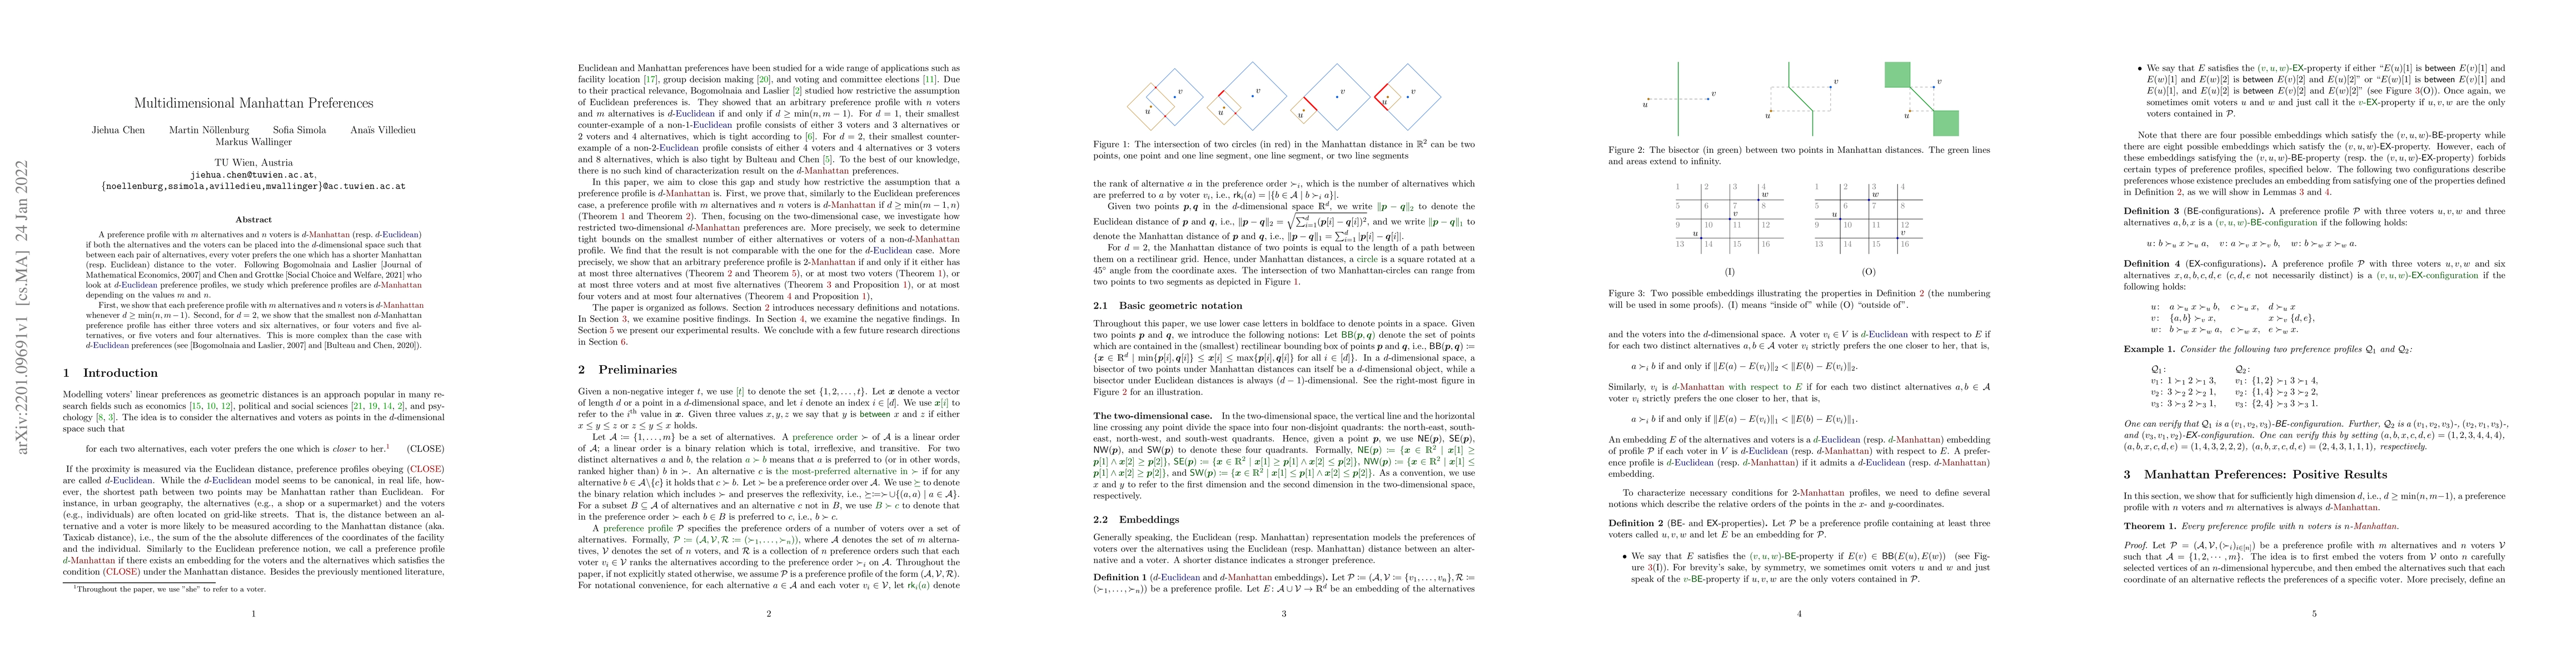
A preference profile with $m$ alternatives and $n$ voters is $d$-Manhattan (resp. $d$-Euclidean) if both the alternatives and the voters can be placed into the $d$-dimensional space such that betwee...
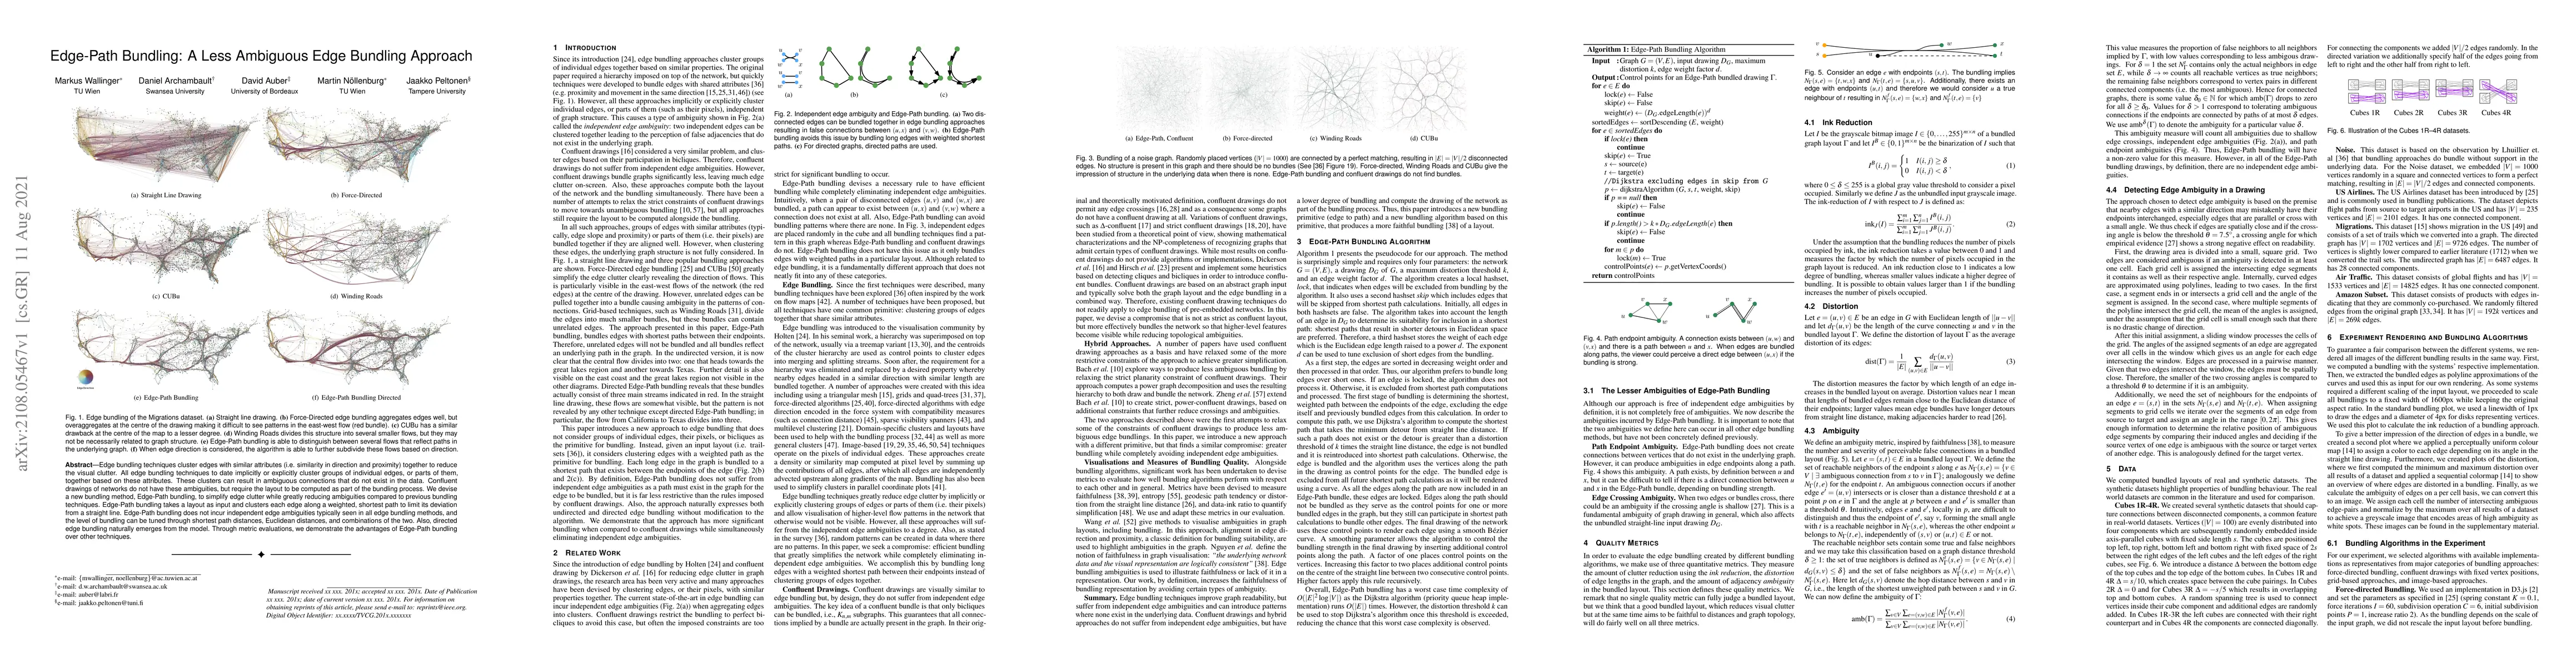
Edge bundling techniques cluster edges with similar attributes (i.e. similarity in direction and proximity) together to reduce the visual clutter. All edge bundling techniques to date implicitly or ...
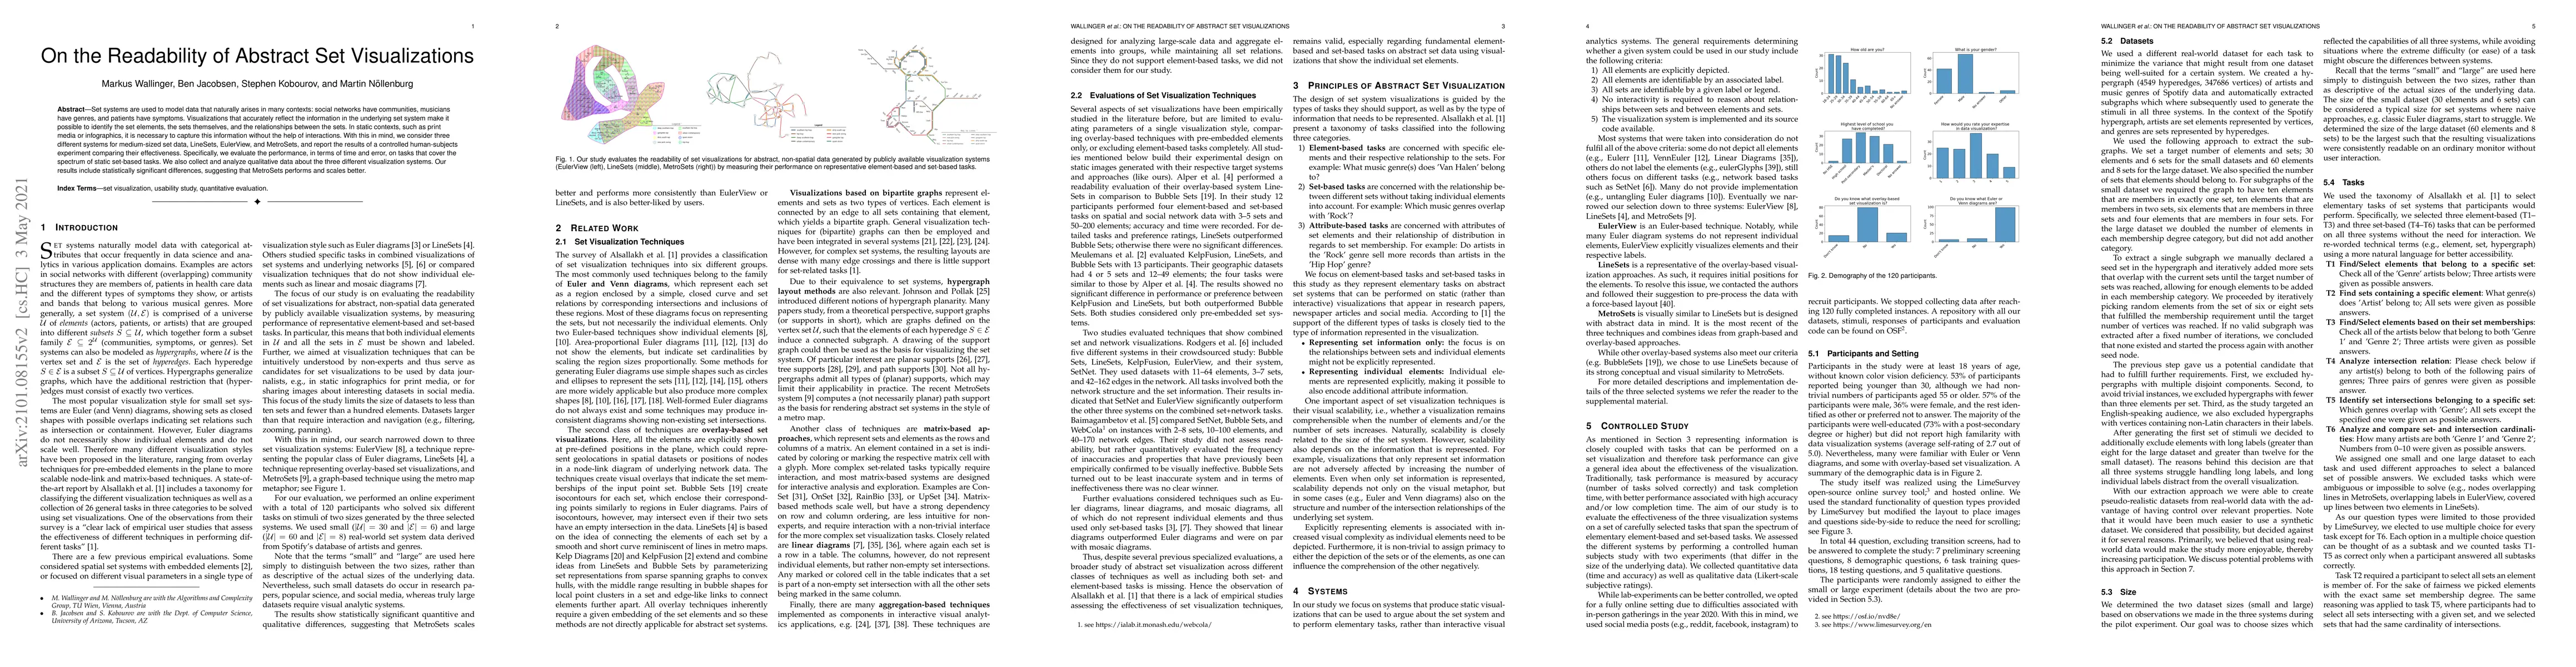
Set systems are used to model data that naturally arises in many contexts: social networks have communities, musicians have genres, and patients have symptoms. Visualizations that accurately reflect...
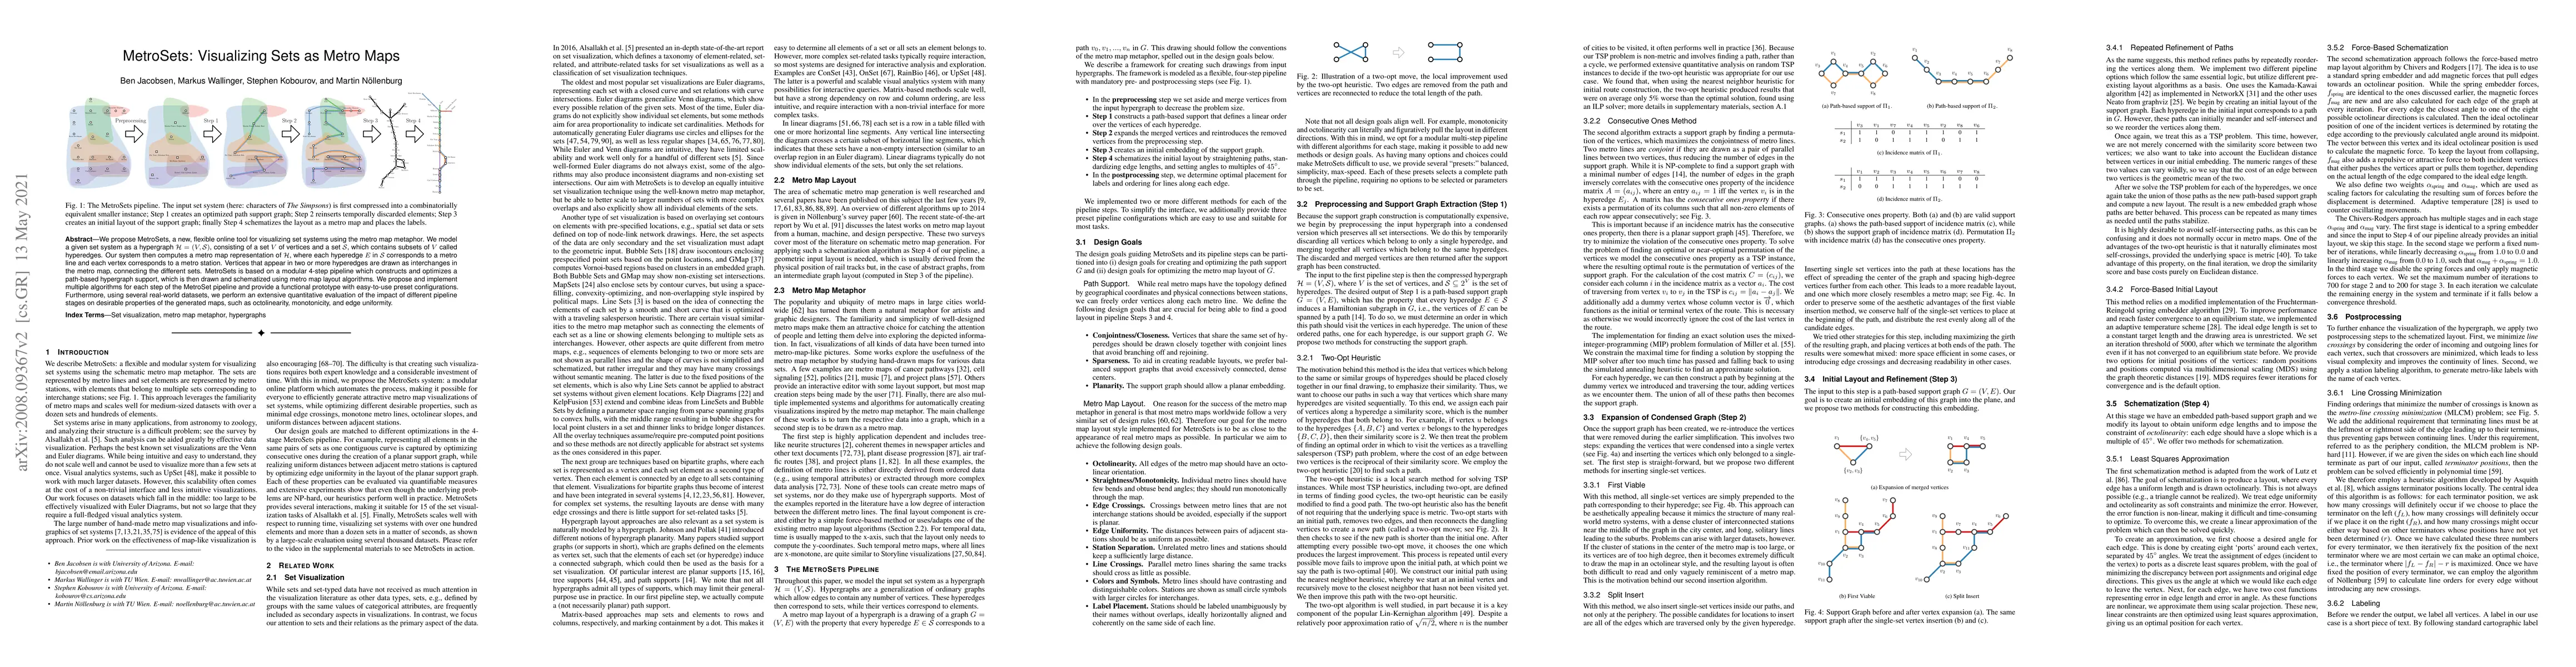
We propose MetroSets, a new, flexible online tool for visualizing set systems using the metro map metaphor. We model a given set system as a hypergraph $\mathcal{H} = (V, \mathcal{S})$, consisting o...
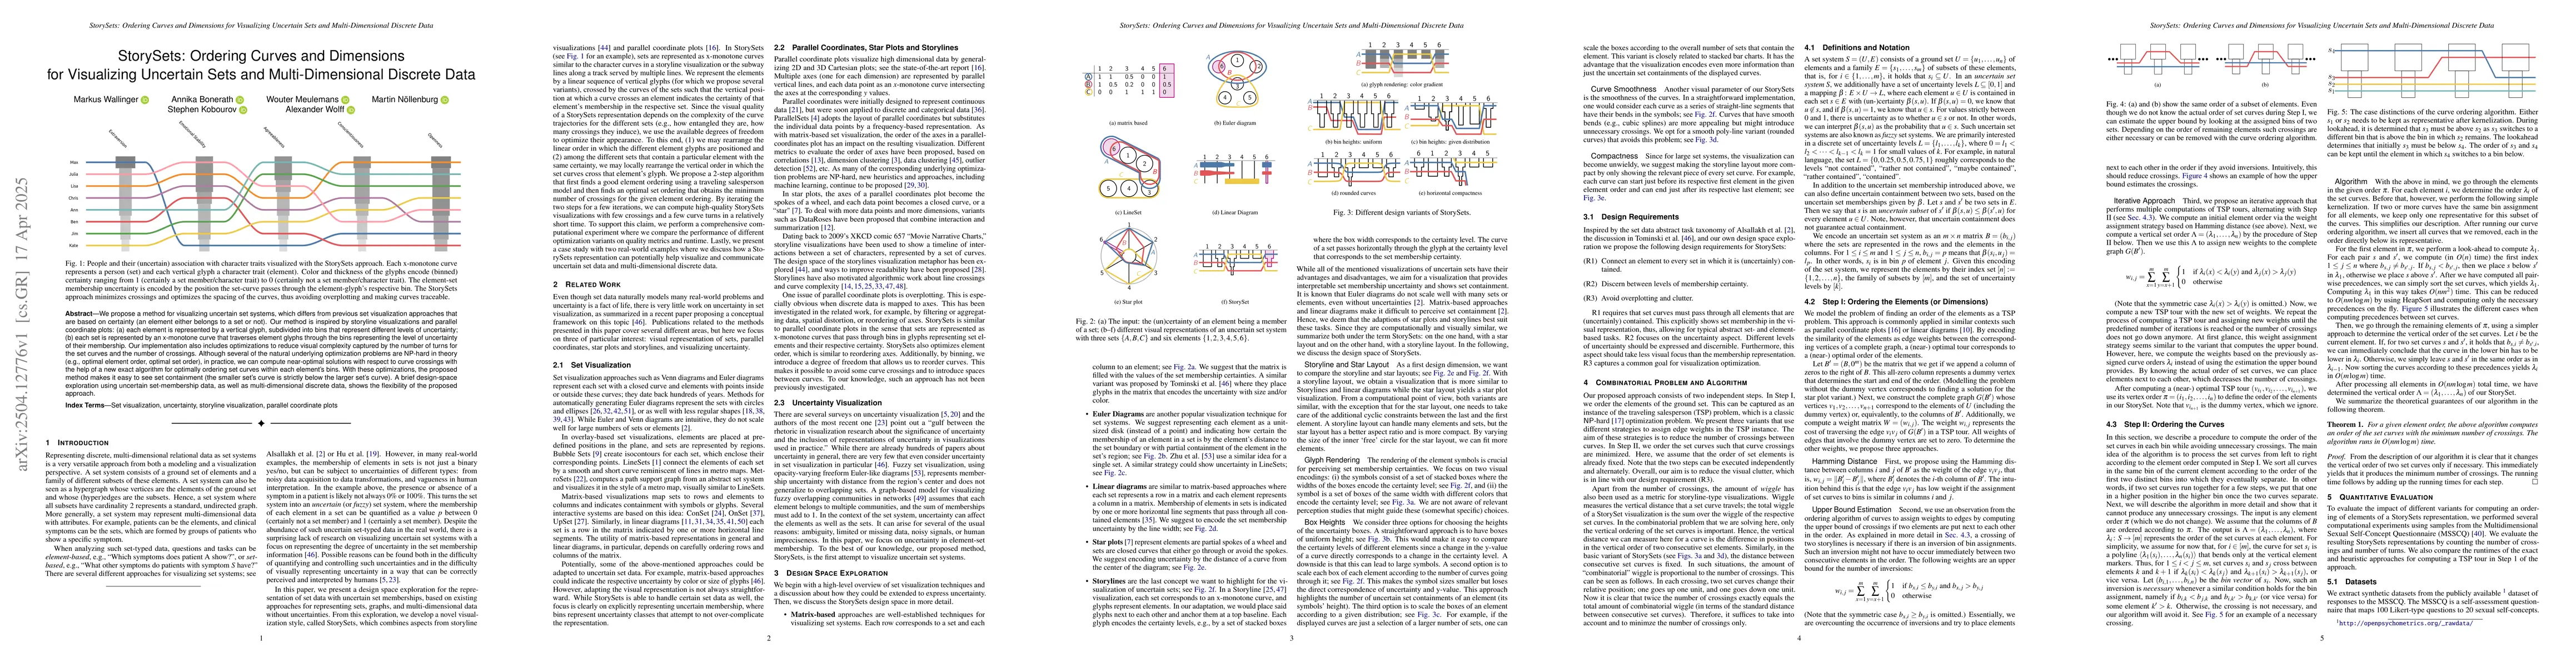
We propose a method for visualizing uncertain set systems, which differs from previous set visualization approaches that are based on certainty (an element either belongs to a set or not). Our method ...
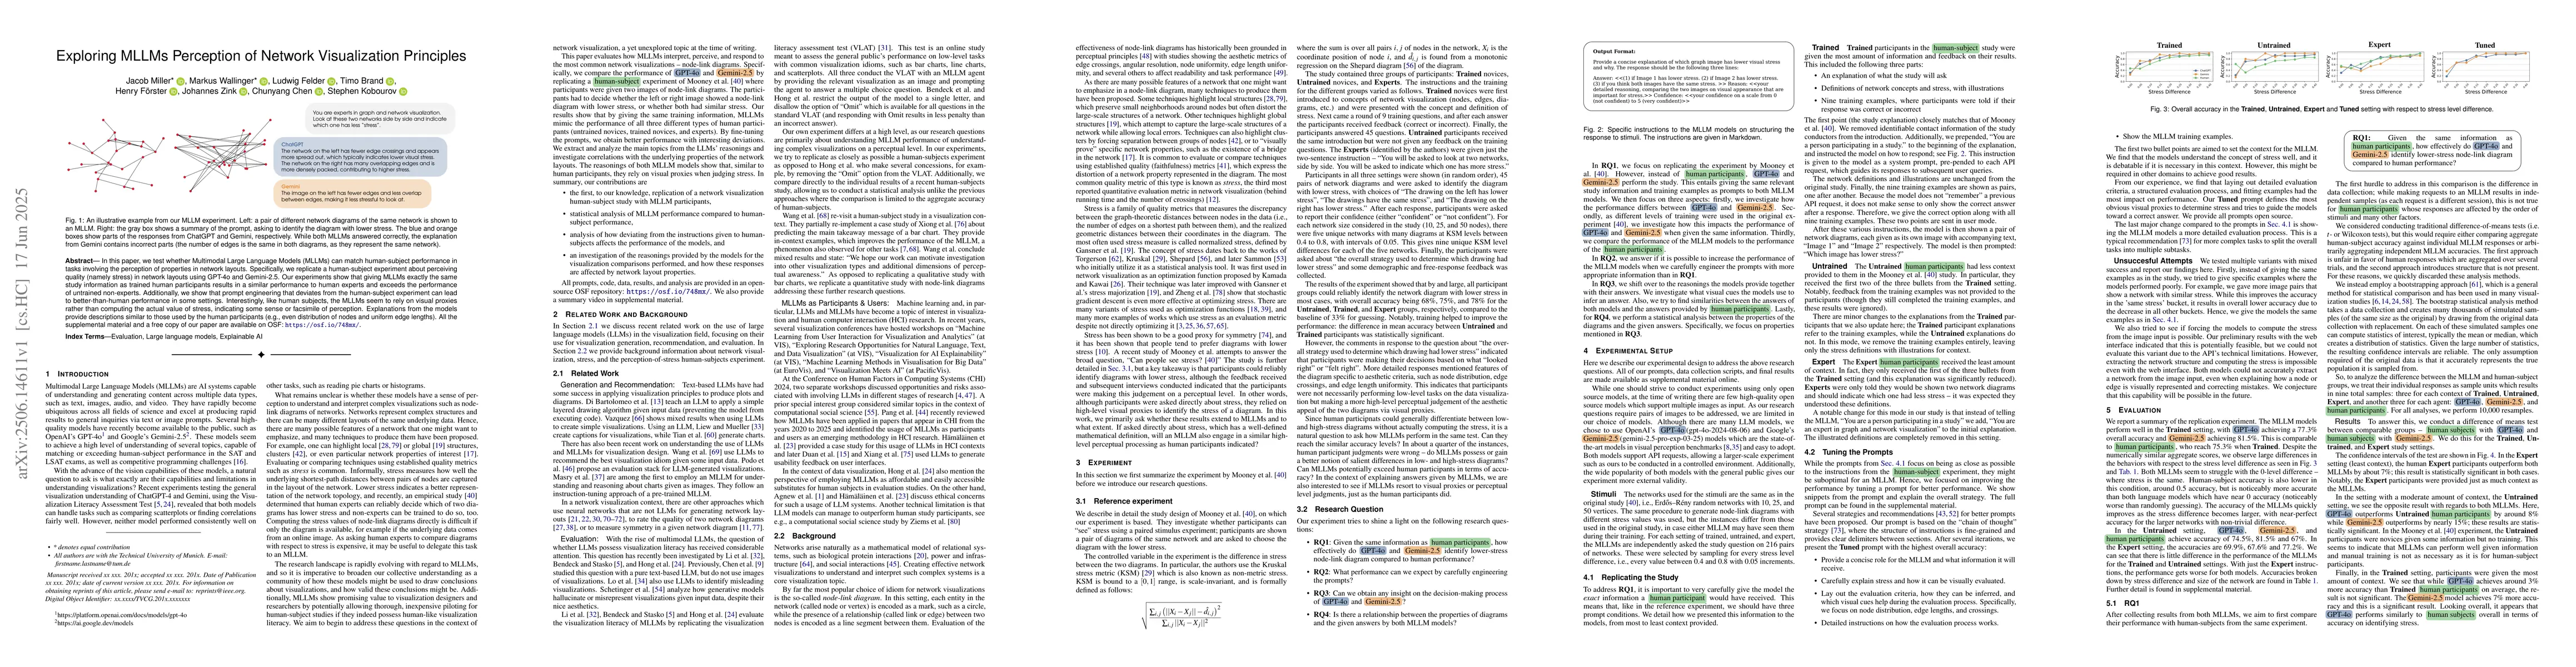
In this paper, we test whether Multimodal Large Language Models (MLLMs) can match human-subject performance in tasks involving the perception of properties in network layouts. Specifically, we replica...
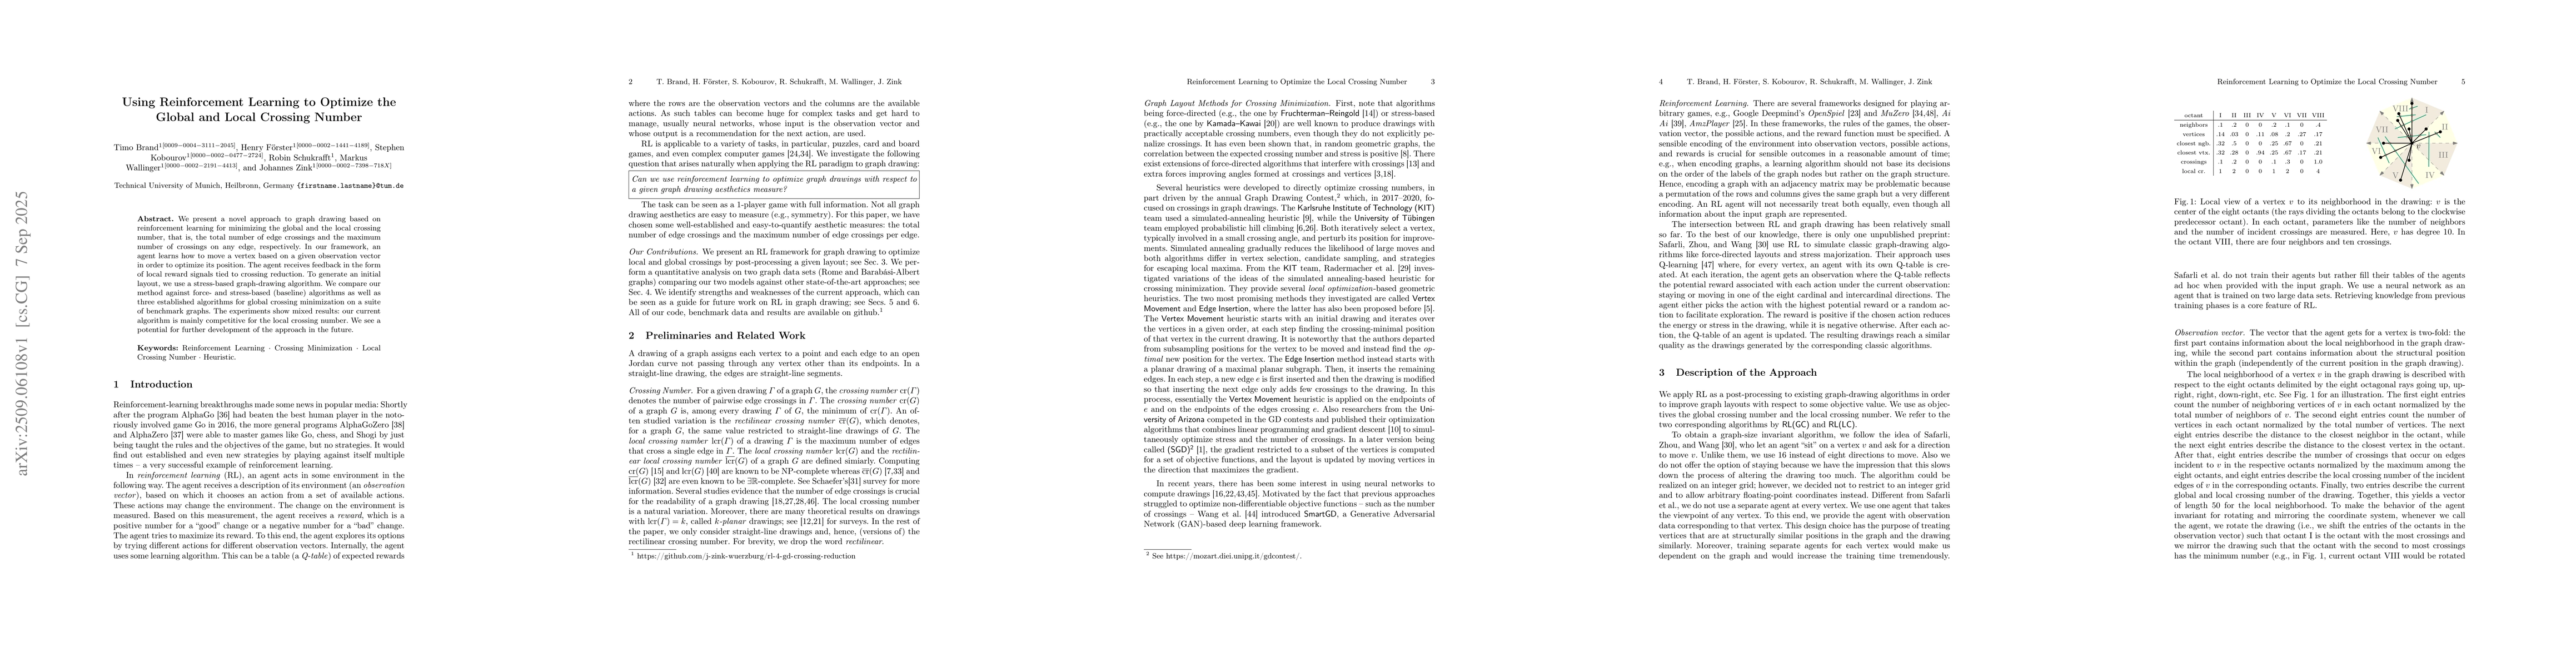
We present a novel approach to graph drawing based on reinforcement learning for minimizing the global and the local crossing number, that is, the total number of edge crossings and the maximum number...
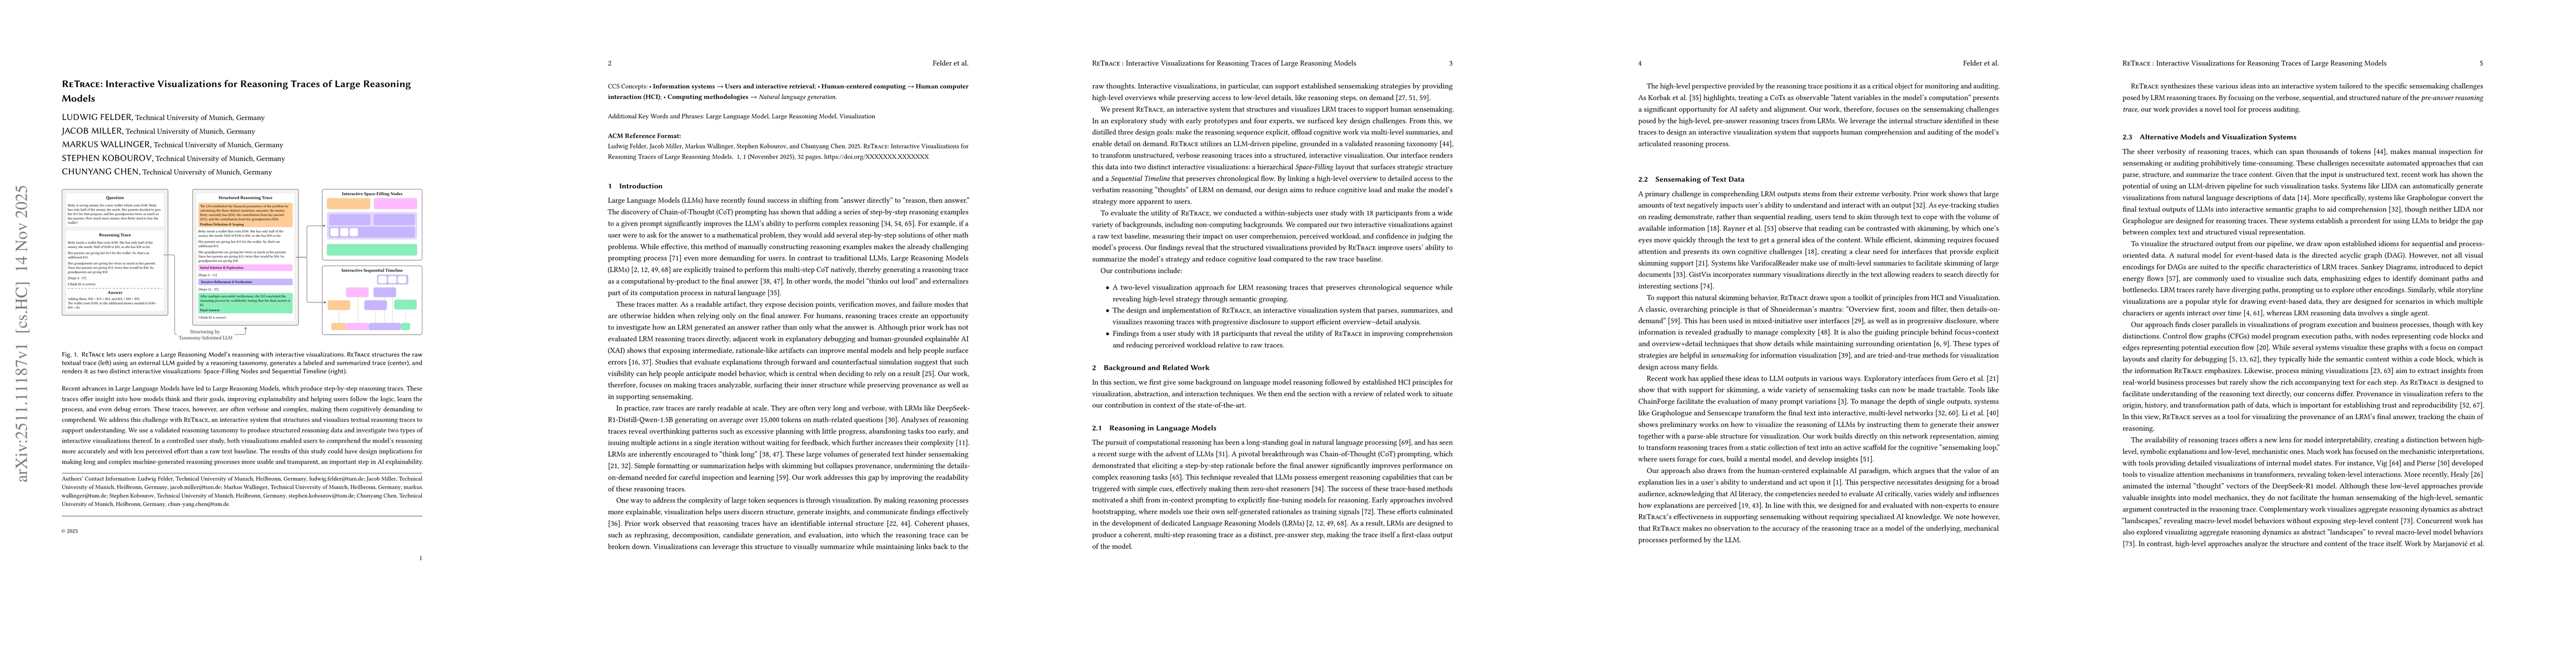
Recent advances in Large Language Models have led to Large Reasoning Models, which produce step-by-step reasoning traces. These traces offer insight into how models think and their goals, improving ex...
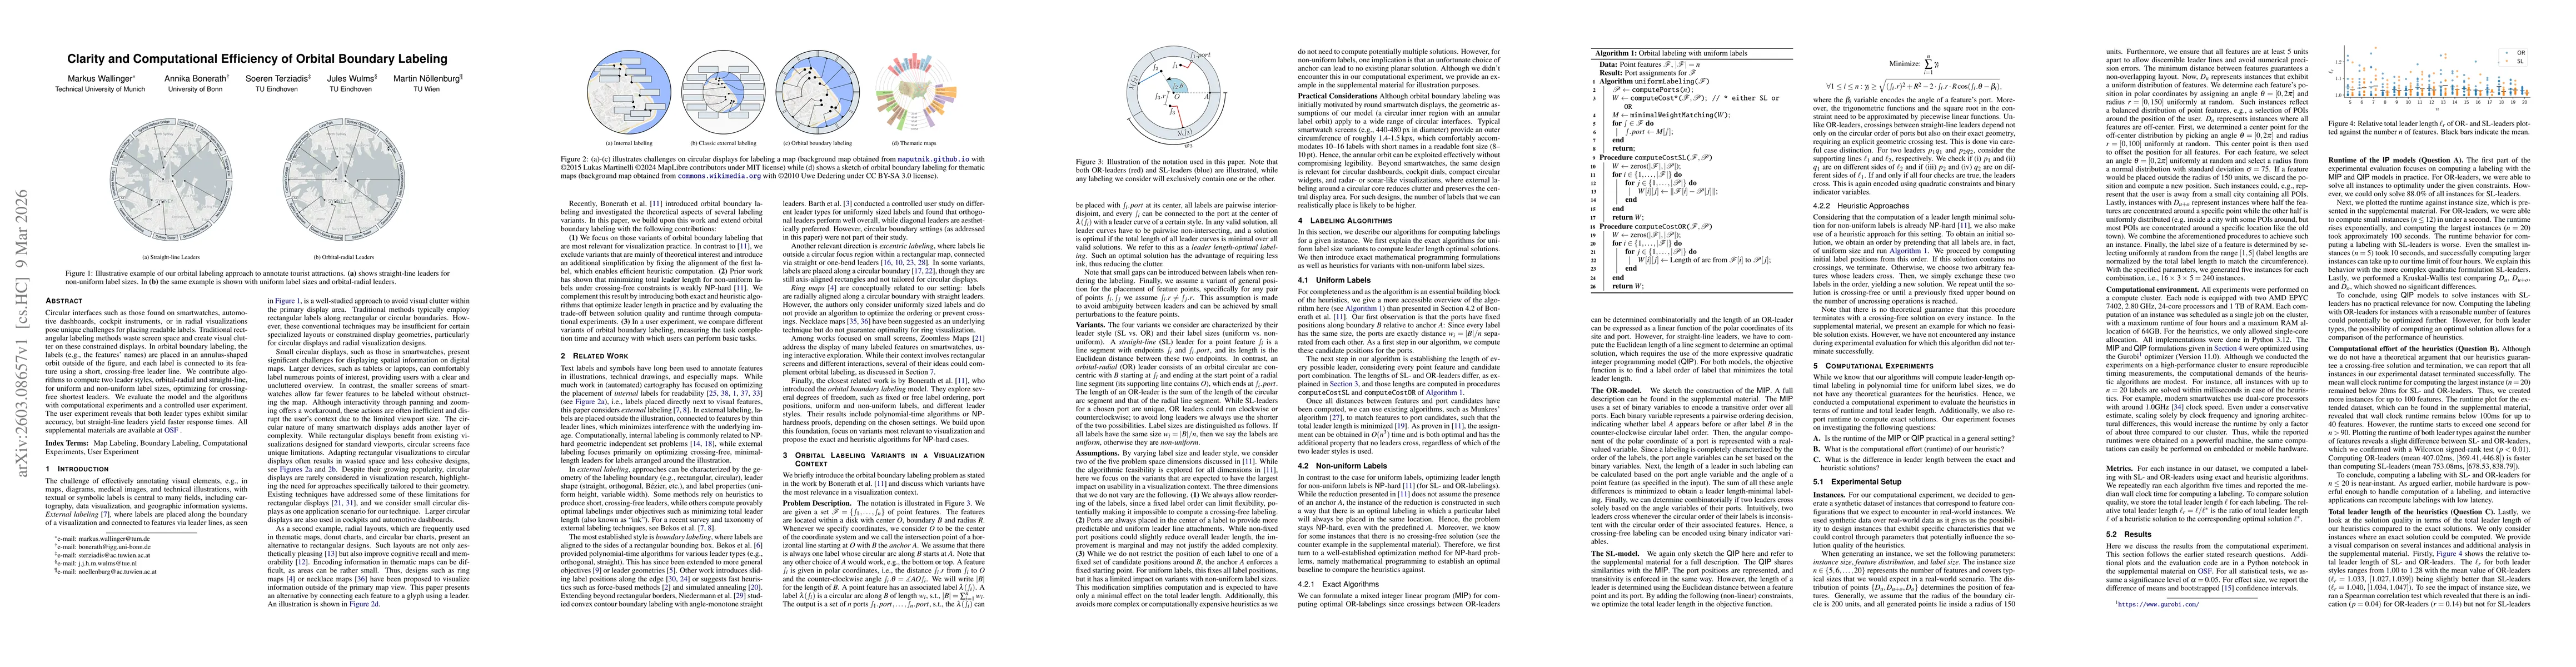
Circular interfaces such as those found on smartwatches, automotive dashboards, cockpit instruments, or in radial visualizations pose unique challenges for placing readable labels. Traditional rectang...