Publication
Metrics
AI Quick Summary
Hoop Diagrams, a circular visualization method for set data, show small usability differences compared to Linear Diagrams. While Linear Diagrams are faster for some questions, Hoop Diagrams offer better accuracy for others, especially with set order and intersection highlighting.
Paper Preview
Abstract
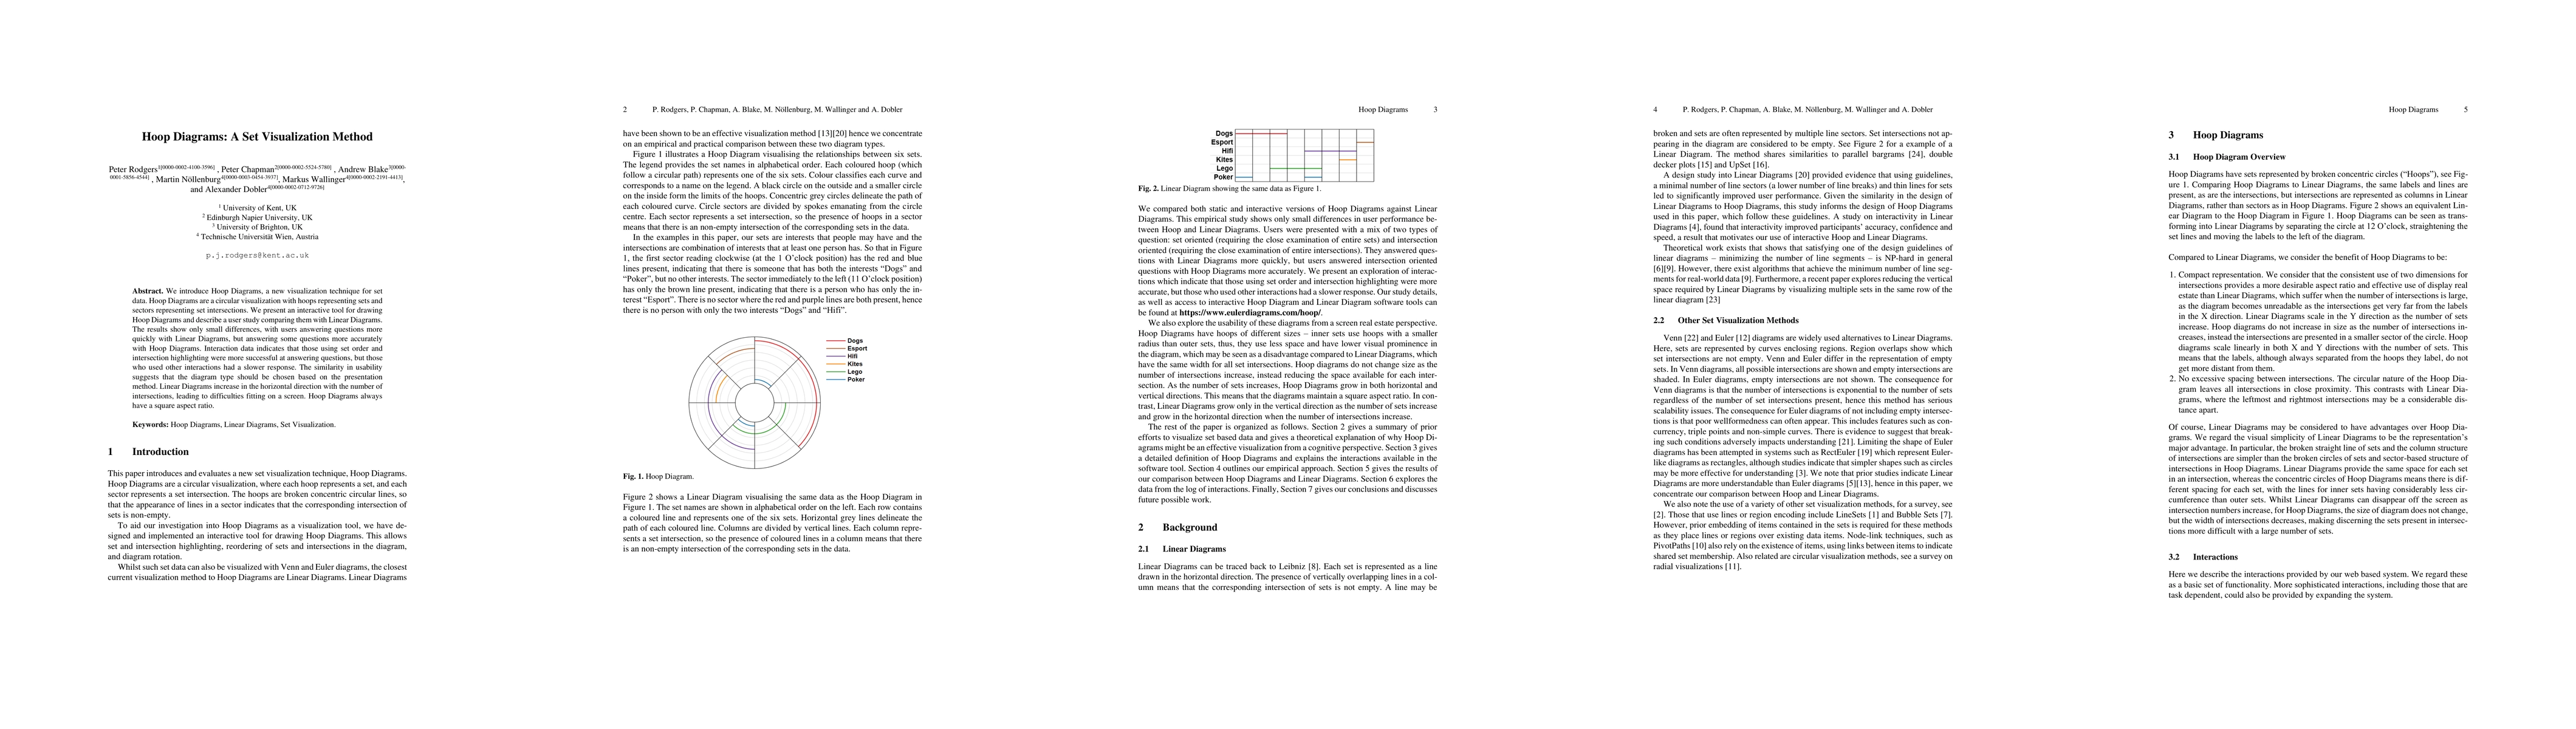
We introduce Hoop Diagrams, a new visualization technique for set data. Hoop Diagrams are a circular visualization with hoops representing sets and sectors representing set intersections. We present an interactive tool for drawing Hoop Diagrams and describe a user study comparing them with Linear Diagrams. The results show only small differences, with users answering questions more quickly with Linear Diagrams, but answering some questions more accurately with Hoop Diagrams. Interaction data indicates that those using set order and intersection highlighting were more successful at answering questions, but those who used other interactions had a slower response. The similarity in usability suggests that the diagram type should be chosen based on the presentation method. Linear Diagrams increase in the horizontal direction with the number of intersections, leading to difficulties fitting on a screen. Hoop Diagrams al-ways have a square aspect ratio.
AI Key Findings
Get AI-generated insights about this paper's methodology, results, significance, and more — seven facets brought into focus.
Impact
Paper Details
Authors
PDF Preview
Key Terms
Citation Network
Current paper (gray), citations (green), references (blue)
Display is limited for performance on very large graphs.
Discussion 0