2
arXiv Papers
68
Total Publications
Profile
Academic Profile
Metrics
Statistics
2
arXiv Papers
68
Total Publications
Network
Similar Authors
Publications
Papers on arXiv
arXiv
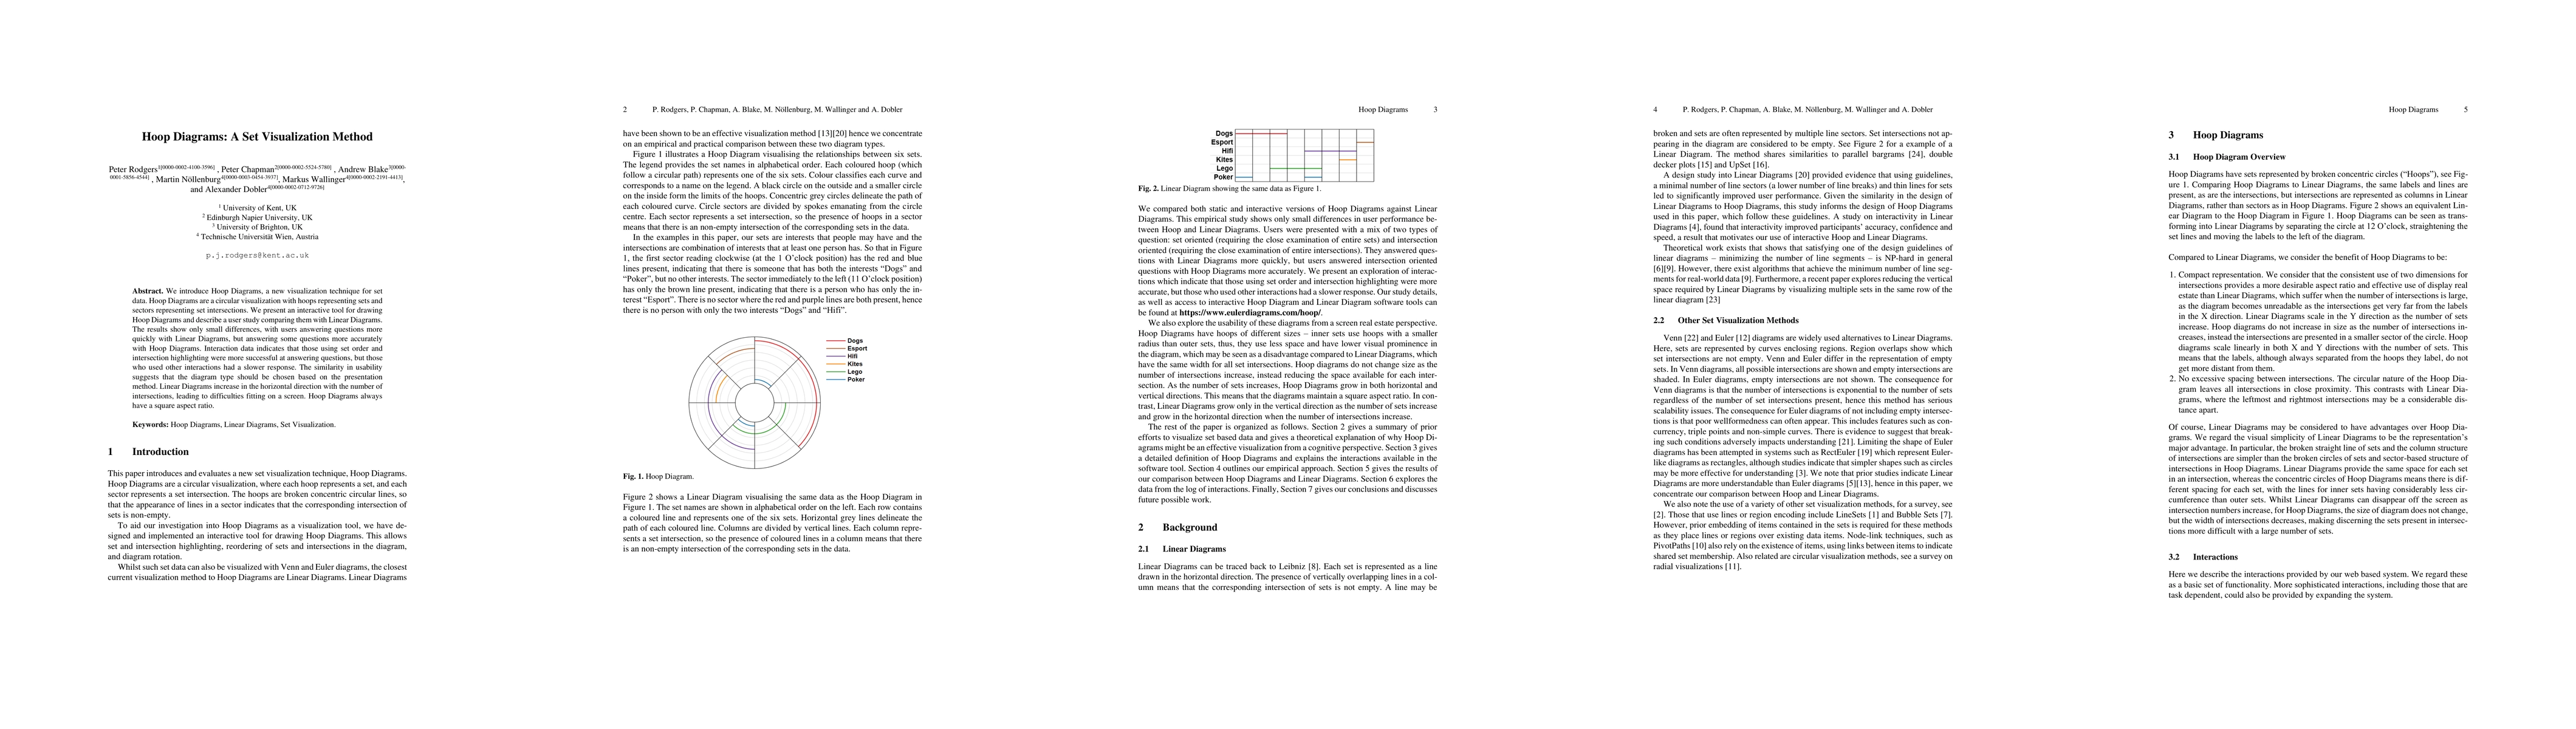
Hoop Diagrams: A Set Visualization Method
We introduce Hoop Diagrams, a new visualization technique for set data. Hoop Diagrams are a circular visualization with hoops representing sets and sectors representing set intersections. We present...
arXiv
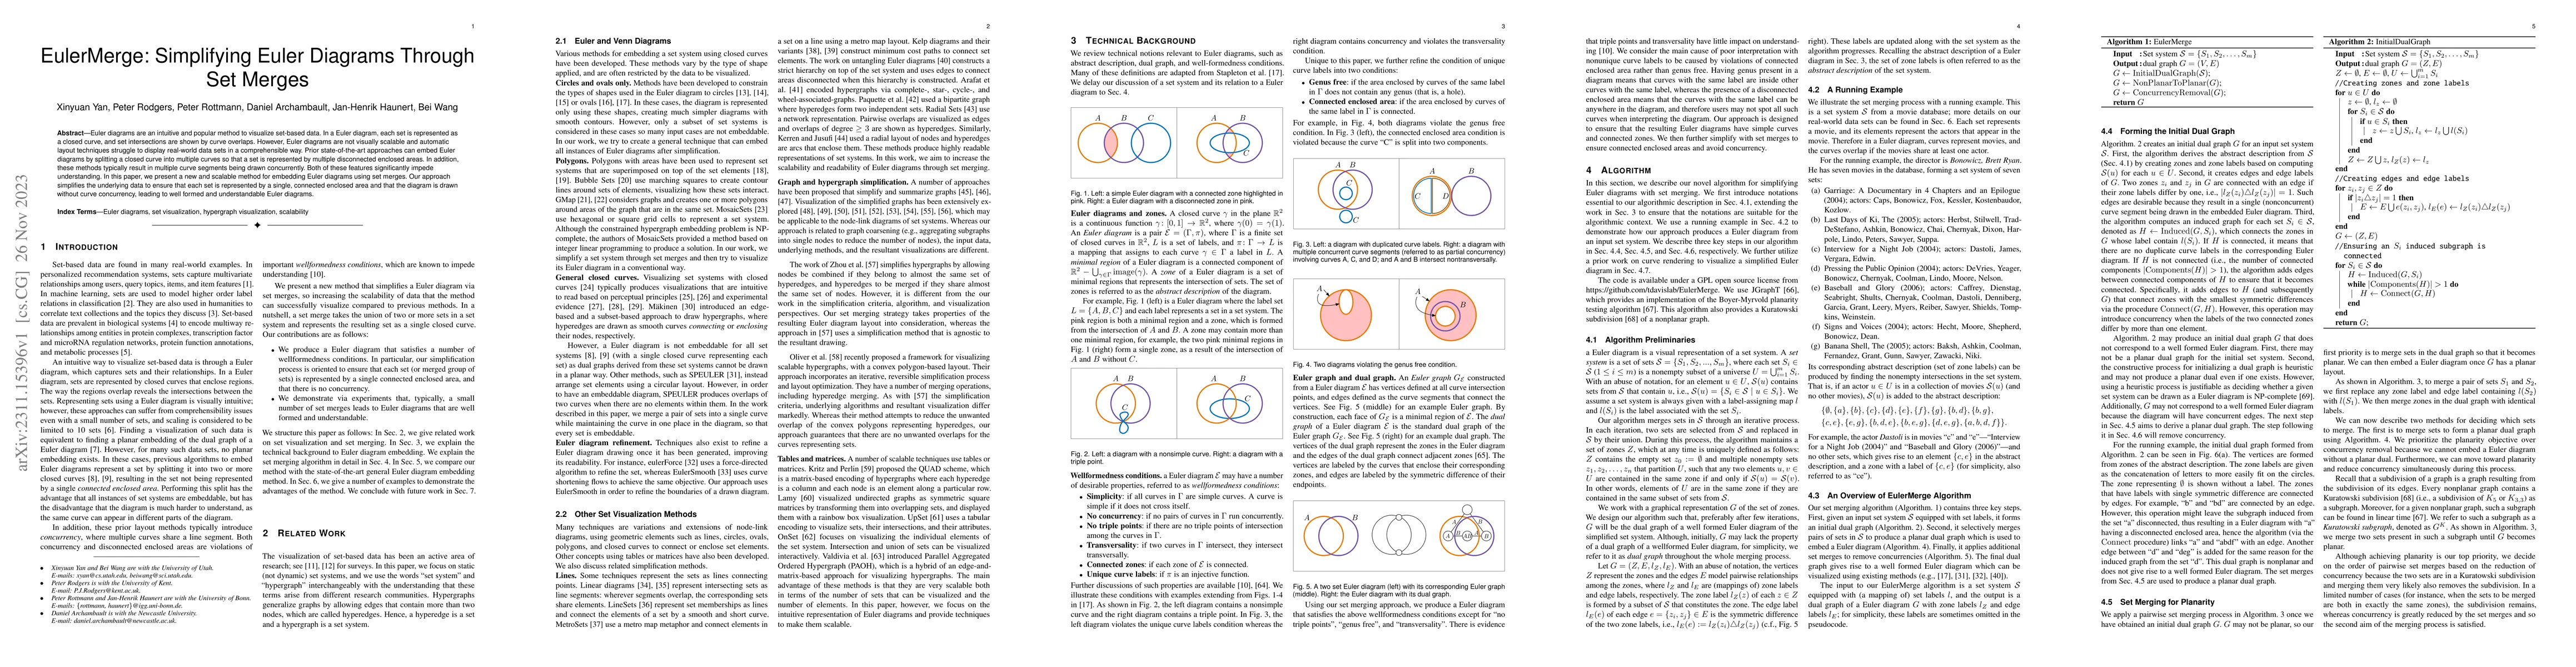
EulerMerge: Simplifying Euler Diagrams Through Set Merges
Euler diagrams are an intuitive and popular method to visualize set-based data. In a Euler diagram, each set is represented as a closed curve, and set intersections are shown by curve overlaps. Howe...