Academic Profile
Statistics
Similar Authors
Papers on arXiv
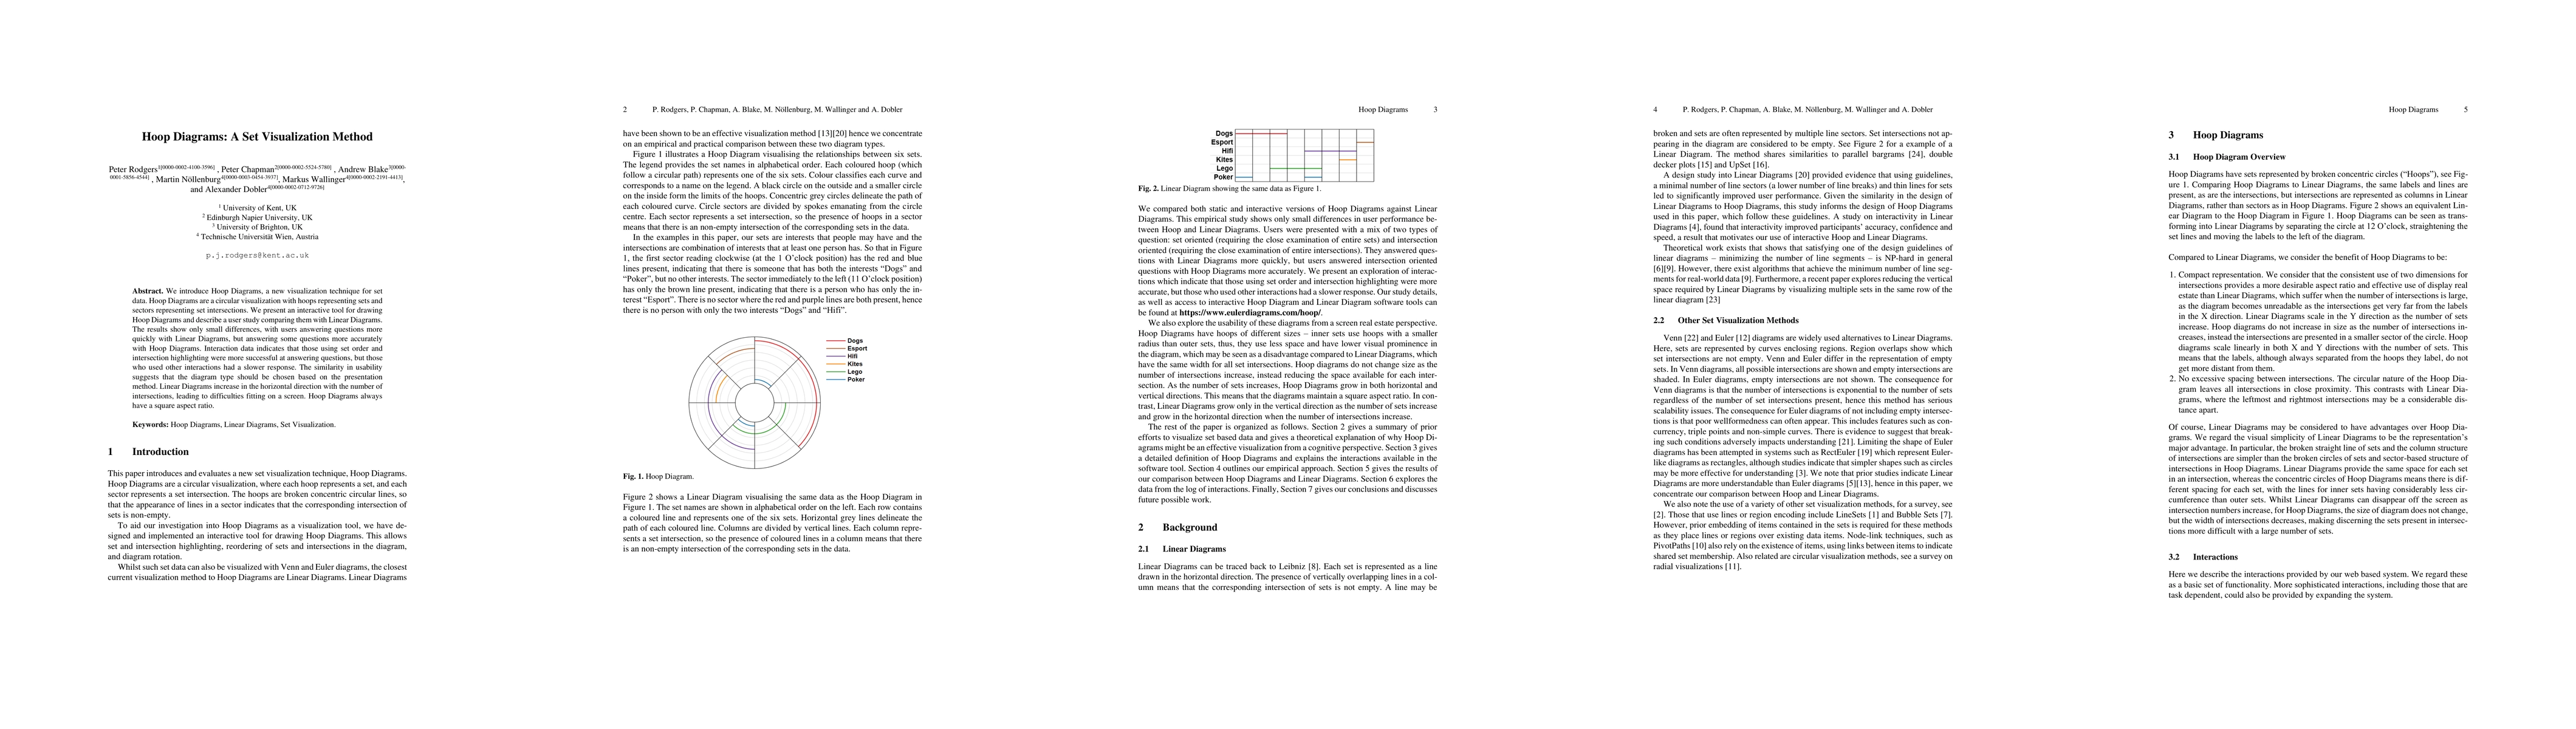
We introduce Hoop Diagrams, a new visualization technique for set data. Hoop Diagrams are a circular visualization with hoops representing sets and sectors representing set intersections. We present...
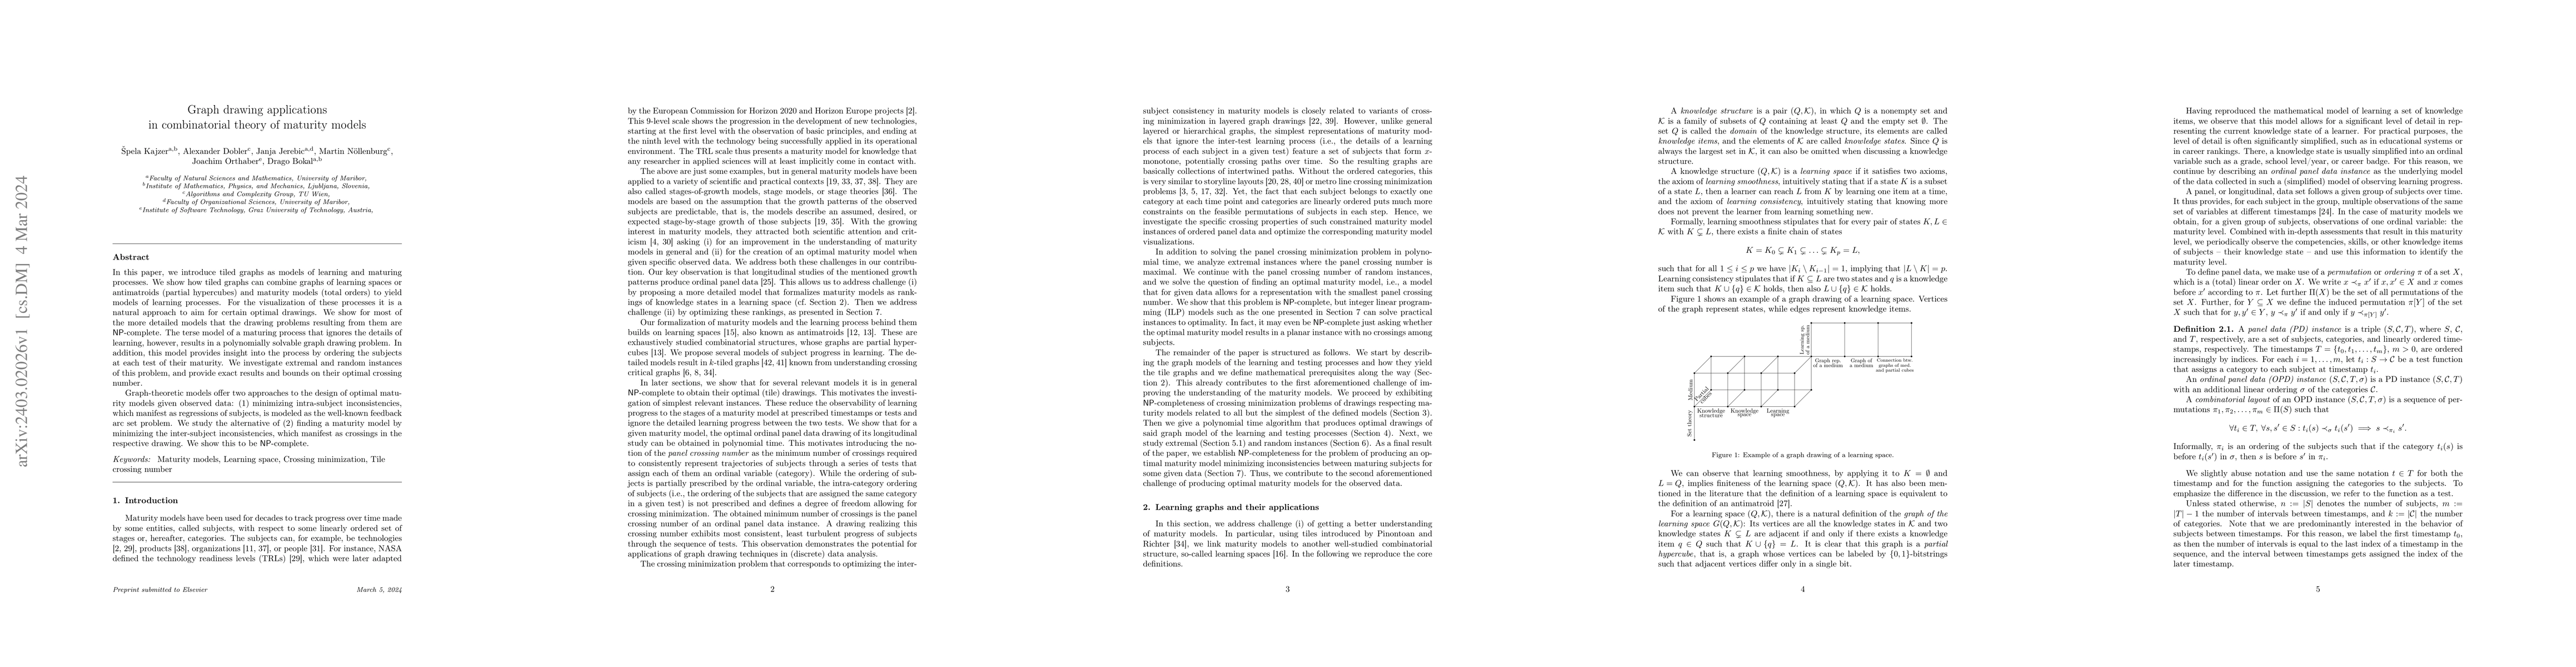
In this paper, we introduce tiled graphs as models of learning and maturing processes. We show how tiled graphs can combine graphs of learning spaces or antimatroids (partial hypercubes) and maturit...
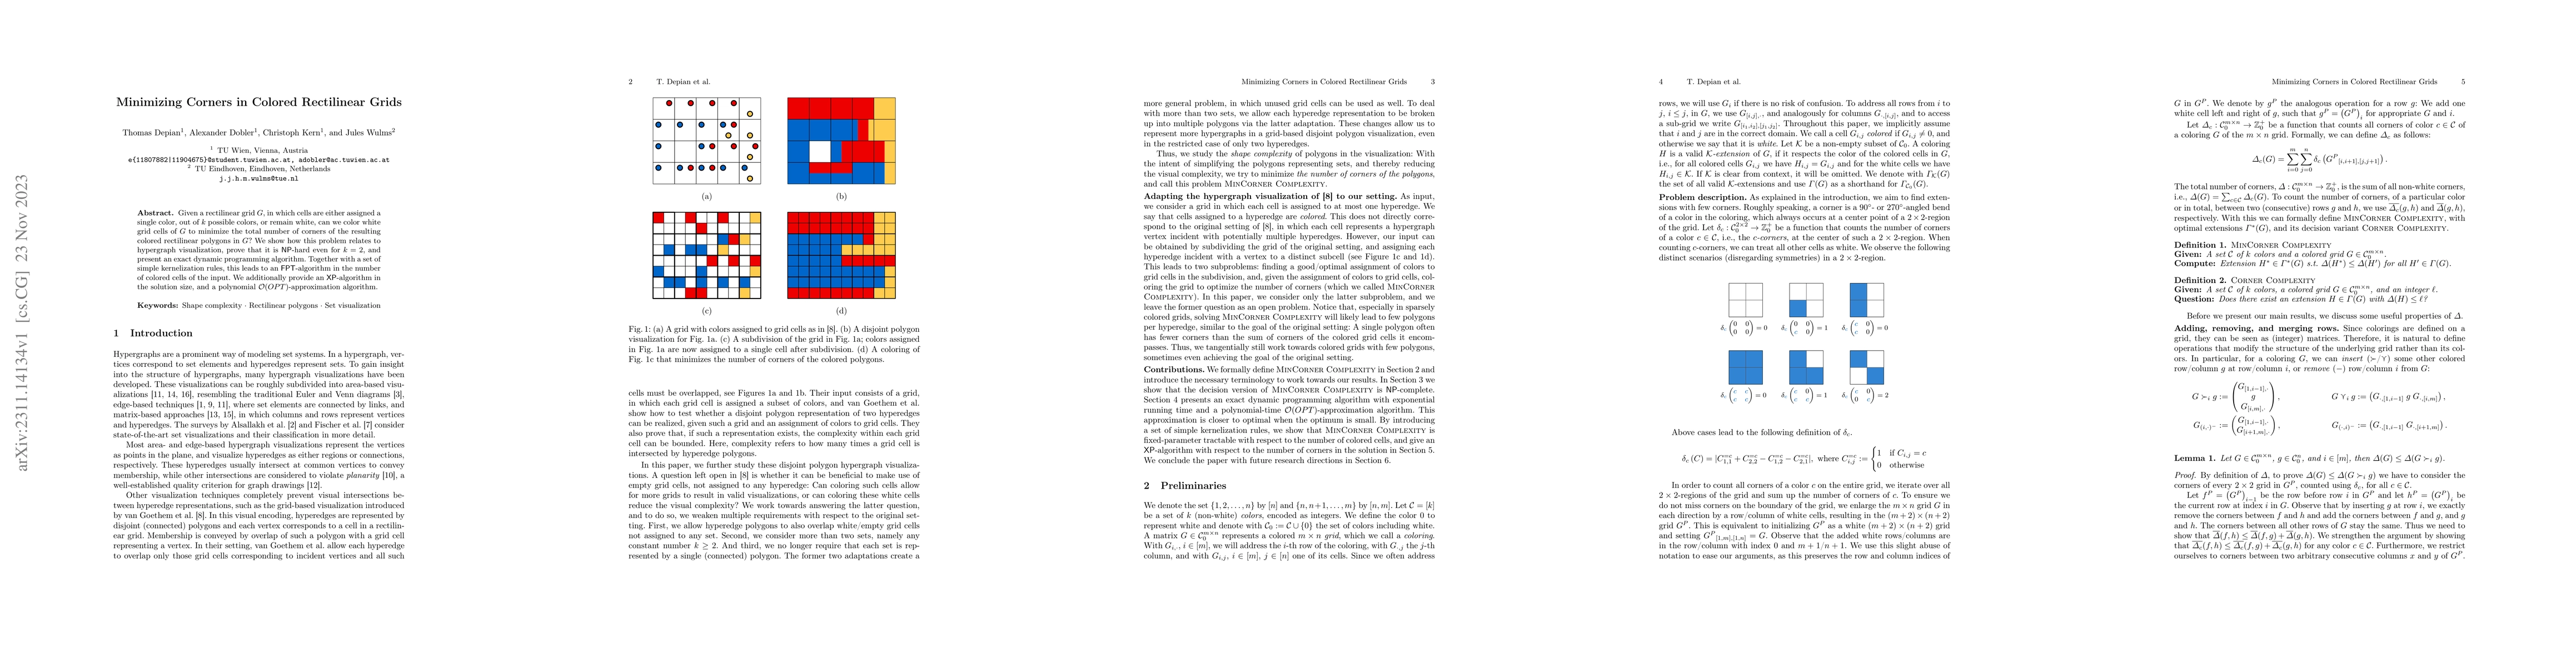
Given a rectilinear grid $G$, in which cells are either assigned a single color, out of $k$ possible colors, or remain white, can we color white grid cells of $G$ to minimize the total number of cor...
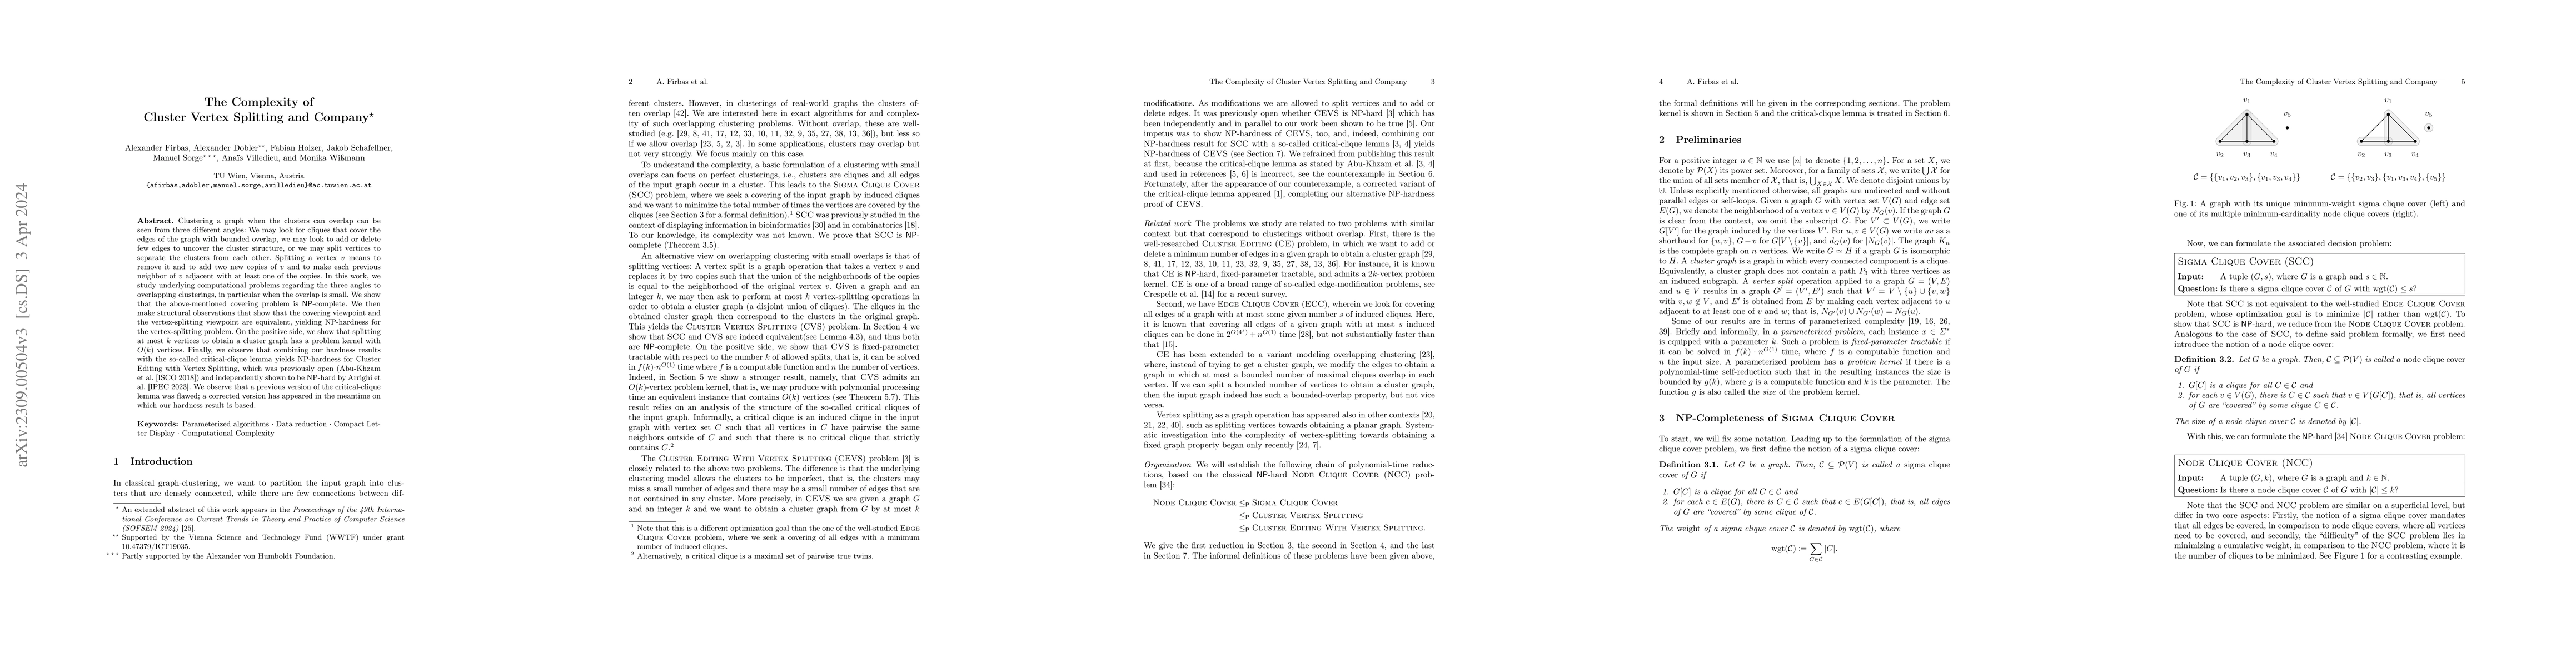
Clustering a graph when the clusters can overlap can be seen from three different angles: We may look for cliques that cover the edges of the graph with bounded overlap, we may look to add or delete...
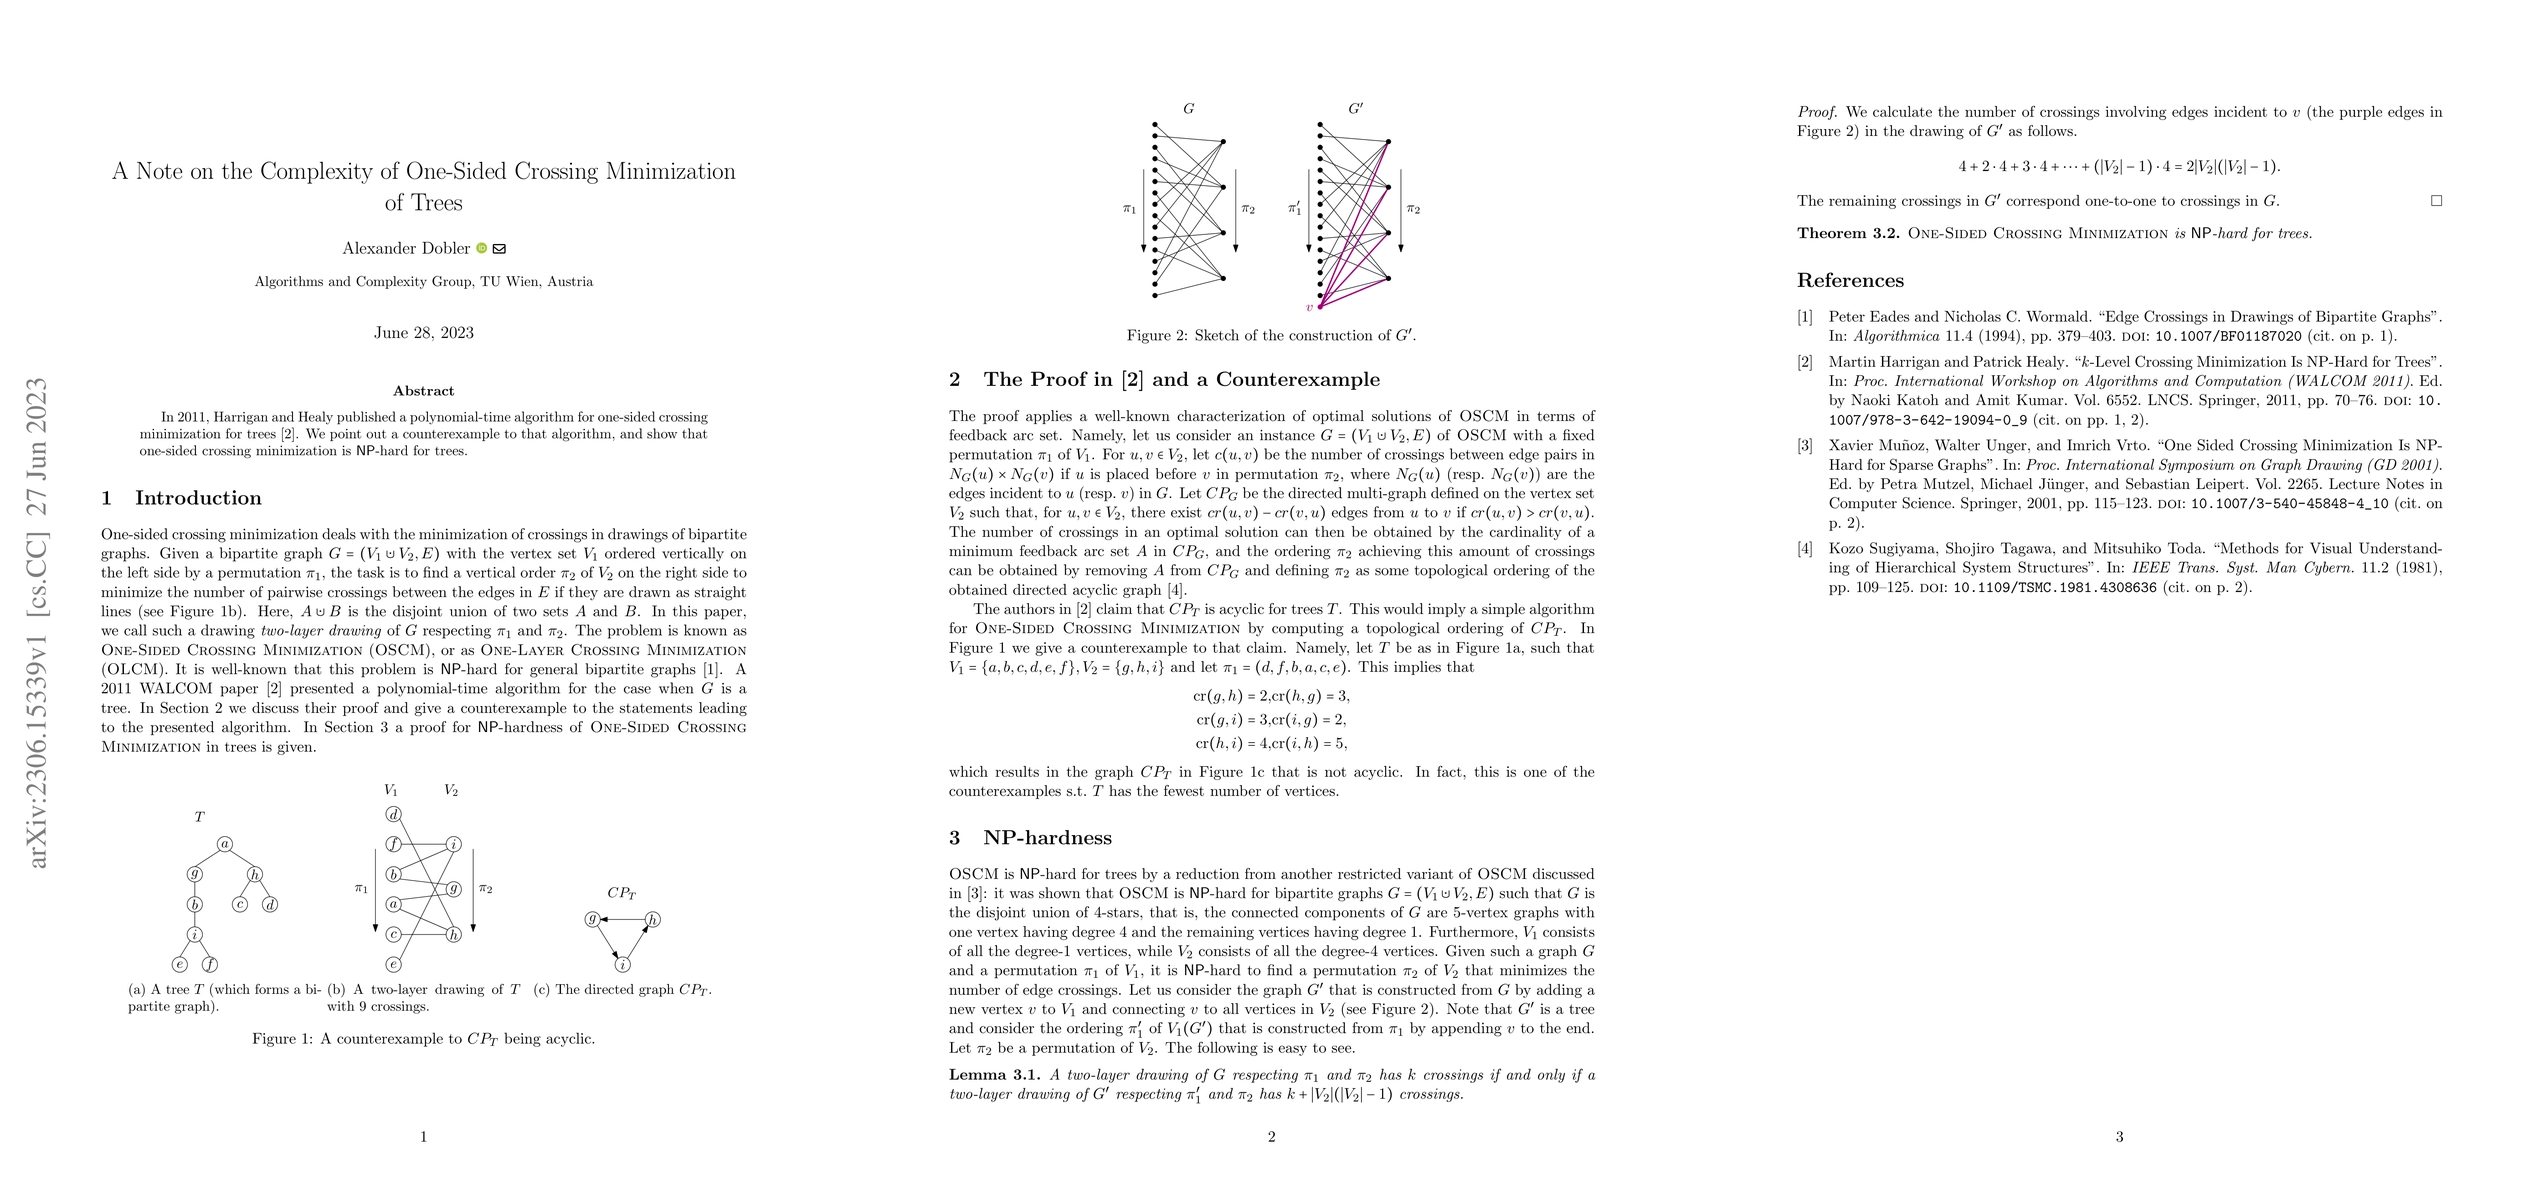
In 2011, Harrigan and Healy published a polynomial-time algorithm for one-sided crossing minimization for trees. We point out a counterexample to that algorithm, and show that one-sided crossing min...
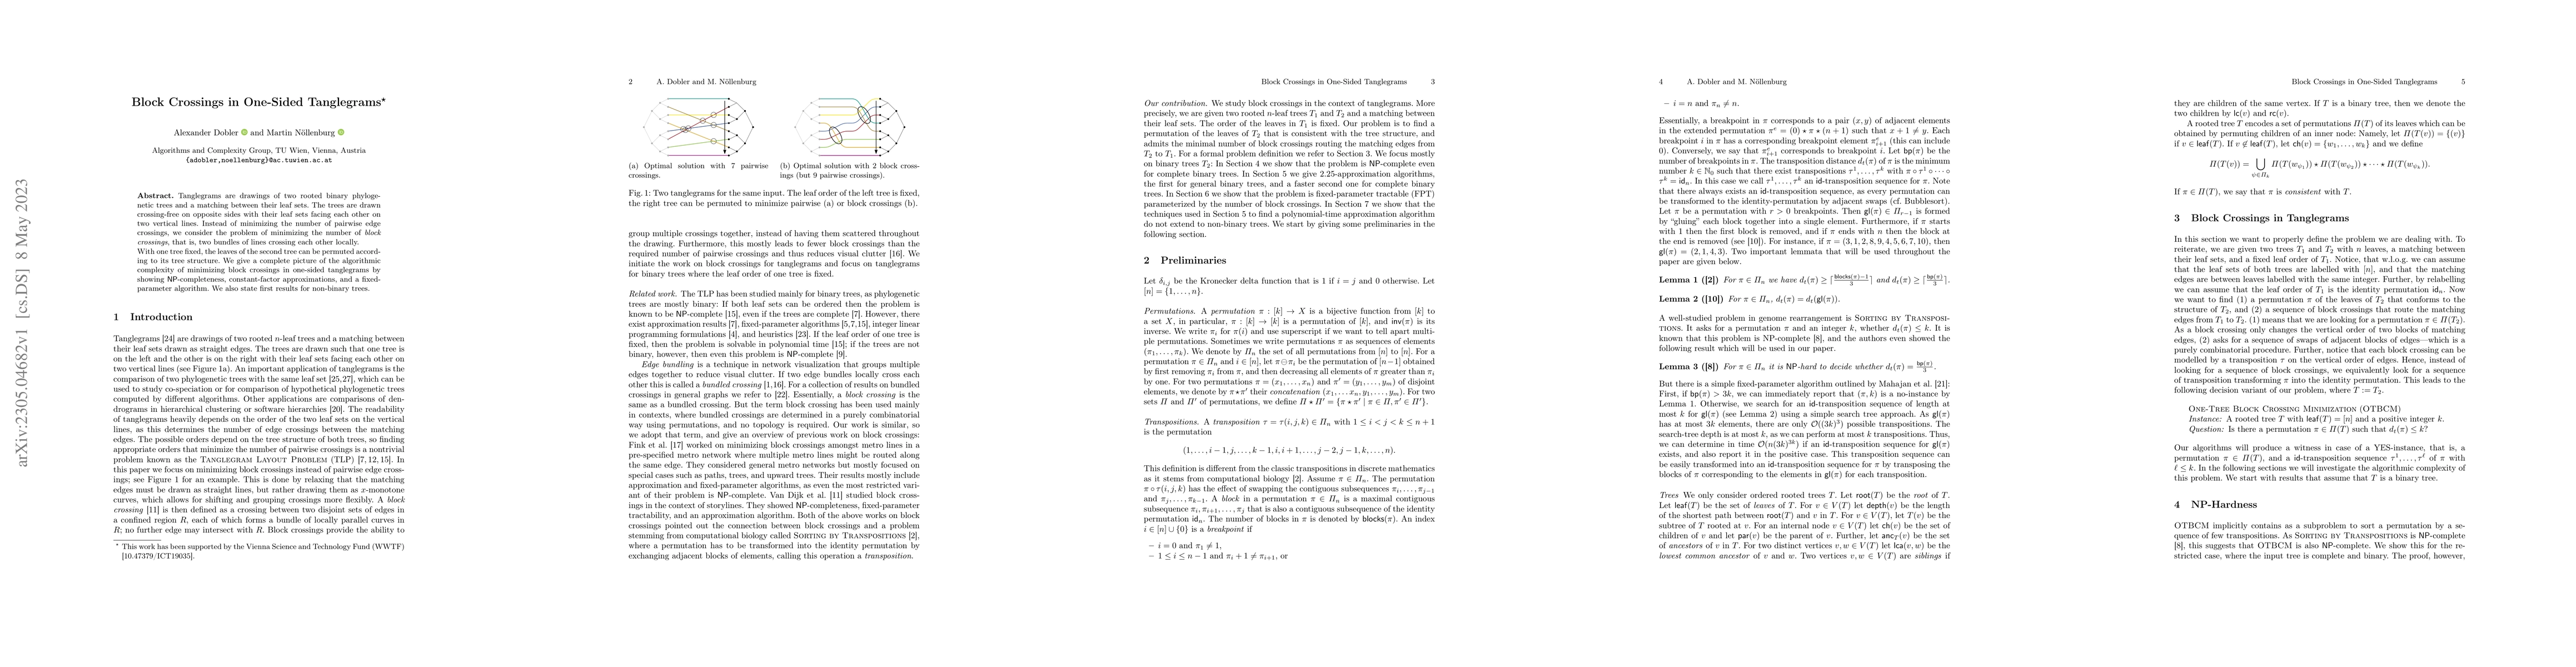
Tanglegrams are drawings of two rooted binary phylogenetic trees and a matching between their leaf sets. The trees are drawn crossing-free on opposite sides with their leaf sets facing each other on...
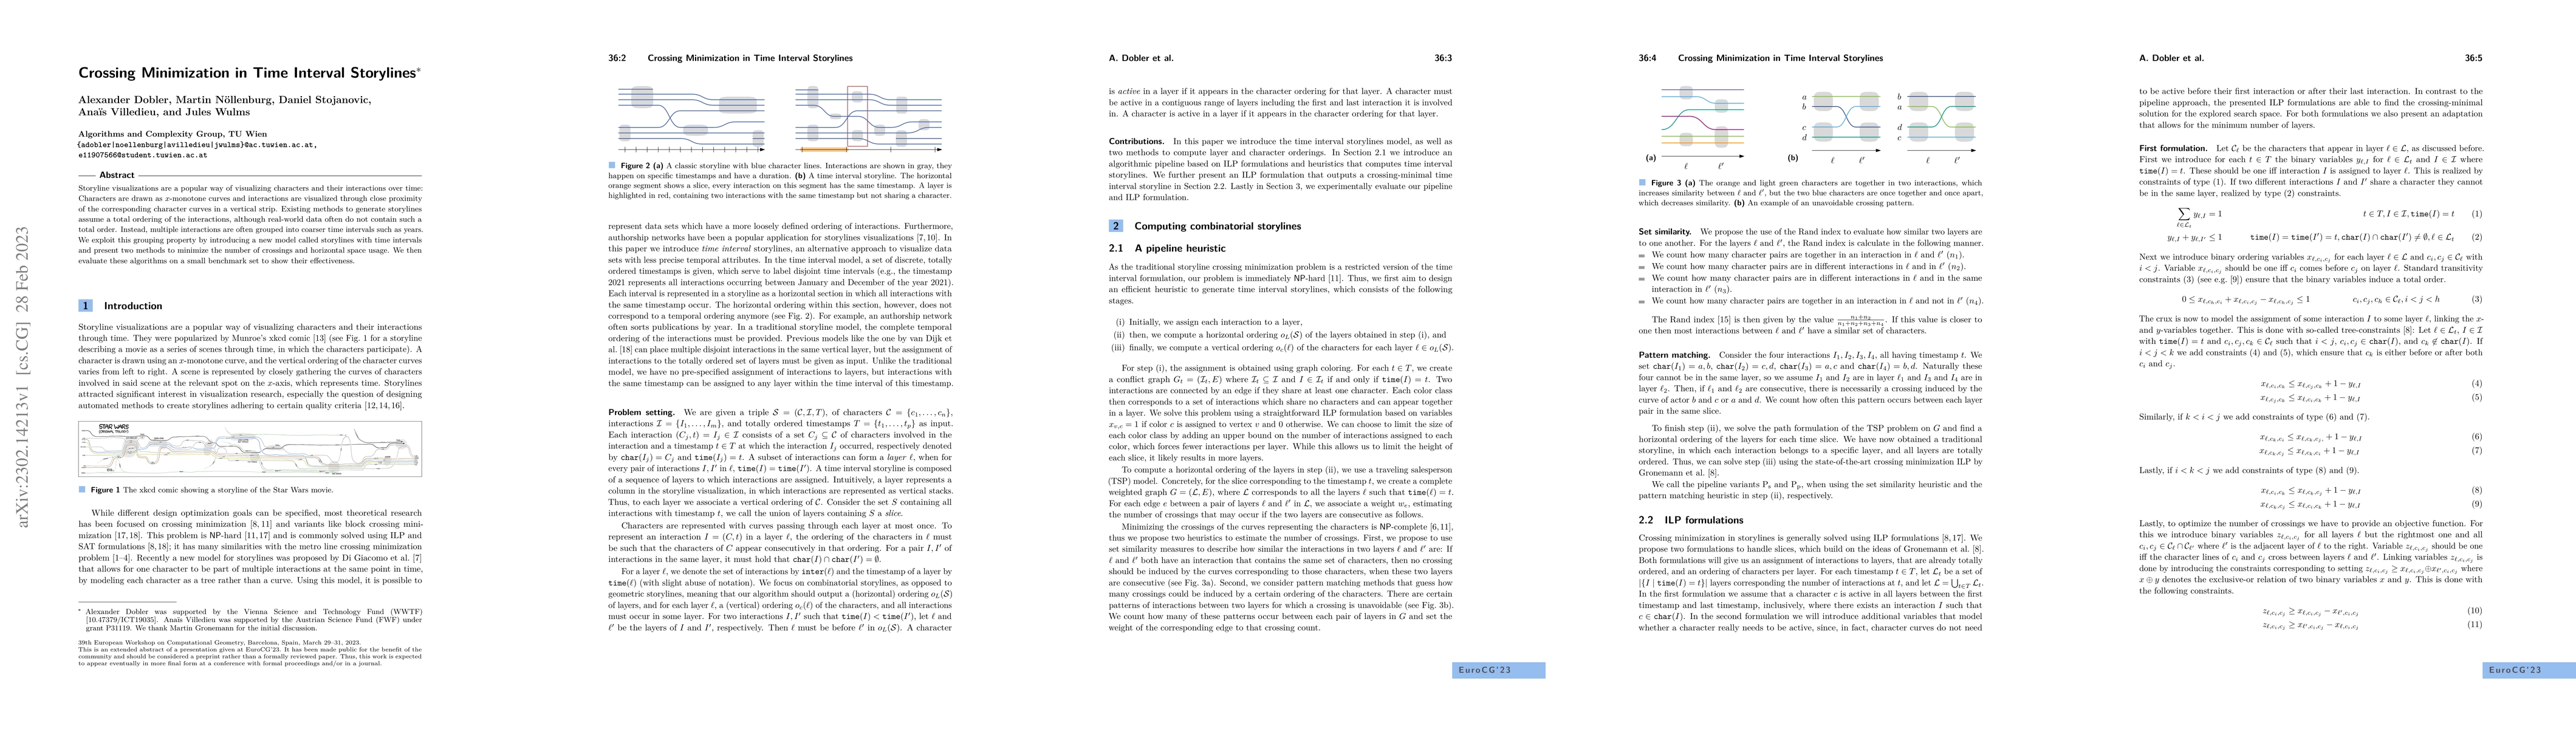
Storyline visualizations are a popular way of visualizing characters and their interactions over time: Characters are drawn as x-monotone curves and interactions are visualized through close proximi...
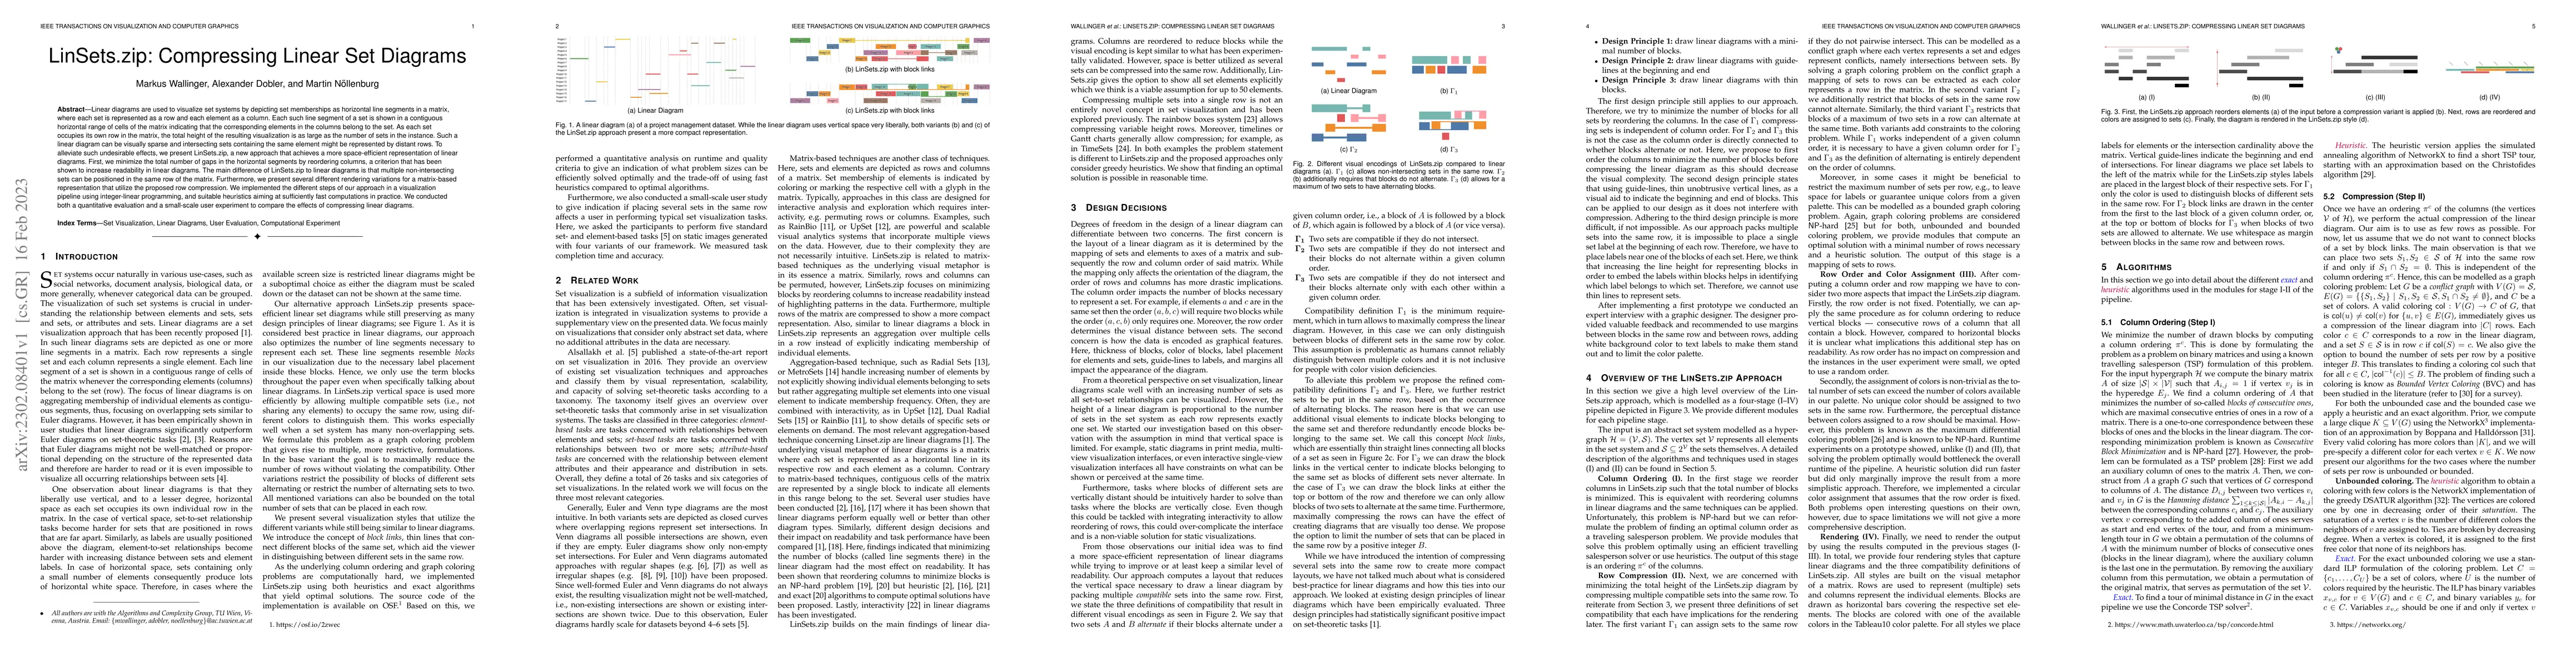
Linear diagrams are used to visualize set systems by depicting set memberships as horizontal line segments in a matrix, where each set is represented as a row and each element as a column. Each such...
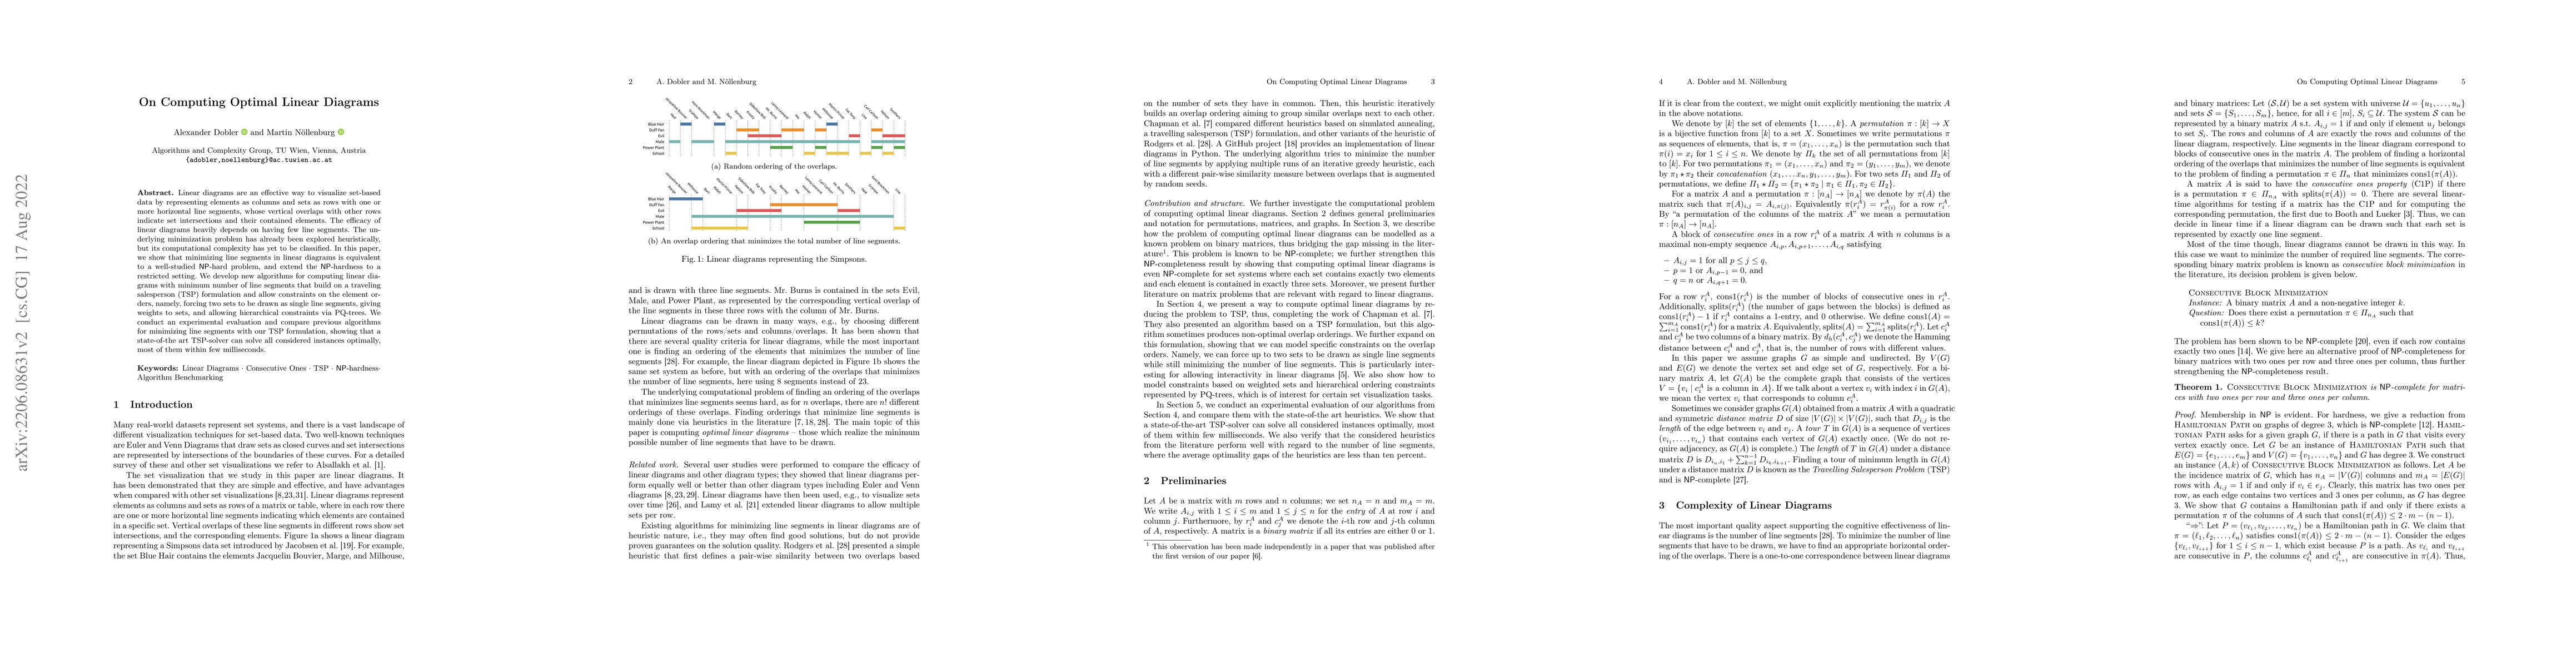
Linear diagrams are an effective way to visualize set-based data by representing elements as columns and sets as rows with one or more horizontal line segments, whose vertical overlaps with other ro...
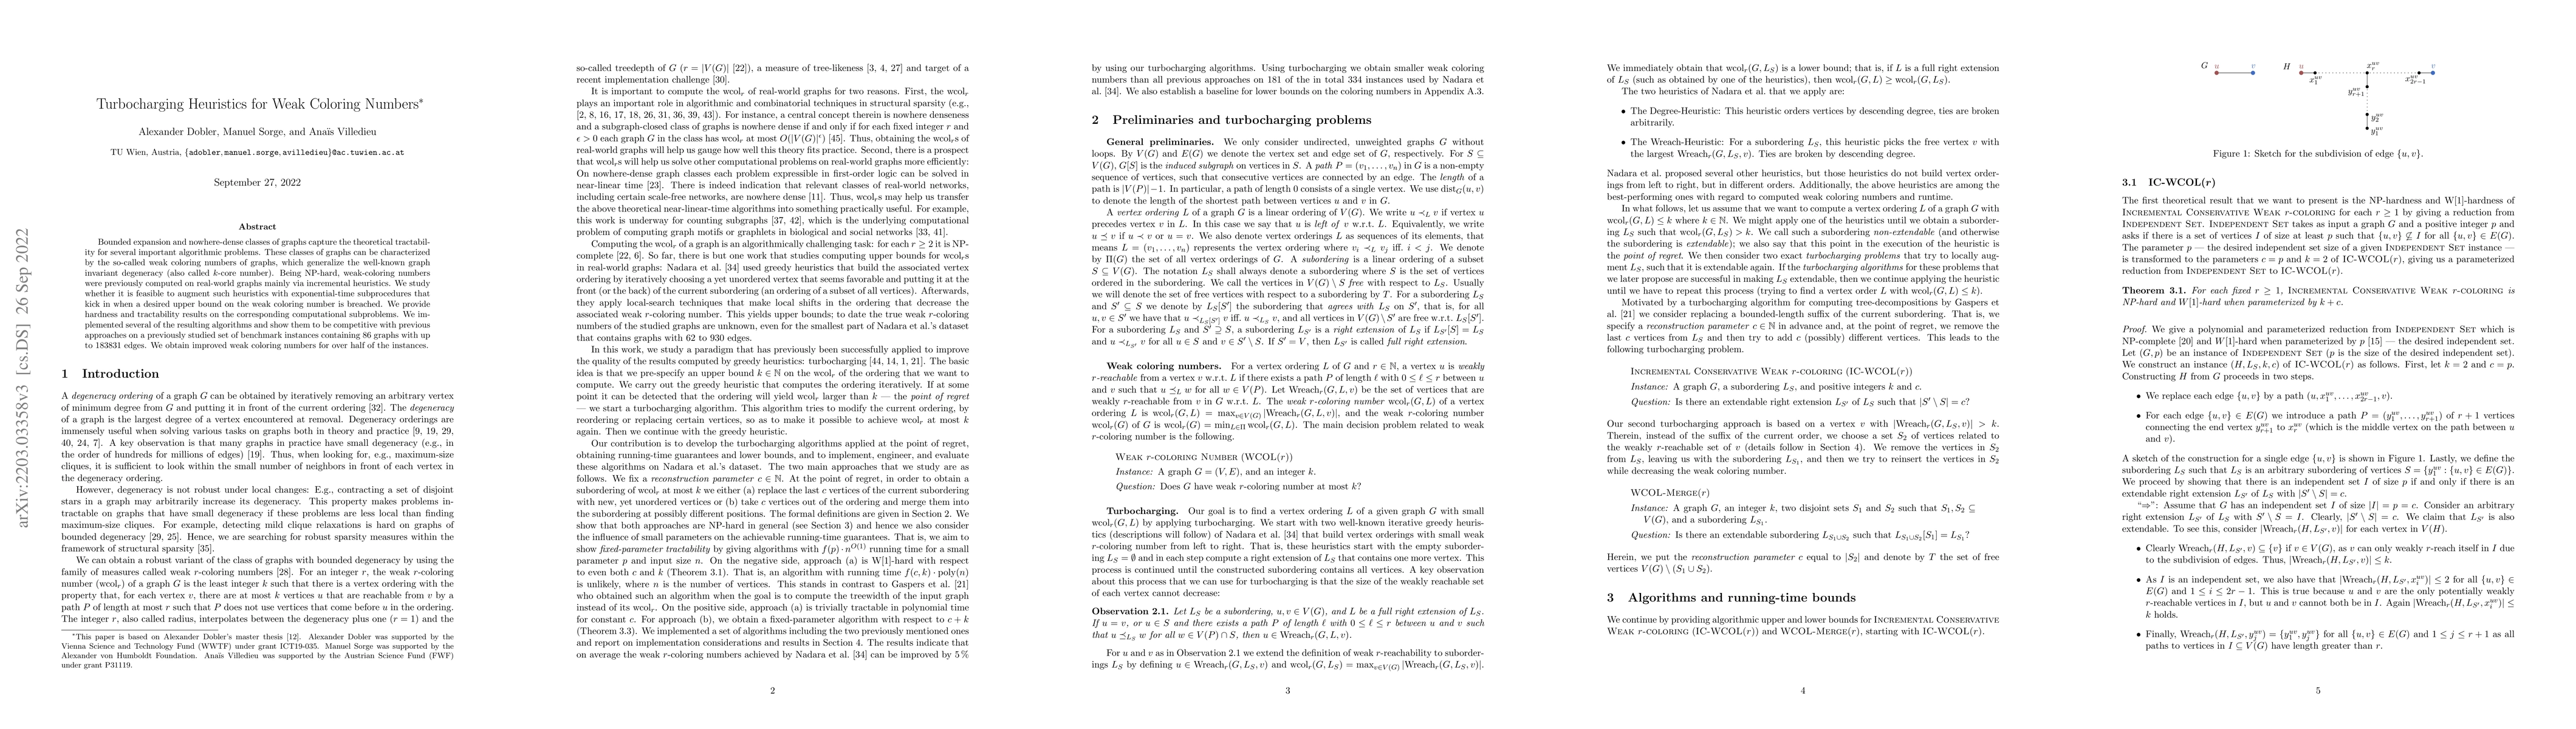
Bounded expansion and nowhere-dense classes of graphs capture the theoretical tractability for several important algorithmic problems. These classes of graphs can be characterized by the so-called w...
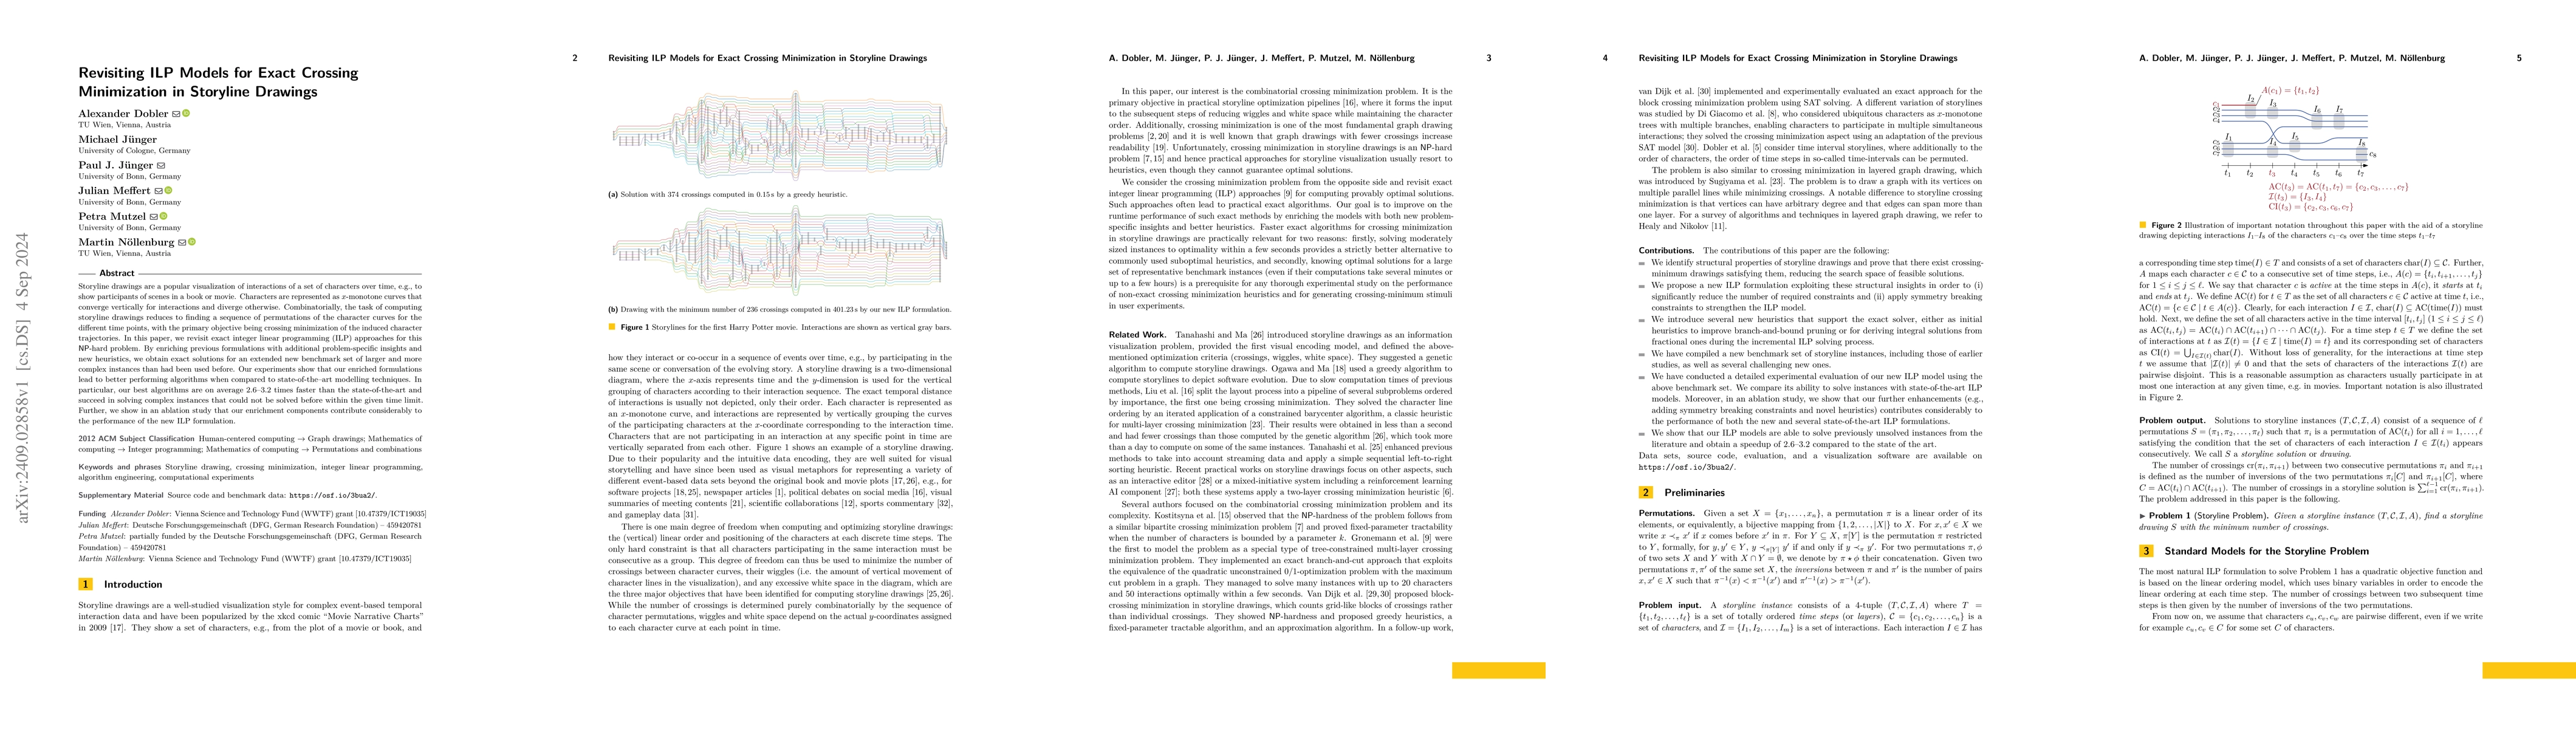
Storyline drawings are a popular visualization of interactions of a set of characters over time, e.g., to show participants of scenes in a book or movie. Characters are represented as $x$-monotone cur...
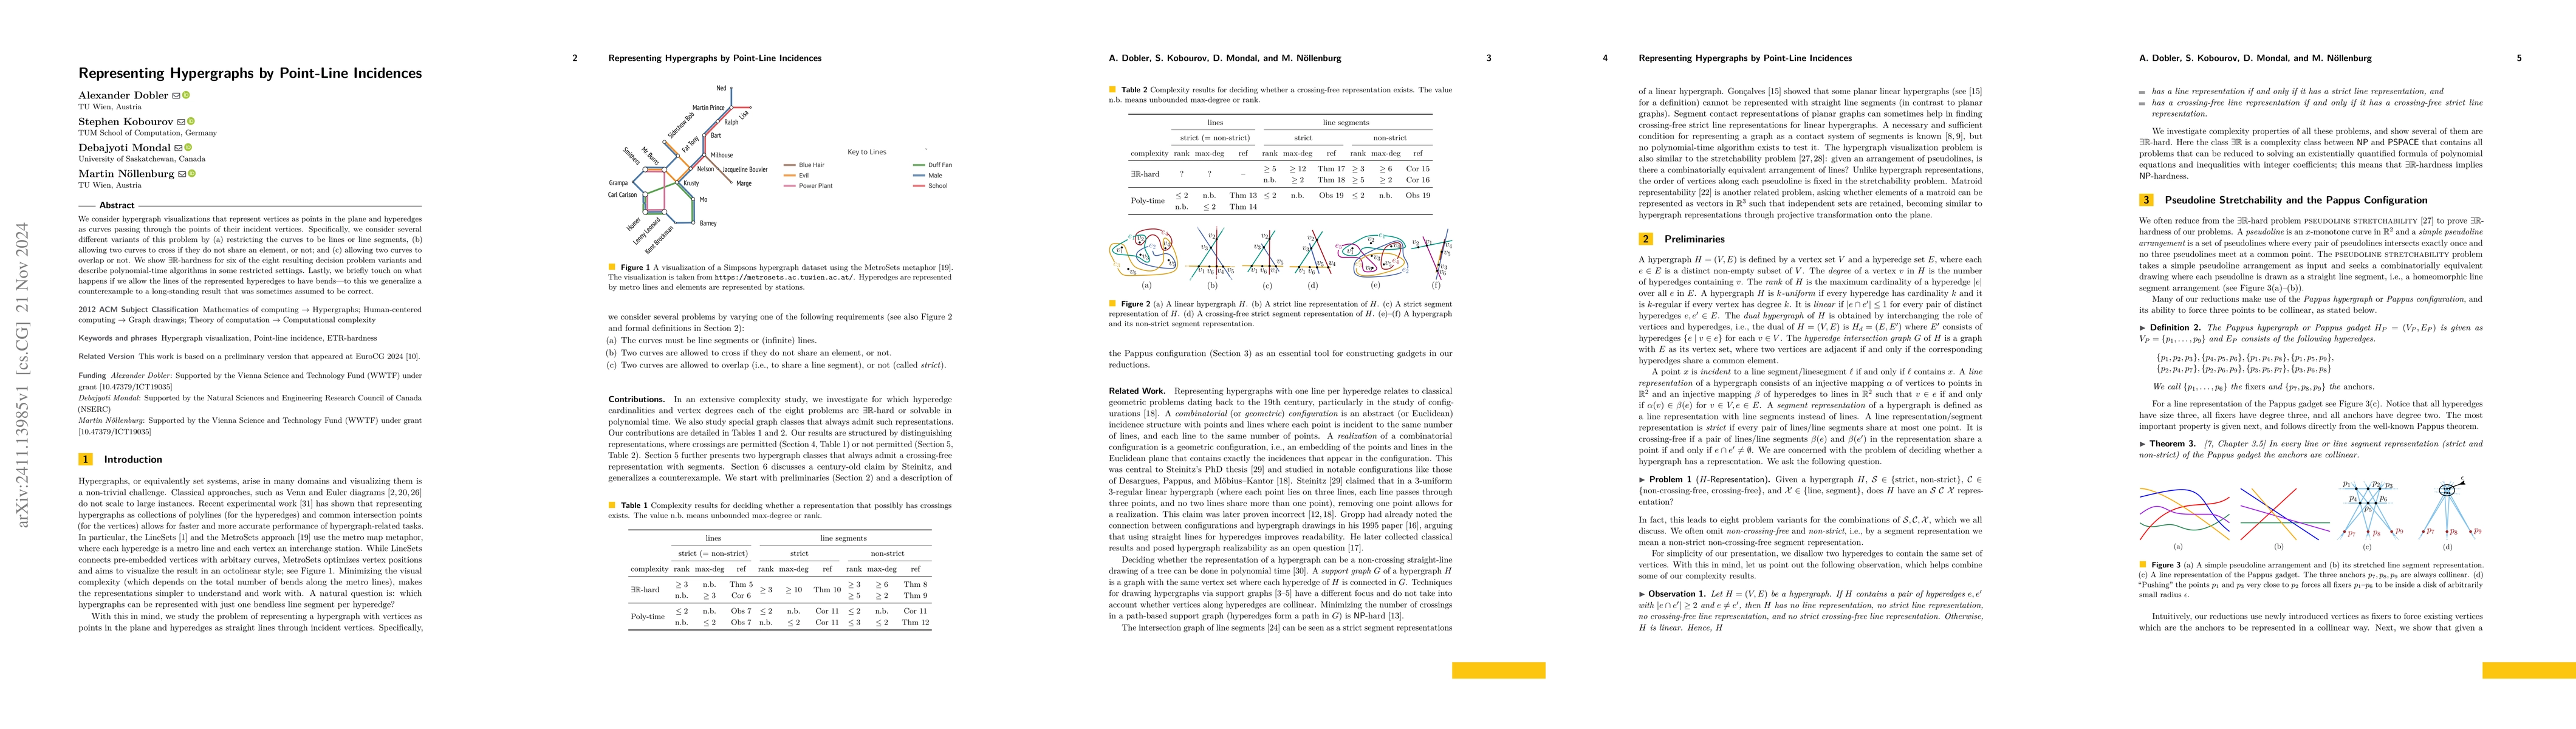
We consider hypergraph visualizations that represent vertices as points in the plane and hyperedges as curves passing through the points of their incident vertices. Specifically, we consider several d...
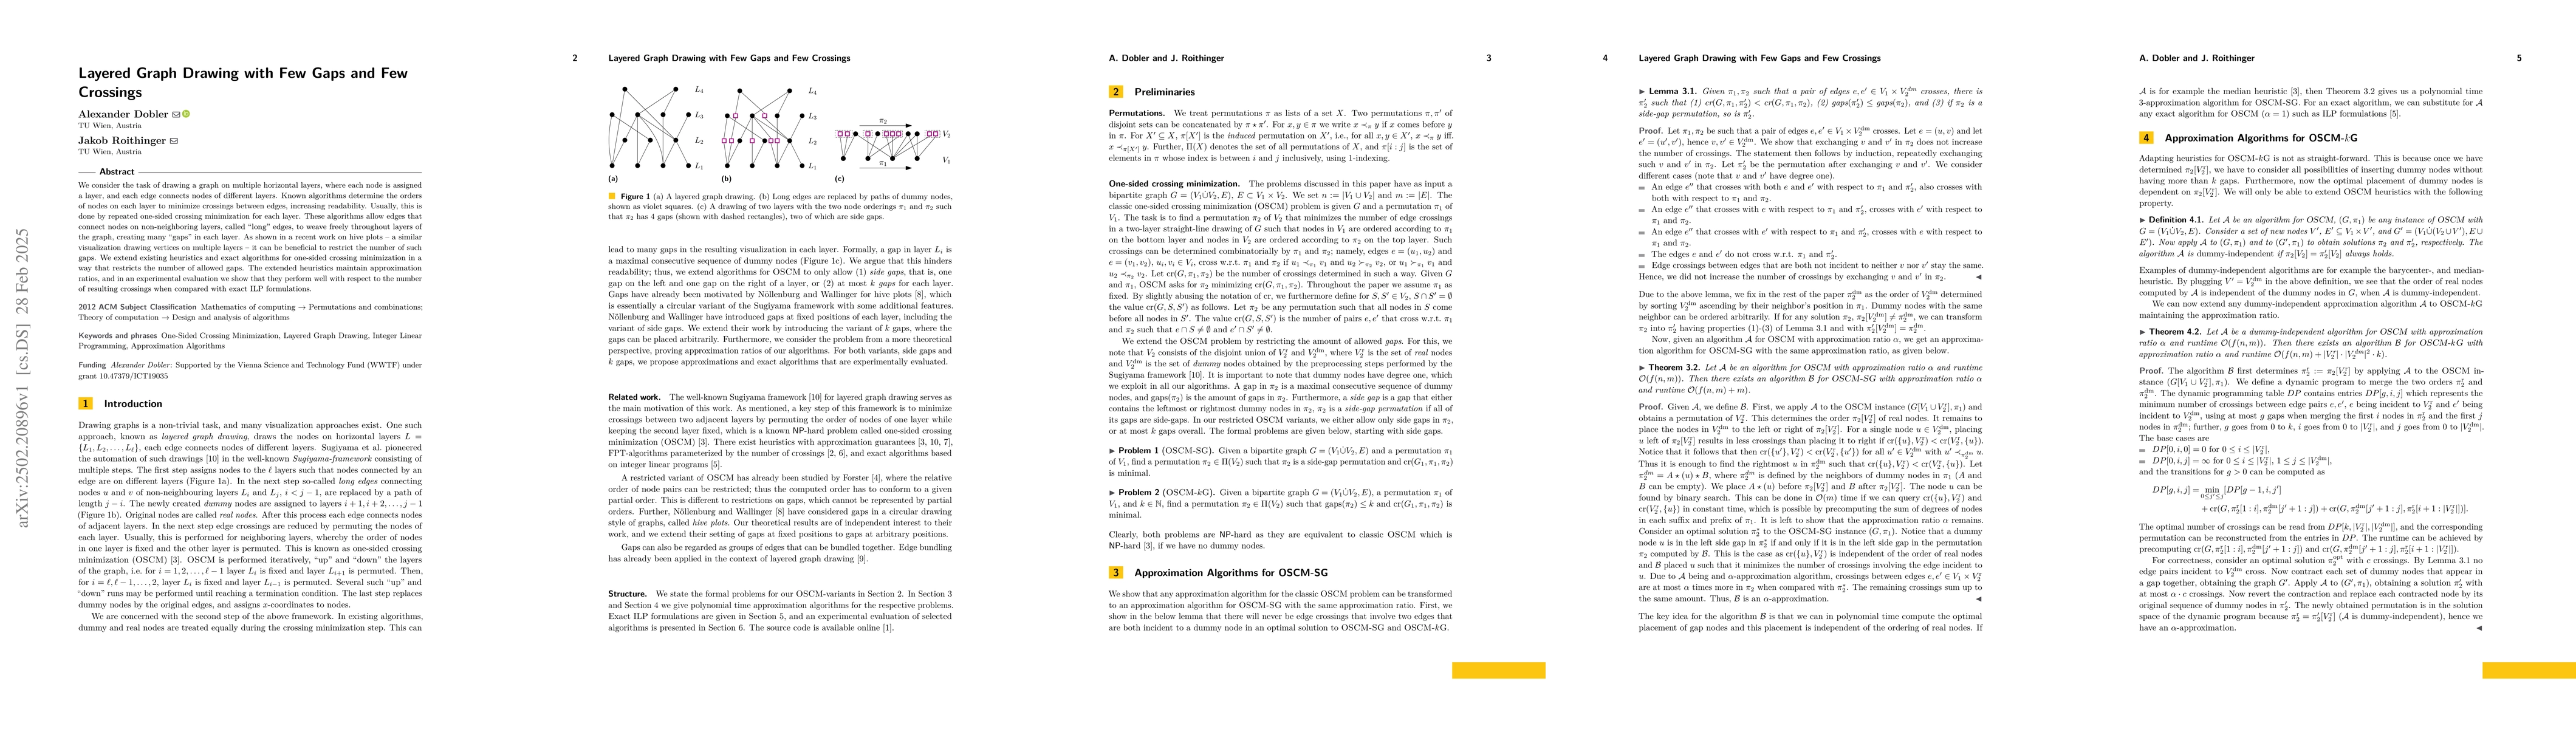
We consider the task of drawing a graph on multiple horizontal layers, where each node is assigned a layer, and each edge connects nodes of different layers. Known algorithms determine the orders of n...
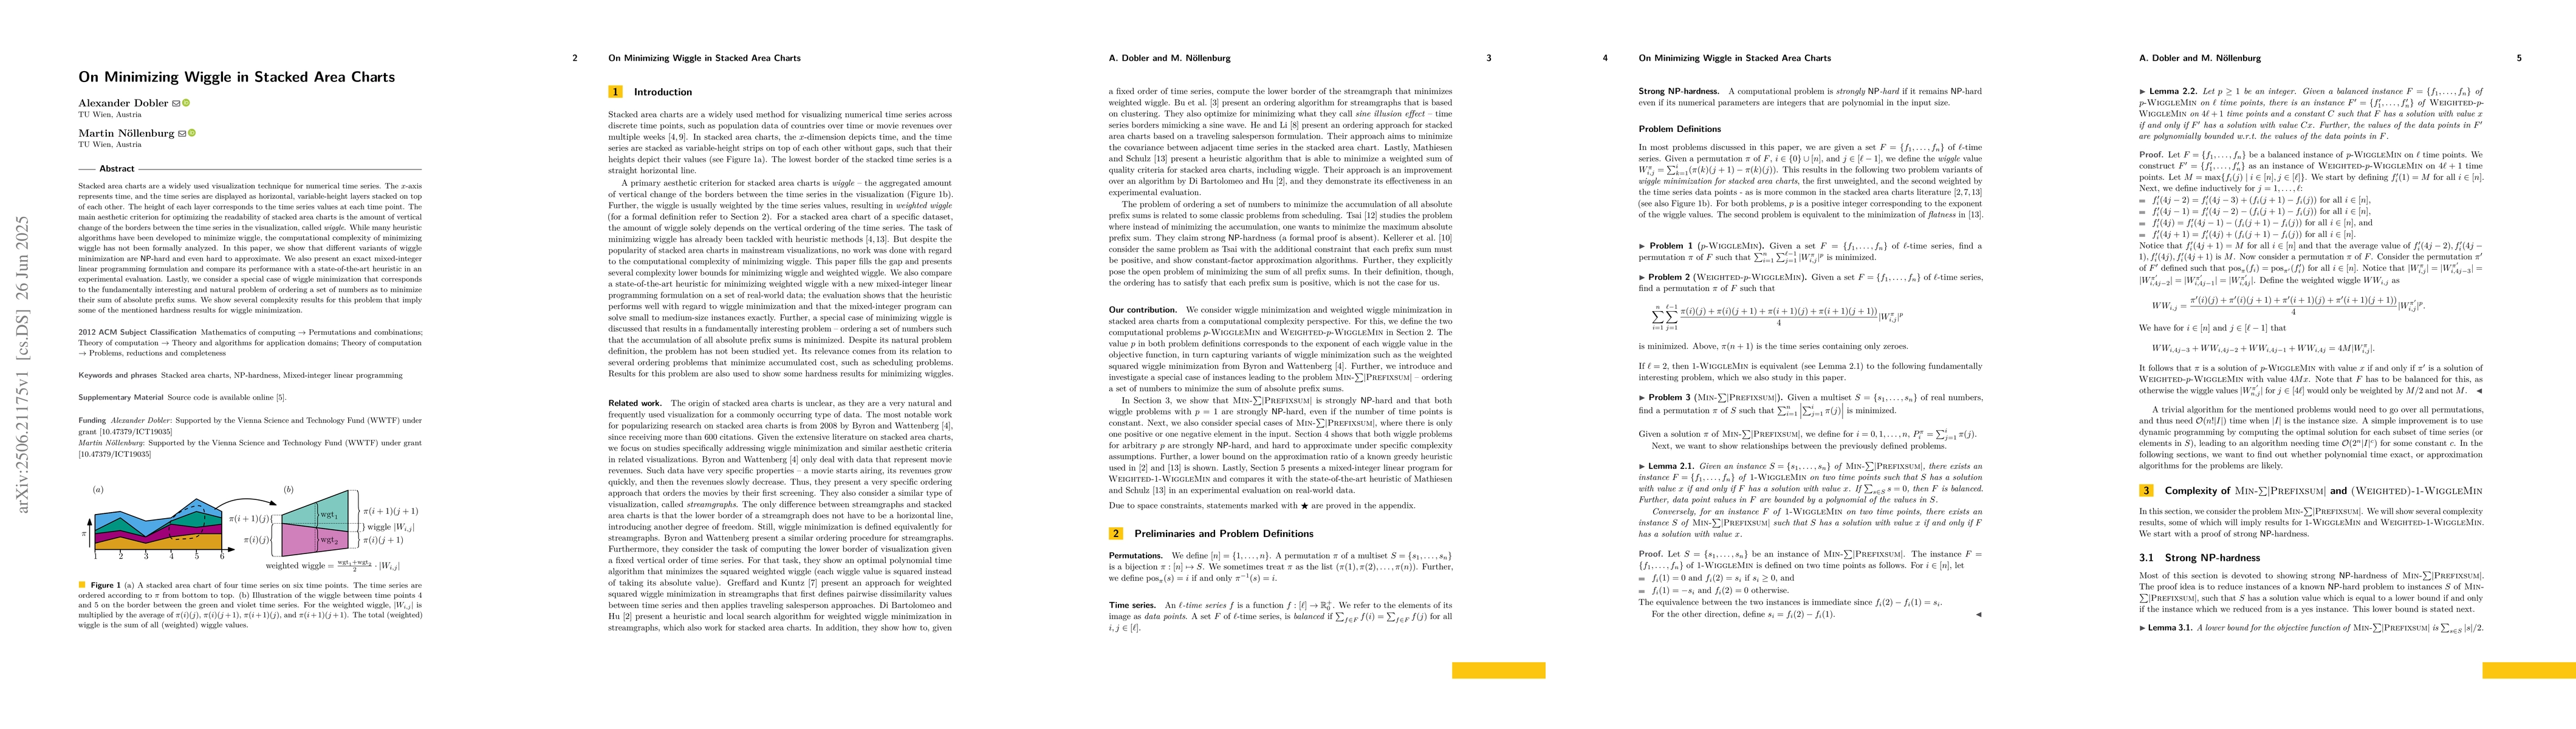
Stacked area charts are a widely used visualization technique for numerical time series. The x-axis represents time, and the time series are displayed as horizontal, variable-height layers stacked on ...
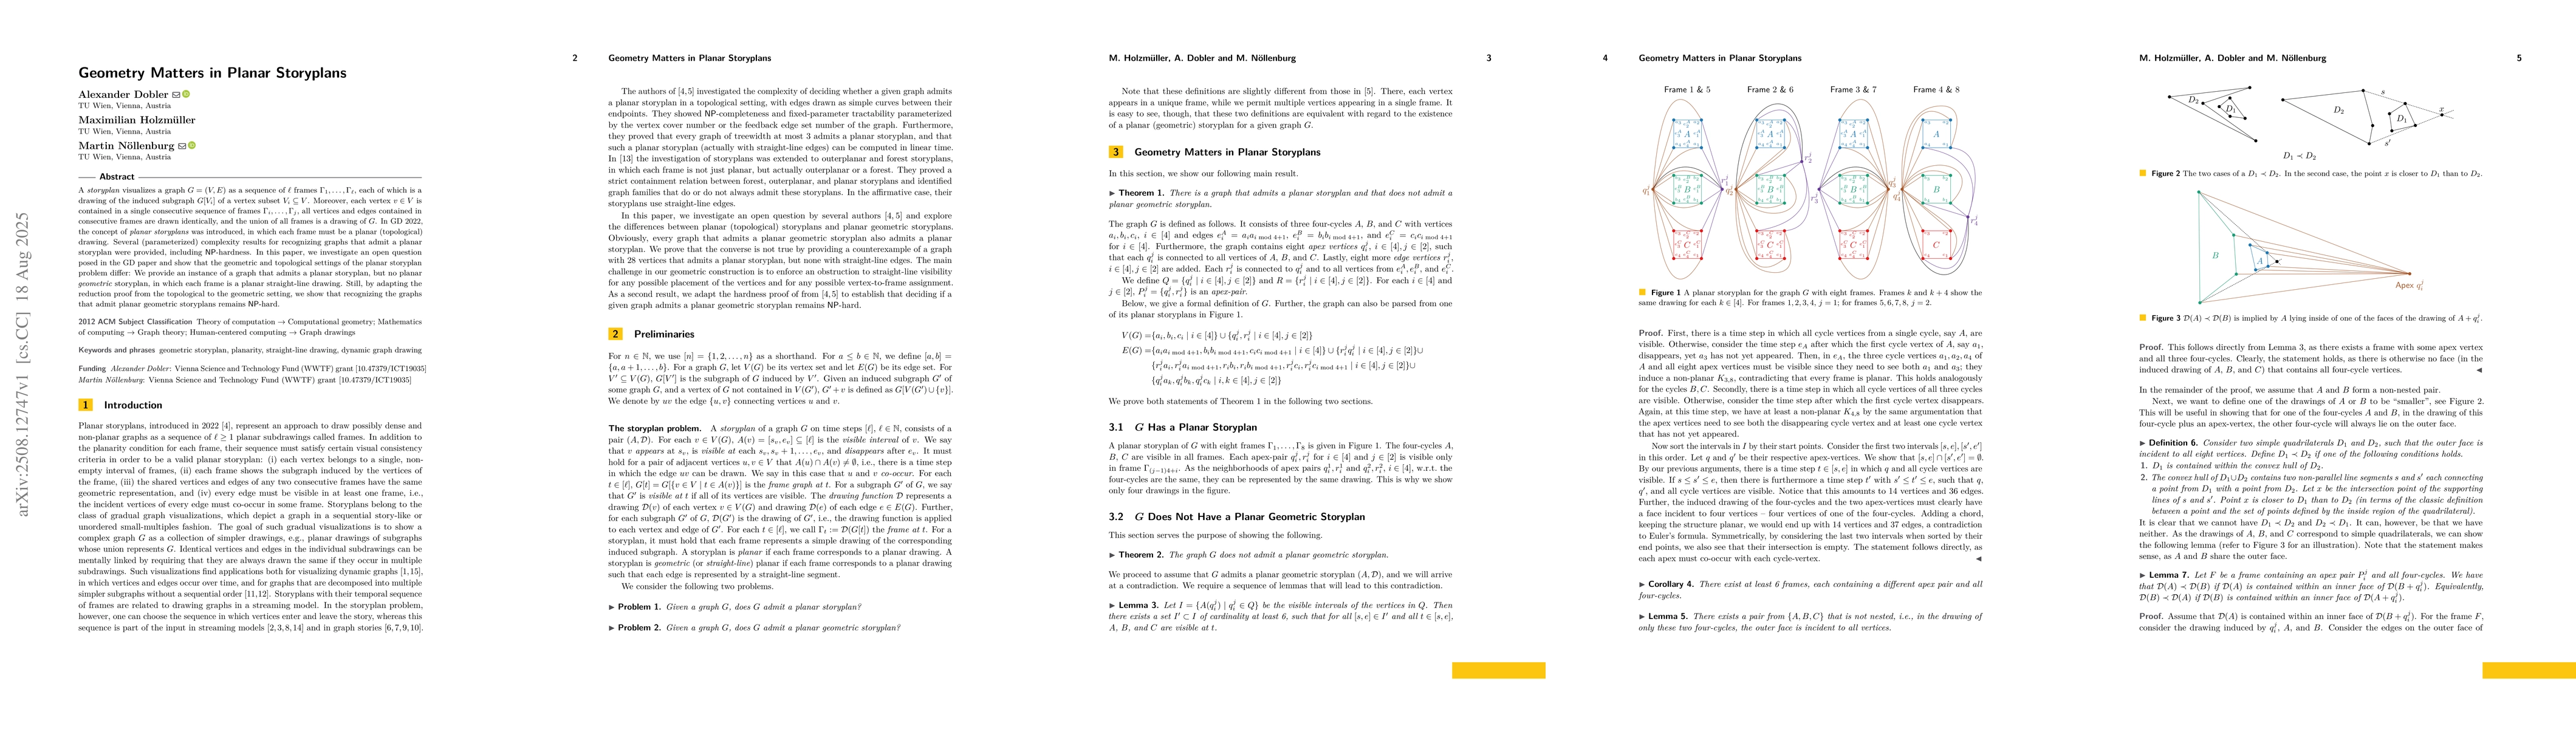
A storyplan visualizes a graph $G=(V,E)$ as a sequence of $\ell$ frames $\Gamma_1, \dots, \Gamma_\ell$, each of which is a drawing of the induced subgraph $G[V_i]$ of a vertex subset $V_i \subseteq V$...
A storyline visualization shows interactions between characters over time. Each character is represented by an x-monotone curve. Time is mapped to the x-axis, and groups of characters that interact at...
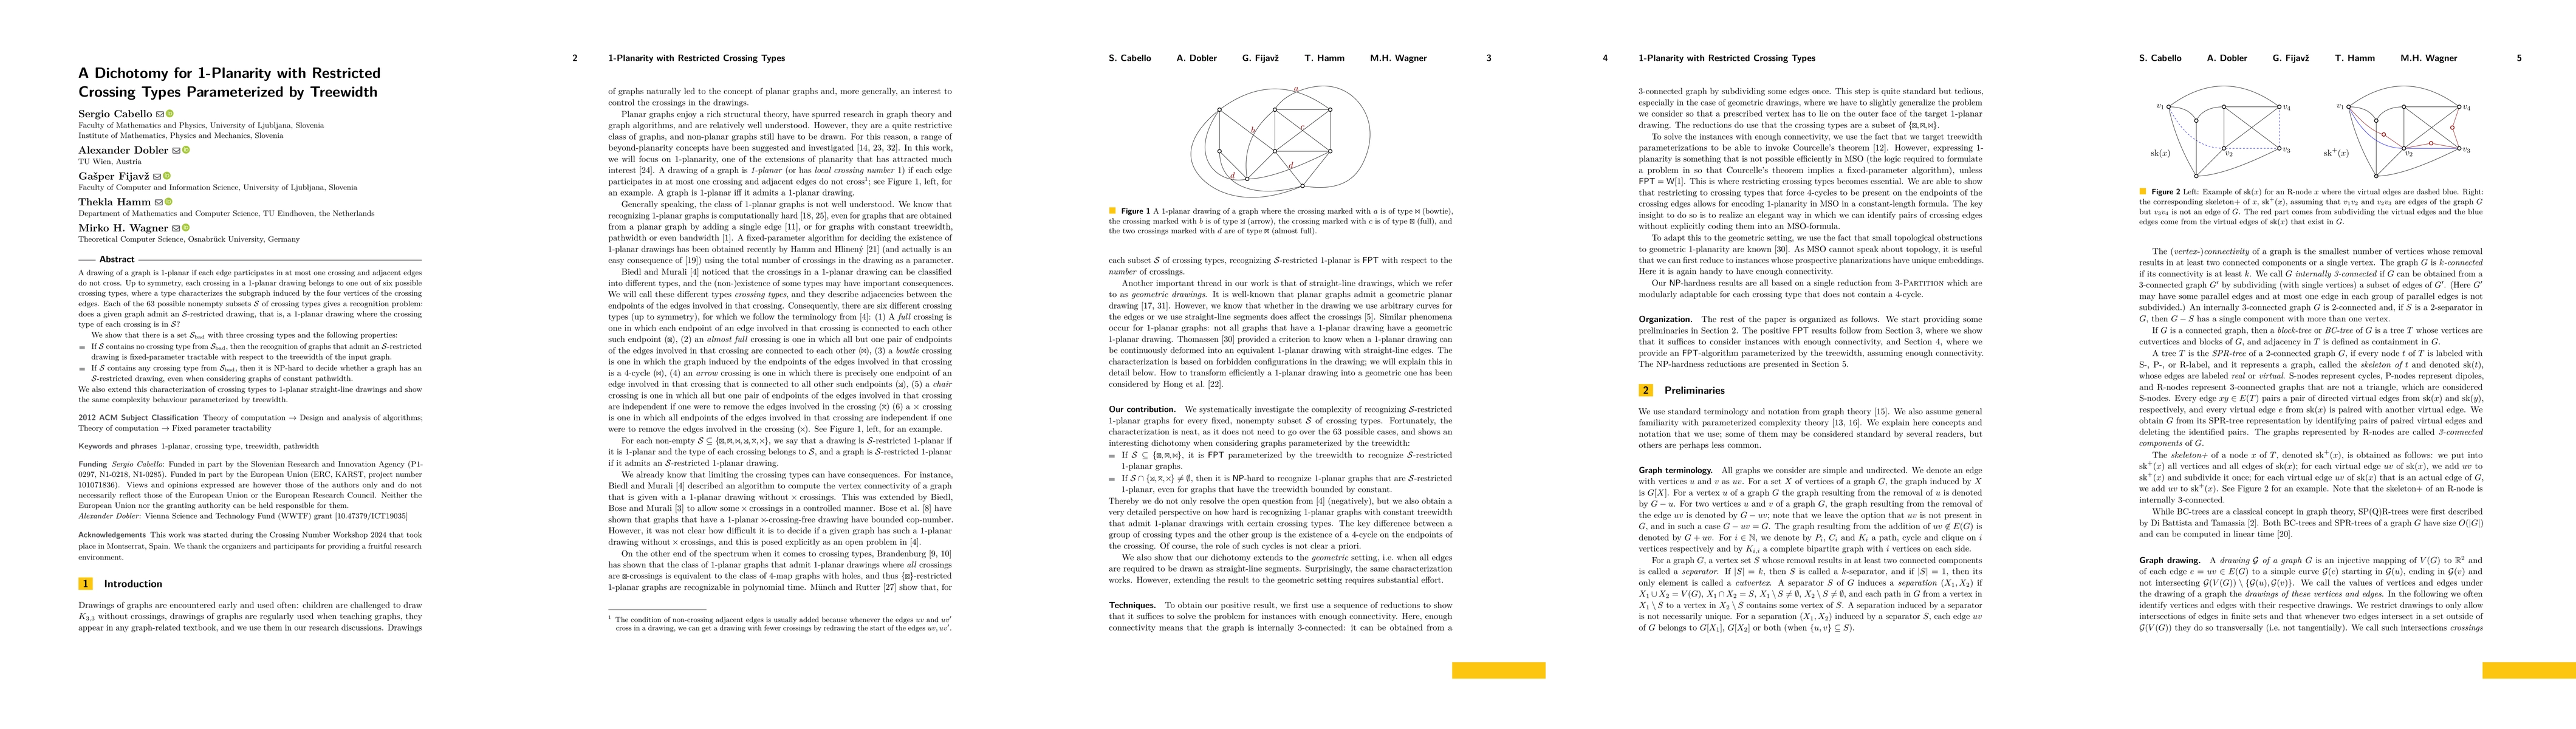
A drawing of a graph is 1-planar if each edge participates in at most one crossing and adjacent edges do not cross. Up to symmetry, each crossing in a 1-planar drawing belongs to one out of six possib...
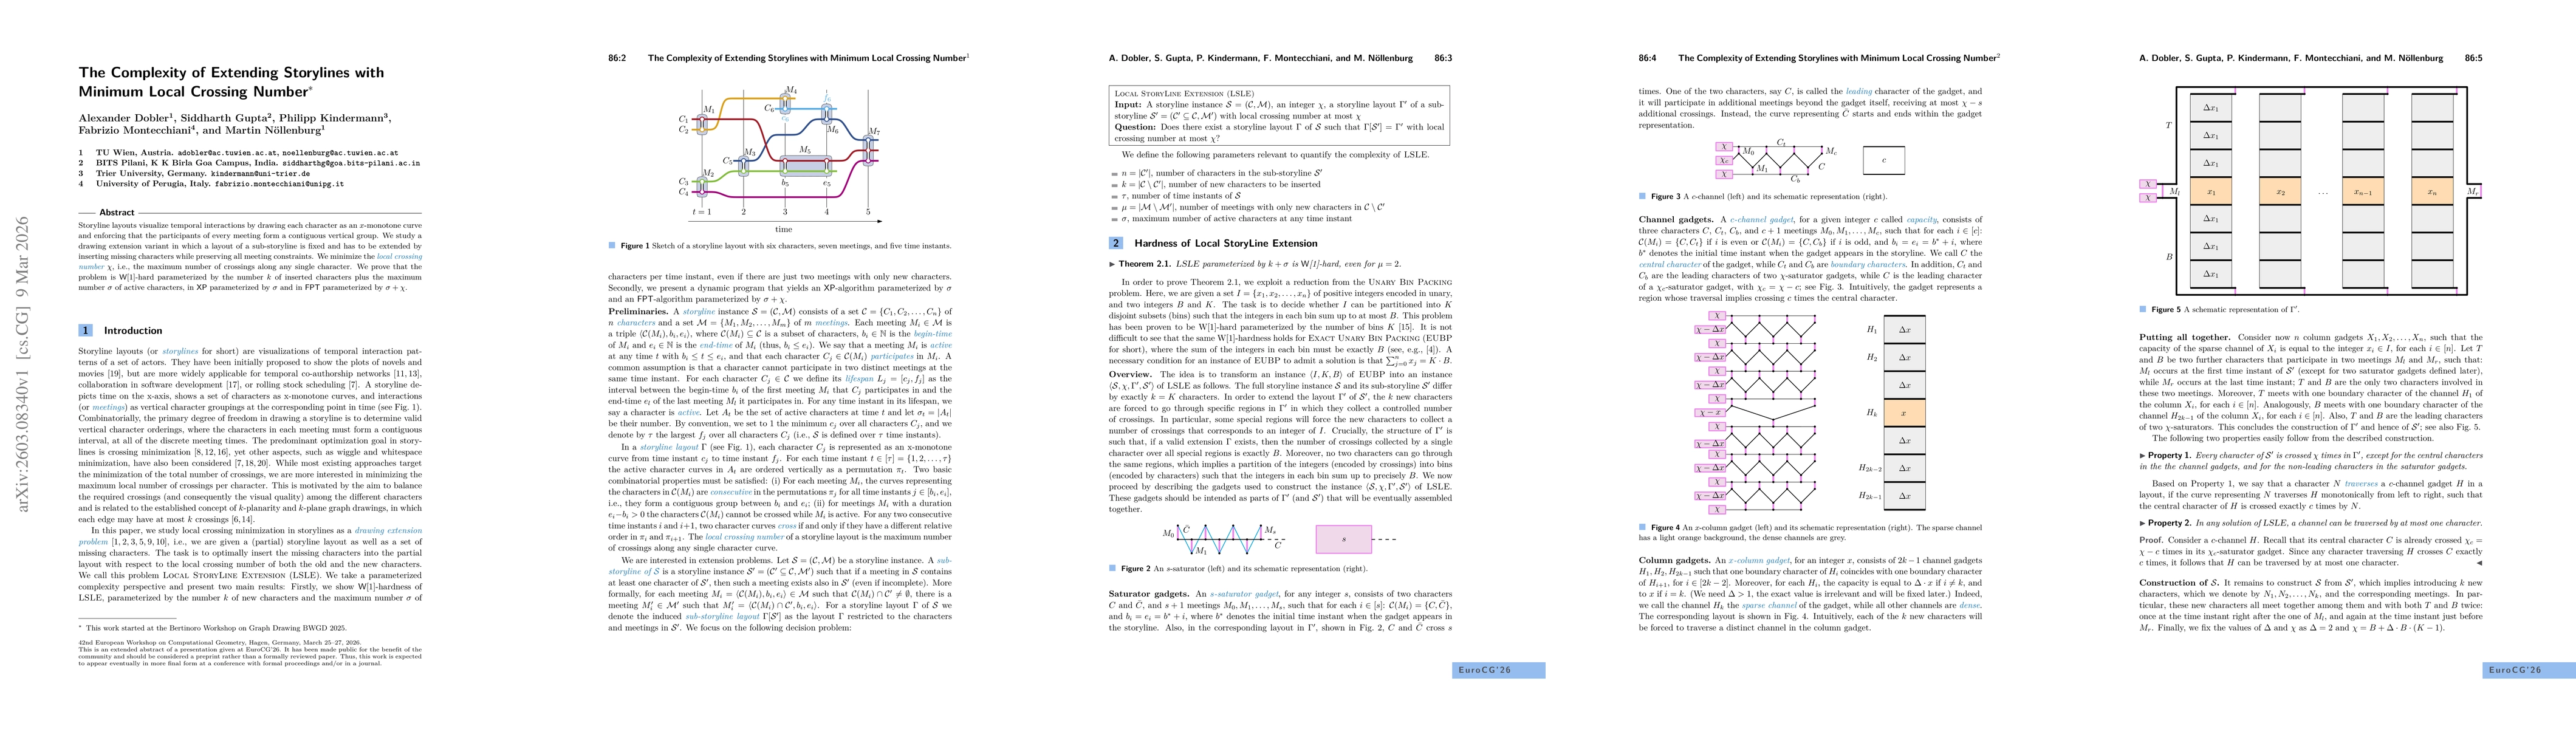
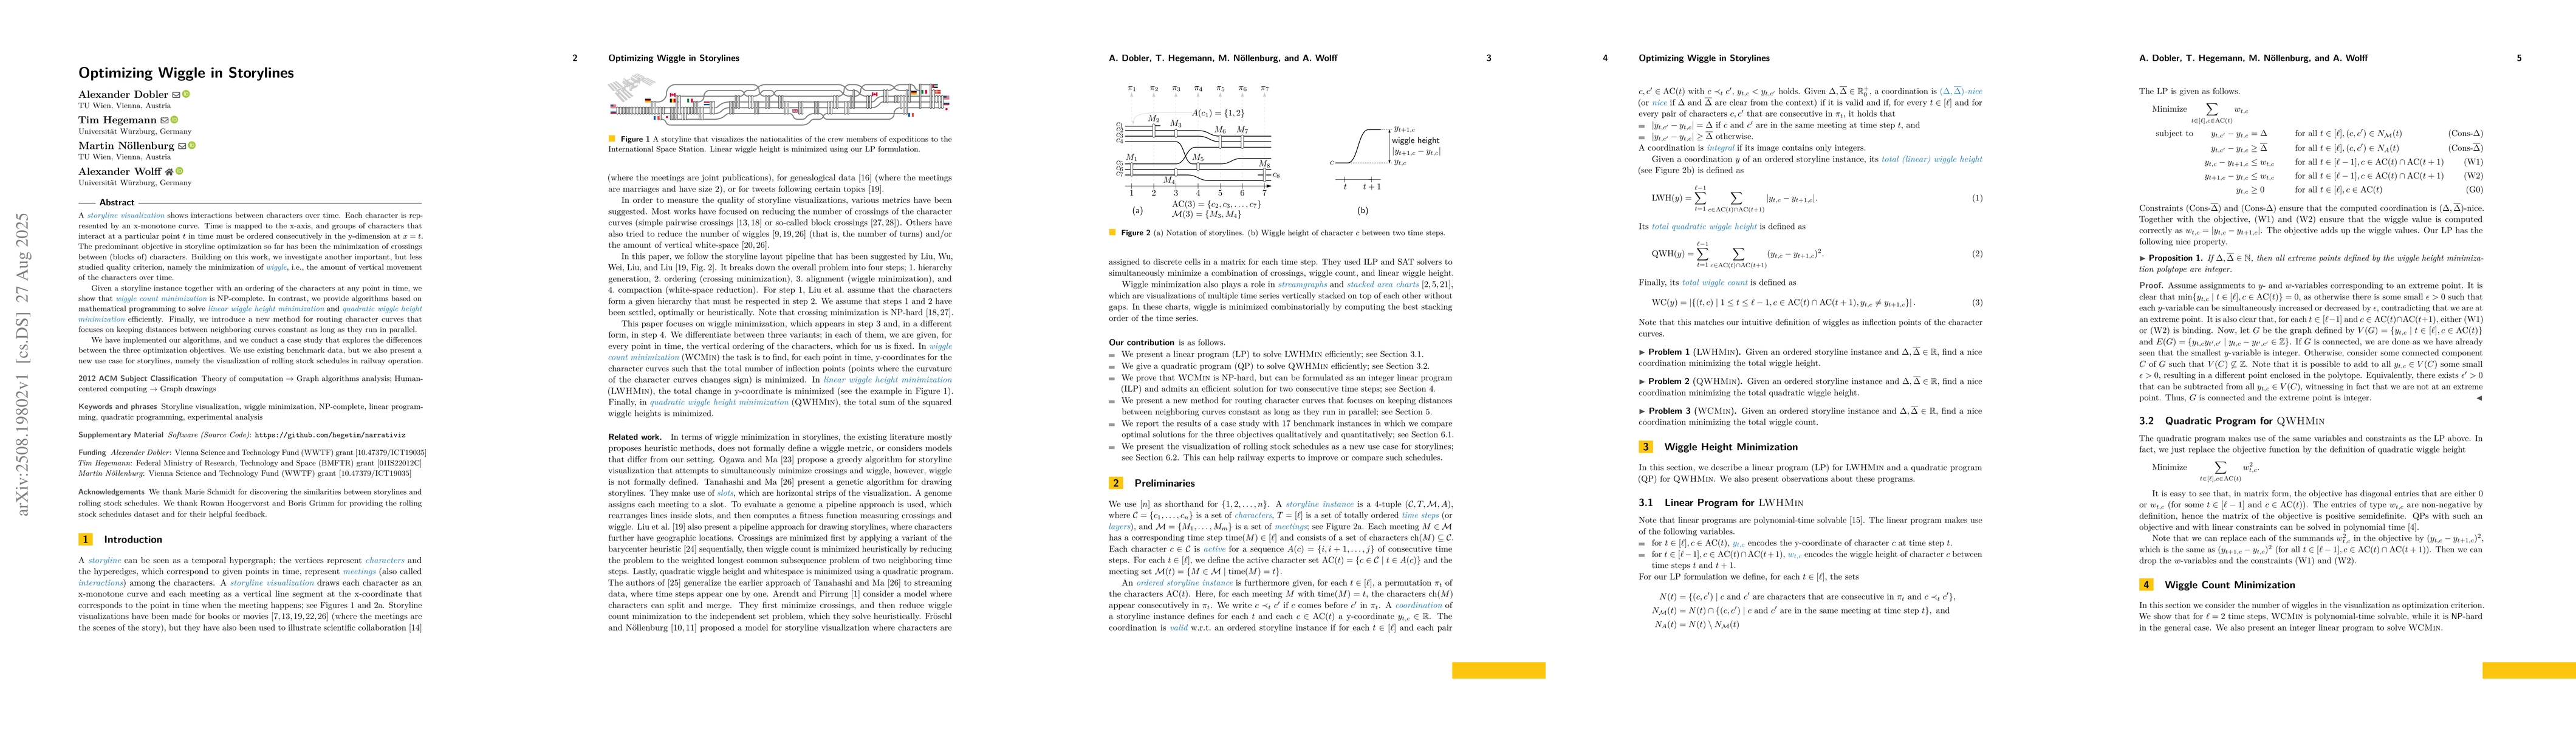
Storyline layouts visualize temporal interactions by drawing each character as an $x$-monotone curve and enforcing that the participants of every meeting form a contiguous vertical group. We study a d...