Publication
Metrics
AI Quick Summary
This paper demonstrates that minimizing line segments in linear diagrams is an NP-hard problem, akin to a well-studied problem. It introduces new algorithms based on a traveling salesperson formulation to compute optimal linear diagrams, incorporating constraints like set order and hierarchical structures, and shows superior performance compared to previous methods.
Paper Preview
Abstract
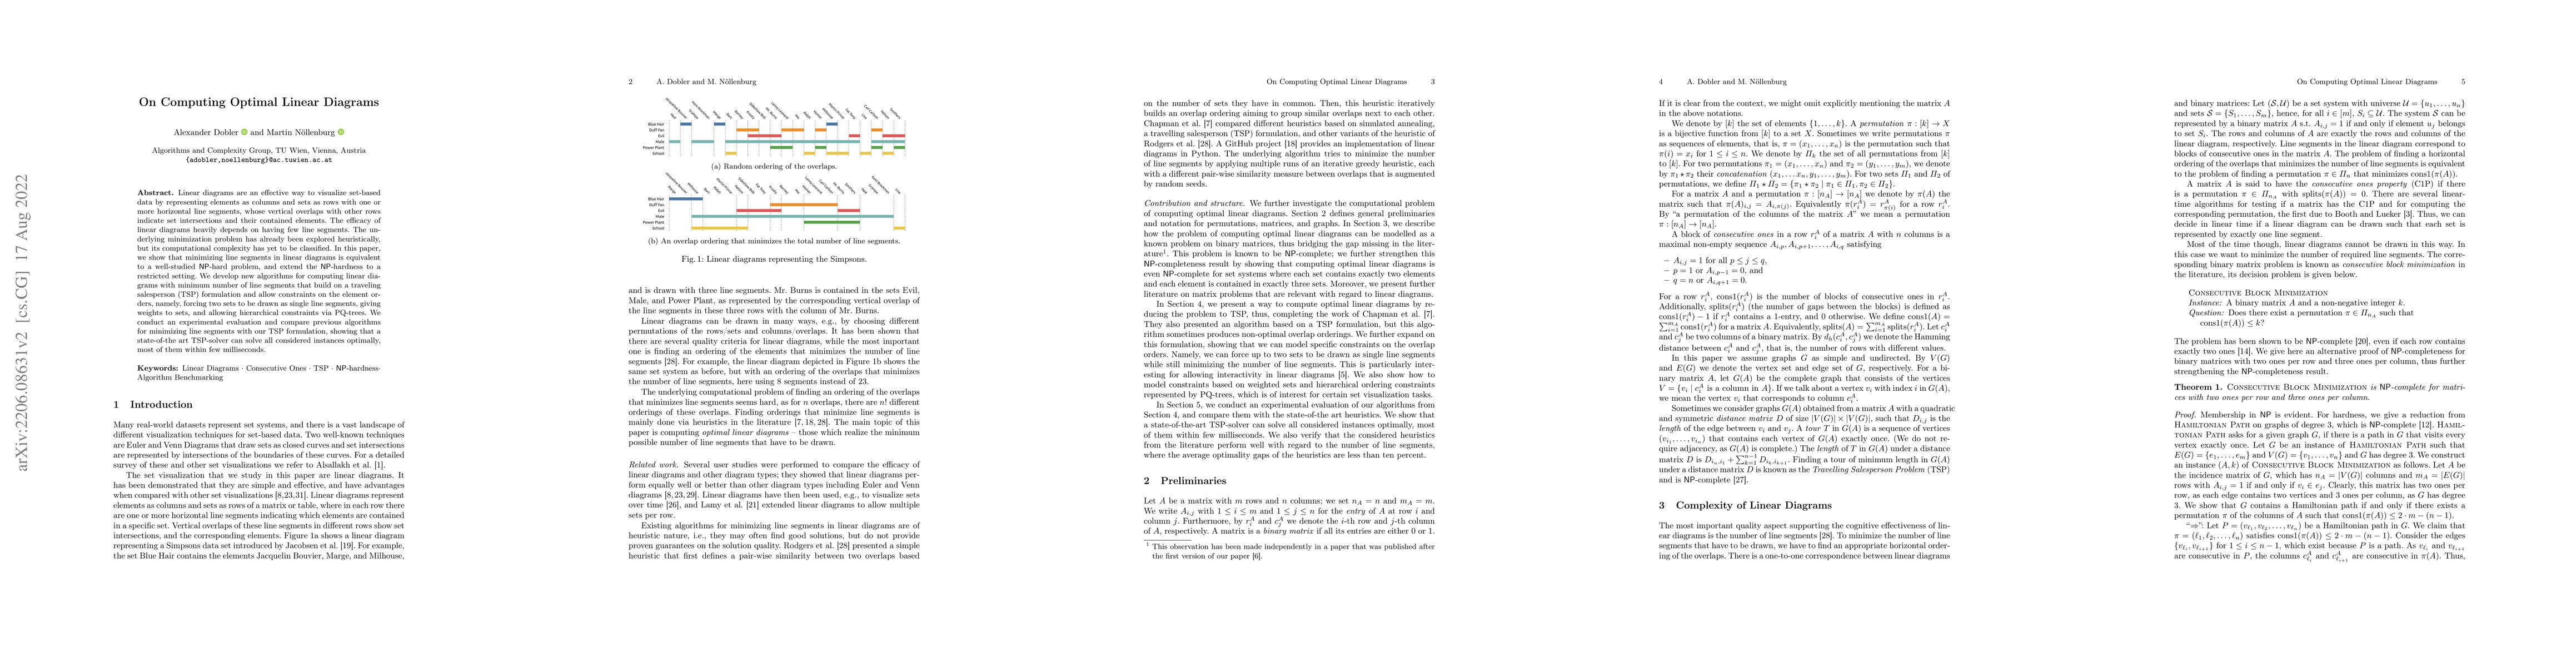
Linear diagrams are an effective way to visualize set-based data by representing elements as columns and sets as rows with one or more horizontal line segments, whose vertical overlaps with other rows indicate set intersections and their contained elements. The efficacy of linear diagrams heavily depends on having few line segments. The underlying minimization problem has already been explored heuristically, but its computational complexity has yet to be classified. In this paper, we show that minimizing line segments in linear diagrams is equivalent to a well-studied NP-hard problem, and extend the NP-hardness to a restricted setting. We develop new algorithms for computing linear diagrams with minimum number of line segments that build on a traveling salesperson (TSP) formulation and allow constraints on the element orders, namely, forcing two sets to be drawn as single line segments, giving weights to sets, and allowing hierarchical constraints via PQ-trees. We conduct an experimental evaluation and compare previous algorithms for minimizing line segments with our TSP formulation, showing that a state-of-the art TSP-solver can solve all considered instances optimally, most of them within few milliseconds.
AI Key Findings
Get AI-generated insights about this paper's methodology, results, significance, and more — seven facets brought into focus.
Impact
Paper Details
Authors
PDF Preview
Key Terms
Citation Network
Current paper (gray), citations (green), references (blue)
Display is limited for performance on very large graphs.
Discussion 0